|
|
Post by sd on May 11, 2017 20:30:15 GMT -5
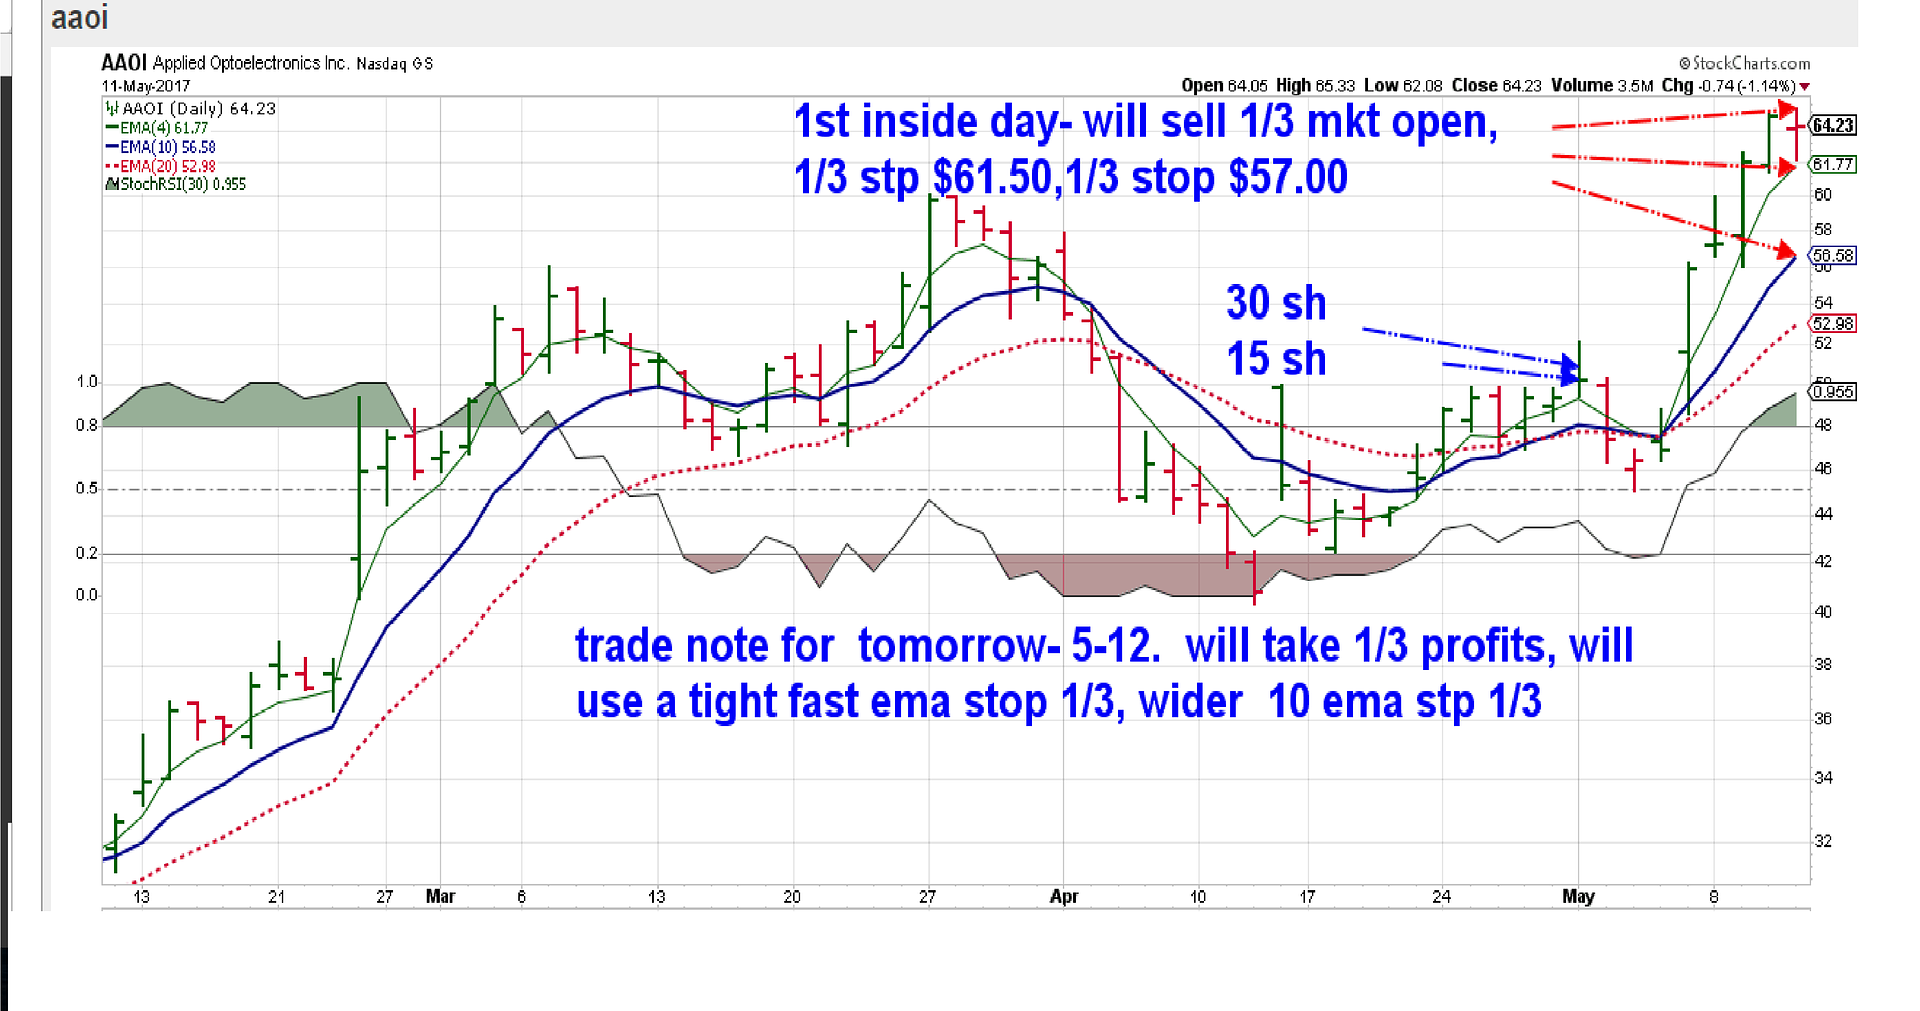
Nice gain to date in AAOI- in a short period- My entry was on the breakout of the base- and i took 2 trades- based on price moving higher- While both were filled, it was followed by a pullback and retest into the base- so i held a fairly wide stop below the low.... Price then moved sharply higher on good earnings- and today 5-11- had an inside non-trending day. i think the net gain presently in this trade is 20%- The temptation is to simply sell here, lock in the gain- but the opportunity is here to set wider stops, and still have all stops above my entry cost.
The goal is to not let Fear (of loss) cause me to take a profit and to sell all of the position-
I can lock in a portion of the gain despite that the price did not close at or below the fast ema- Selling 1/3 here at market-
The remaining 2 orders are based on stops at the 4 ema and the 10 ema- All will lock in profits, but ideally the remaining 2 positions will not be both taken out, and the trend may continue higher-
AAOI is volatile- it has had over a 150% gain since jan, with a 32% decline in the midst-
I don't know where this trade will end- but having all 3 orders to be able to lock in gains allows me the opportunity to not have to watch this obsessively- Stops are set , let's see what unfolds-
The Key point i want to make to myself is that I have to allow a trade room to run - and become that larger % gainer that offsets the smaller moves- Having an approach to trend trade a more volatile equity- got to protect the downside- but with some realistic room for normal volatility.
On the other side of the coin, I have also tightened stops on my other positions- I am fully long, and optimistic-
Applying the simple approach of viewing price relative to trending moving averages is the basic view I take perspective from. Depending on one's time frame, one could use slower moving averages for longer term positions- the 3,4,5 ema are good for capturing short term trend moves - on the daily- flexibility increases as one views price and trend with longer ema's.
Using shorter term moving average crossovers did not fare well with Arthur hills analysis- see earlier post .....the slower crossovers produced fewer whipsaws , larger gains, fewer commission costs. However- I think that shorter term trading is improved -at least for me- in recognizing the trend direction based on the slower time frame- and setting up to trade With the trend-
I also need to mention that this trade setup represented a TA reason to enter (break higher) , and was reasonably close to a defined Point of Failure - where the trade was a bust if it went lower-This has the elements of good trading.....
Edit note- I actually entered AAOI 4 days earlier than shown on the chart, and held through the pullback.
|
|
|
|
Post by sd on May 12, 2017 18:26:13 GMT -5
Sold 1/3 $64.24 at the open. Price moved higher and closed up $65.45. Intentional sell ,although price had not made a close beyond the fast ema-IThe sell served the purpose of locking in a decent gain (20% + ) and allows 2/3 of the position to follow the trade higher, but a bit wider.
|
|
|
|
Post by sd on May 18, 2017 21:54:11 GMT -5
Well! A minor market reaction to political news propoganda of the day- Special prosecutor to investigate Trump, Comey's memos contradict Trump's recollection- of their conversation -What a distraction to getting about the business that benefits the American Taxpayer! Trump needs to give up his ego addiction to Twitter and be presidential- and needs to understand that while he was elected President, and was going to drain the Swamp... The swamp is vast and entrenched and he is an intruder-He is bogged down- largely of his own doing for stepping into the stuff he should be arms length away from.
i think this is troubling and a huge distraction that the media will focus on, rather than the merits of economic policy, tax reform, immigration- health care- Items that need resolution and action. Instead, we sink into the quicksand of political immobility ....
That should be Enough political commentary- but it affects the markets whether we like it or not- Trumps initiatives will lack horsepower if he is embroiled in constant battles and investigations ....Politicians will be trying to position themselves to survive possible fallout. A lack of cohesive affirmative action by the politicians will
likely be the end result-
The effort to oust Trump is Today's Front page....and the Republicans are scrambling to position themselves defensively. Career politicians are wanting to save their positions-and see who survives...Let's see if they can get the work done we sent them to congress to do- take actions on the initiatives that will benefit the US of A.
If our representatives do not represent our values- we should see they are not reelected- That means become an active participant in the next process of elections...
Got that bit of venting out- d**n politicians cost me $$$.
To that point- Markets do not Trend the majority of the time-
This minor inflection of the past 2 days -and it was minor- certainly is an attention getter and allows one to consider the mechanics of their approach.
So, to keep this minor pullback in perspective- suppose it continued for 2 or 3 more days- instead of a 2% decline- how about a 5, or 10% pullback- Even this would be seen as a pullback within an uptrend-
Does today's recovery mean the status quo has resumed? Or was this decline just a preamble of what May could deliver?
There is no way to tell, but i take this latest trend bump as perhaps an indication to expect more volatility in the weeks ahead- and perhaps a Go-Away in May- reduction in exposure is prudent?
note that the Q's significantly outperformed the S & P 500/SPY so far this year- by a factor over 2x- This means that an investor would be rewarded by 100% more-if they had selected among the indexes- The q's vs SPY.
The point i hope to make is that opportunity exists in some market segments when it is perhaps stalled in others- The horse race players often outperform when applying a momentum apptroach.
As the horse race notes- some of the default picks have outstanding gains- compared to the market. There is potentially a lot of Risk - but also a lot of potential reward- in finding a stock/etf/sector that is outperforming- The question becomes ... If drilling down into the market to find the better trends, also equates with greater downside risk- what approach to that more volatile pick gets the best gain over time?
|
|
|
|
Post by sd on May 19, 2017 14:20:45 GMT -5
5.19.17 Trade - The Scottrade account allows me to use "Unsettled Funds" Because the commission costs for Scottrade are higher than IB, I am purchasing 69 TQQQ in Scottrade Broad exposure to the tech sector as it is a 2x of the Q's This is a large single position holding in what was meant to be a longer position term account , and not representative of a typical trade position.
$99.67 @ 10:27 am . I will use yesterday's swing low $94.63 as a critical reaction low that ideally will not be retested.
This is a somewhat wide initial Risk- I did not buy at the open- wanted that to settle out before making a purchase- Risk on the trade is $5 x 69 =345/6884 or 5%.
This is an initial stop-loss calculation on this entry, and I will have to adjust this- as needed. I do not expect (we never do !) to see the same volatility ensue because of more political intrigue in the immediate future- but you never know-
Qcom is making a nice upmove today. I was taken out yesterday$55.10 on a spike down- thought i still held it.
Only survivor was SPLV -
Broad market rally at this moment.
It gives me an opportunity to adjust my exposure- I'll be buying Baba- -(Yes at the new high Swift-)
Afternoon update-I went back long - Sold the SPLV and purchased OEUH as a replacement- OEUH has a better trend, gains on the year. I will look at including SPLV in the investment account-
IB- bought smaller portions -I thought i had a 3 day delay on clearing- apparently not the case anymore- I just cannot sell within 3 days using "unsettled" cash- It
ignites the fury of regulators, and would change my "investor" status .
- went back into ARGT, ROBO,AAOI, added Hack, BABA. I was considering BRKB as it has had a substantial pullback recently-giving up most of the gains for this year. I want some diversification in the positions- I could have taken SMH vs exposure to a sin gle company, AAOI but I've been lucky with my entries in and exits ...and it provided more sizzle-and risk - than the ETF.
I looked at Shop, EXAS -neither rebounded today- and under a declining moving average- Not to be bought here IMO.If the market is rallying, these should participate-
ITA has bounced back - but i'm concerned that the Trump initiative on defense will get mired up- and go no wheres.
Instead of adding Botz, I selected ROBO- trend line is steadier- Botz appears choppier in recent action.
I've had an on and off- discussion with a friend regarding stops- and the decision whether or not to employ them-This is a critical matter- because eventually you find yourself in a position that you are not a trader in- you've lost so much you are an Investor because you didn't want to take the initial loss- and that only gets harder as the loss b ecomes wider. Stops are a safety net- you may have them too tight- widen them to be clear of whipsaws, and find that you get chopped up and whipsawed time and time again-
This recent 2 day pullback and resurgence in the market is exactly what wears out a trader emotionally who sees his stops hit and then the market rebounds with him on the sidelines-And then you think wider stops are a better solution- That is potentially true- and is easier said than done- I like the way i laddered out of AAOI with 3 trades- potentially, I could have allowed that 3rd stop to be wider- perhaps used the 20 ema- but again it was about retaining capitol- Yes, i had to go back in higher and pay up to get today's position-- But had the sell-off been longer- as has occurred in the past and will occur again.....the opportunity would have been to Buy more following a decline at a lower price- when the downtrend had halted.
Market is listening to "breaking news" as i write this- I'll review these positions- and expand my thoughts this weekend- Essentially, if price is trending- there is no need to trail a stop too close - Very often, price will expand with volatility during the day, but close higher- My general guideline for that is to consider raising the stop if price makes a CLOSE below the ema- Which EMA is up to the individual- Or , as Arthur hill at stockcharts contends- wait to get out until the fast moving average turns down and closes below the 40 or 50 ema- I think he usedd the 10/40 emas in his backtesting models-
There is a Free Month trial at stockcharts to get aqccess to those articles from him and other contributors.
I didn't get to check out too many other potential picks.s- Went to Costco and bought a Lorex security camera system for the house- Just 1 more project to start!
Wading pool to set up for the grandkids this pm!
And, I didn't have to work this Friday!
|
|
|
|
Post by sd on May 22, 2017 19:37:44 GMT -5
Pleasantly surprised to see the majority of my positions participating with the market rally today!
AAOI is really an Industry outperformer- I included a link in the horse race to Finviz- A gereat chart resource to drill down into separate industry segments and find outperformers-1 year performance is up 680%! YTD 203% !
I reduced my position size in AAOI to just 24 shares vs 45- Of course, with today's move I have to ask WHY? Partially it's the Risk-
Conversely, I doubled the exposure on BABA- Can it grow anywhere's close to AAOI? Not likely-
The cautionary note is that any single stock is inherently more Risky- than a sector or industry group ETF. How much RISK one applies for the sizzle- is what the individual can stand. You never know when that 5% PULLBACK TURNS INTO A 30% DECLINE- And no guarantee recovery- It's all just HOPE at that point because one didn't have a plan to exit on weakness- Using AAOI as a good example- The March 60.00 turned into the April $41.00- in just 12 trading days!
Because i realize this similar pattern of decline may occur at any time, my approach will remain similar- I will likely split the smaller position into 2 separate stops depending on performance
|
|
|
|
Post by sd on May 28, 2017 8:11:29 GMT -5
defining the trend with moving averages on multiple time frames gives perspective -
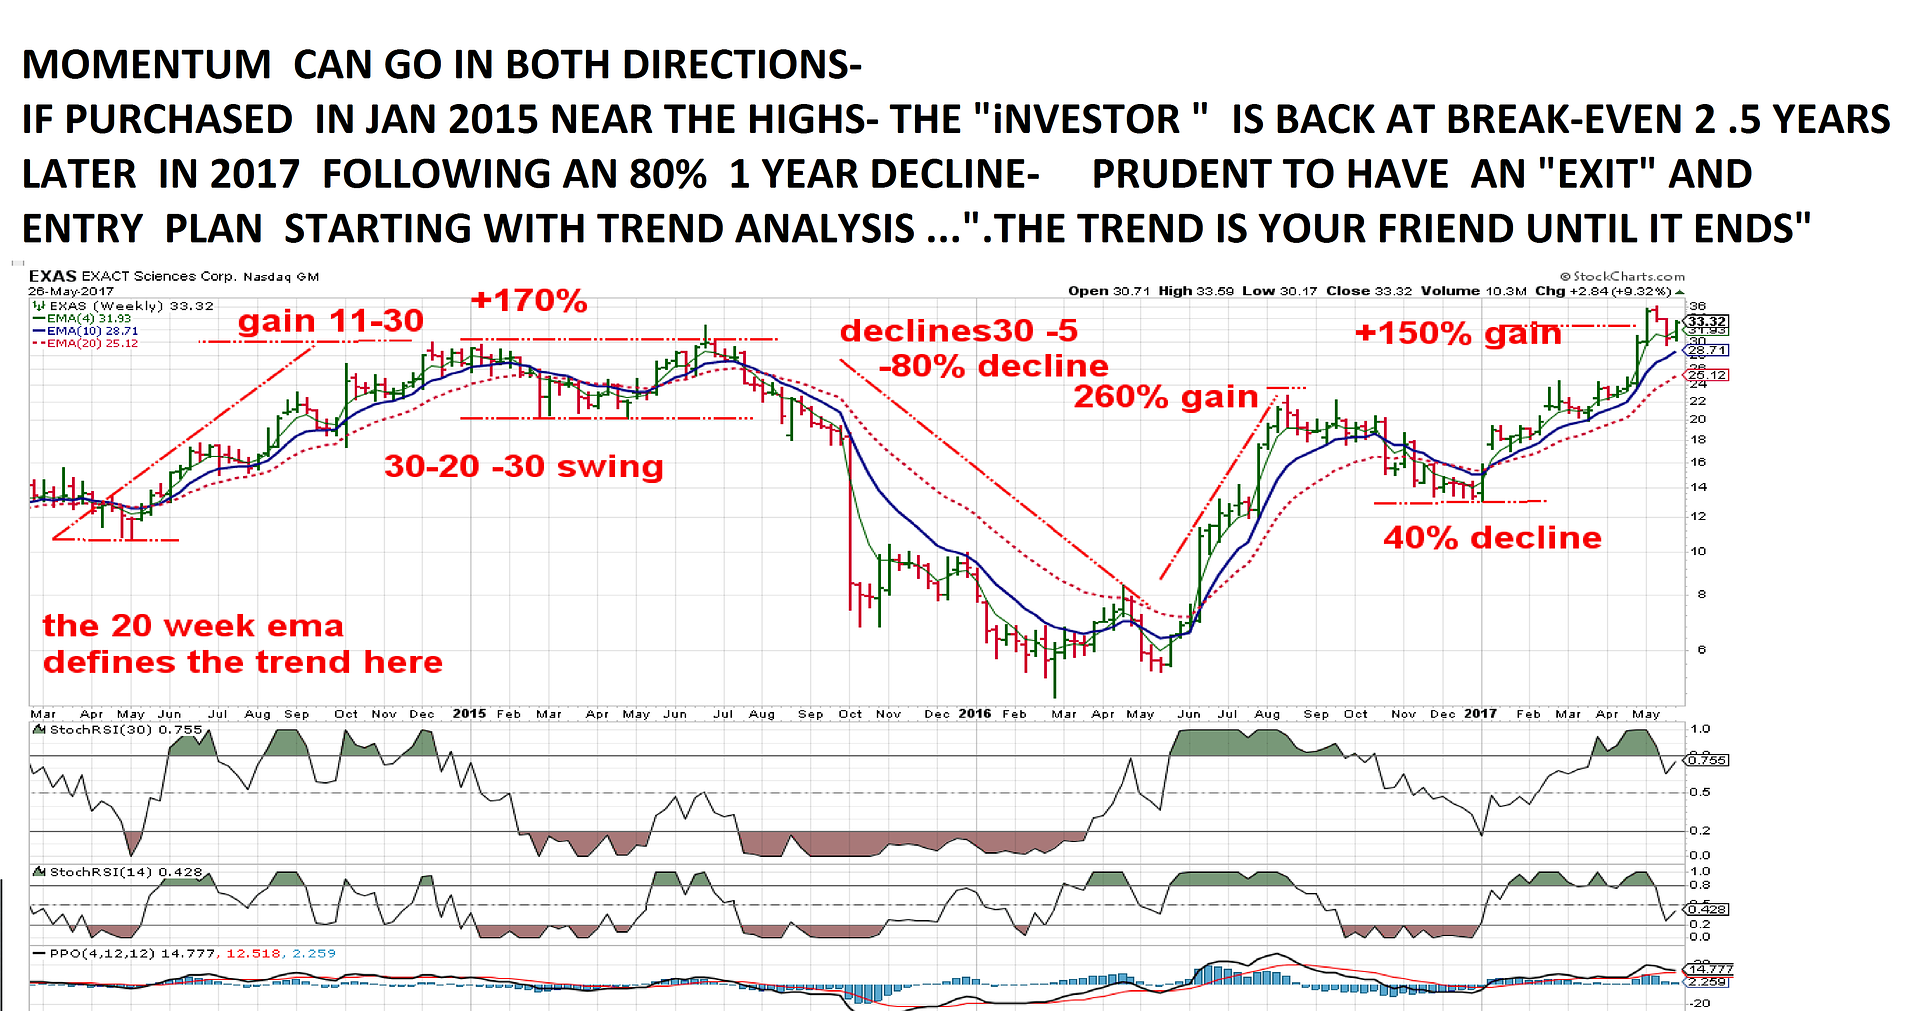
How can one jump into "momentum" stocks- EXAS, AAOI etc without taking on too much RISK?
After all, They seem to have moved too much, too far-and yet continue to do more- until they don't.
EXAS chart is a good example of volatile moves -over a longer period of time - Lots of upside, but also mixed in with periods of downside-
In 1 year of decline, EXAS declined 80% .
Good place to start is viewing the weekly chart, with a few moving averages, - This chart has a 4, 10, 20 weekly-
From my perspective, I would prefer to be in a position when all 3 moving averages are pointing upwards in proper sequence, and out of the trade when the moving averages are all declining - with the faster 4 leading the way lower .
Good Starting point for further review-on a rain day perhaps....
|
|
|
|
Post by sd on Jun 1, 2017 21:14:19 GMT -5
My Trading friend Swift contacted me to tell me that EXAS was up large in after hours- and i responded to ignore the after hours price action because it is likely manipulated-
He found the news report that United health care would accept their testing - and the stock popped 9 or 10% on the news and short covering and indeed more today.
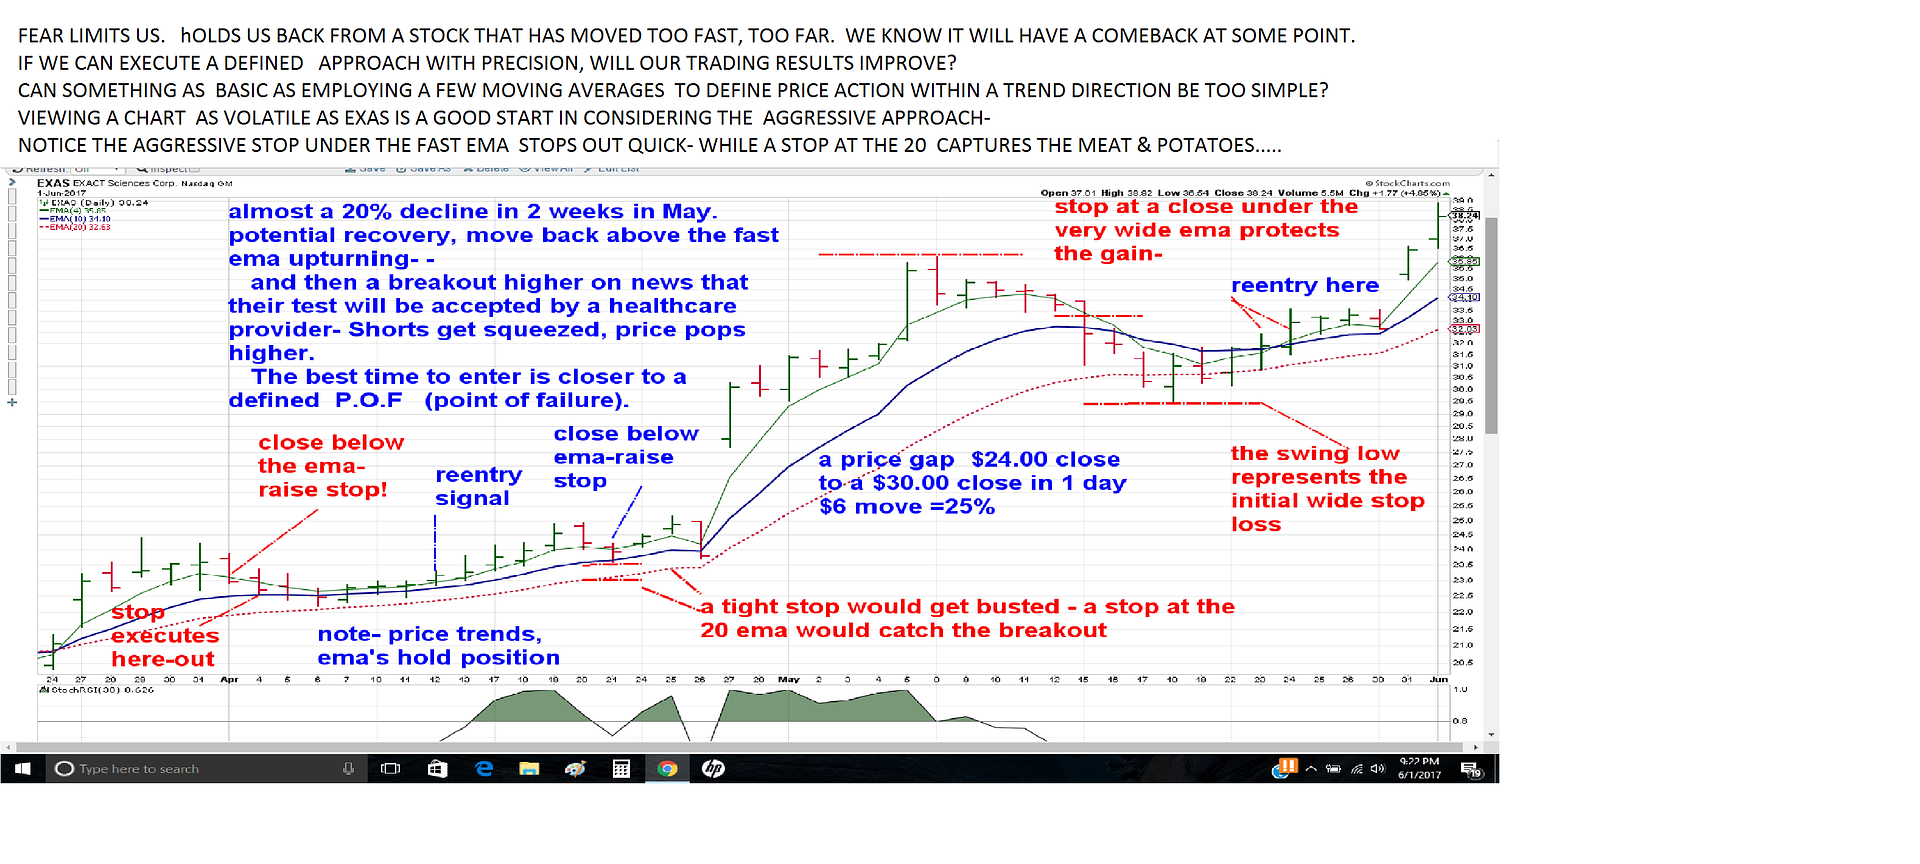
i don't hold a position in EXAS- even though i had posted the chart- I had posted the chart as a good textbook example of price volatility and the rationale that one needs to have an exit and entry plan if trading such a volatile instrument.
It comes down to this-Just my reinforcement to myself btw- It is prudent to limit our Risk - with stop-losses because we will have a percentage of winning trades as well as losers-
Where we set those stop-losses is really the issue- and I've gradually widened my stops- as long as the trend is in my favor- The Fear of losing some small profits , -as long as the market overall is going higher- causes one to put stops too tight for the potential volatility and get shook out of the position.
Too wide a stop is just as defeating- so, defining an approach and a method to view the market from is goal #1-
A series of Moving averages is simplistic and ideal, and a good place to start-
i view price on the daily chart at EOD- i like to use a fast 4 or 5 ema, a 10, a 20- and i should include a 30, and a 50- I don't need to go further than that as a swing trader.
Moving averages are not support levels.
Repeat
moving averages are not support levels.
Understand momentum as the gap widens on the faster moving averages- Like a stretched rubber band, they always will come back into parallel if the trend continues, they will cross and decline if the trend is failing. a fast ema declining is normal, as price pulls back from a momentum move higher, and the trend is still intact. When you have the fast, the 10, the 20 rolling over and the fast heading down- time to have already been stopped out.
Indicators are generally built on evaluating past price action- so They are Lagging indicators- I still have some on charts as a reference- but Price action leads- Indicators only follow-
I don't care about the divergence that the indicators show- because the short term price can keep on truckin for weeks after the indicators warn it is losing momentum- Crud, When price comes back aqnd closes at or below the fast ema i get a very clear visual signal that the momentum is declining- That is the purpose of having a fast ema on the chart- the 4 or 5 ema is generally a good line of seeing price action in an up or down trend-
While i did not hold a position in EXAS, it is an excellent study to consider how one could employ a simple trend following strategy- using nothing but multiple moving averages and noticing where price CLOSES. The CLOSE is important everything below the Open and above the Close is just Noise- as long as the Close is not below the fast ema.
Our stops are usually hit intraday on price penetrations outside of our comfort zone- We think we can control our downside risk with a tighter stop- but in wanting to control our fear of loss, we fail to anticipate the potential volatility that may occur- and find we get stopped out only to see price close higher EOD- This happens to all of us-
Too late to expand on this subject tonight.. but as i have done many times in the past, as well as my trading associates, setting stops is complex- and getting whipsawed intraday and missing out on much larger moves is worth review-
 |
|
|
|
Post by sd on Jun 3, 2017 9:19:06 GMT -5
It's been a good week- Markets all closed higher Friday after a somewhat restful week. Positions are all in the money, TQQQ trending to all new high, with a 3.5% jump on Friday- Although it penetrated the fast ema intraday, and went midway to the 10 ema , My split stops were both below the 10 and at the 20. Because of the wider penetration of the red bar, I raised a part stop to the low at the 10 ema- 104,, and the remaining to the 20 it closed above the fast I'll have to consider a partial sell or a higher limit sell as it appears momentum is trending . Several other positions- AAOI, ROBO all gapped higher as well on Friday, and I'm fully long -
Both Utilities and consumer staples are trending higher- So, perhaps that indicates some shift into safer assets by the Smart Money.
The best defense against the boogeyman of a market that is potentially highly valued is to adapt an approach with stop-losses -
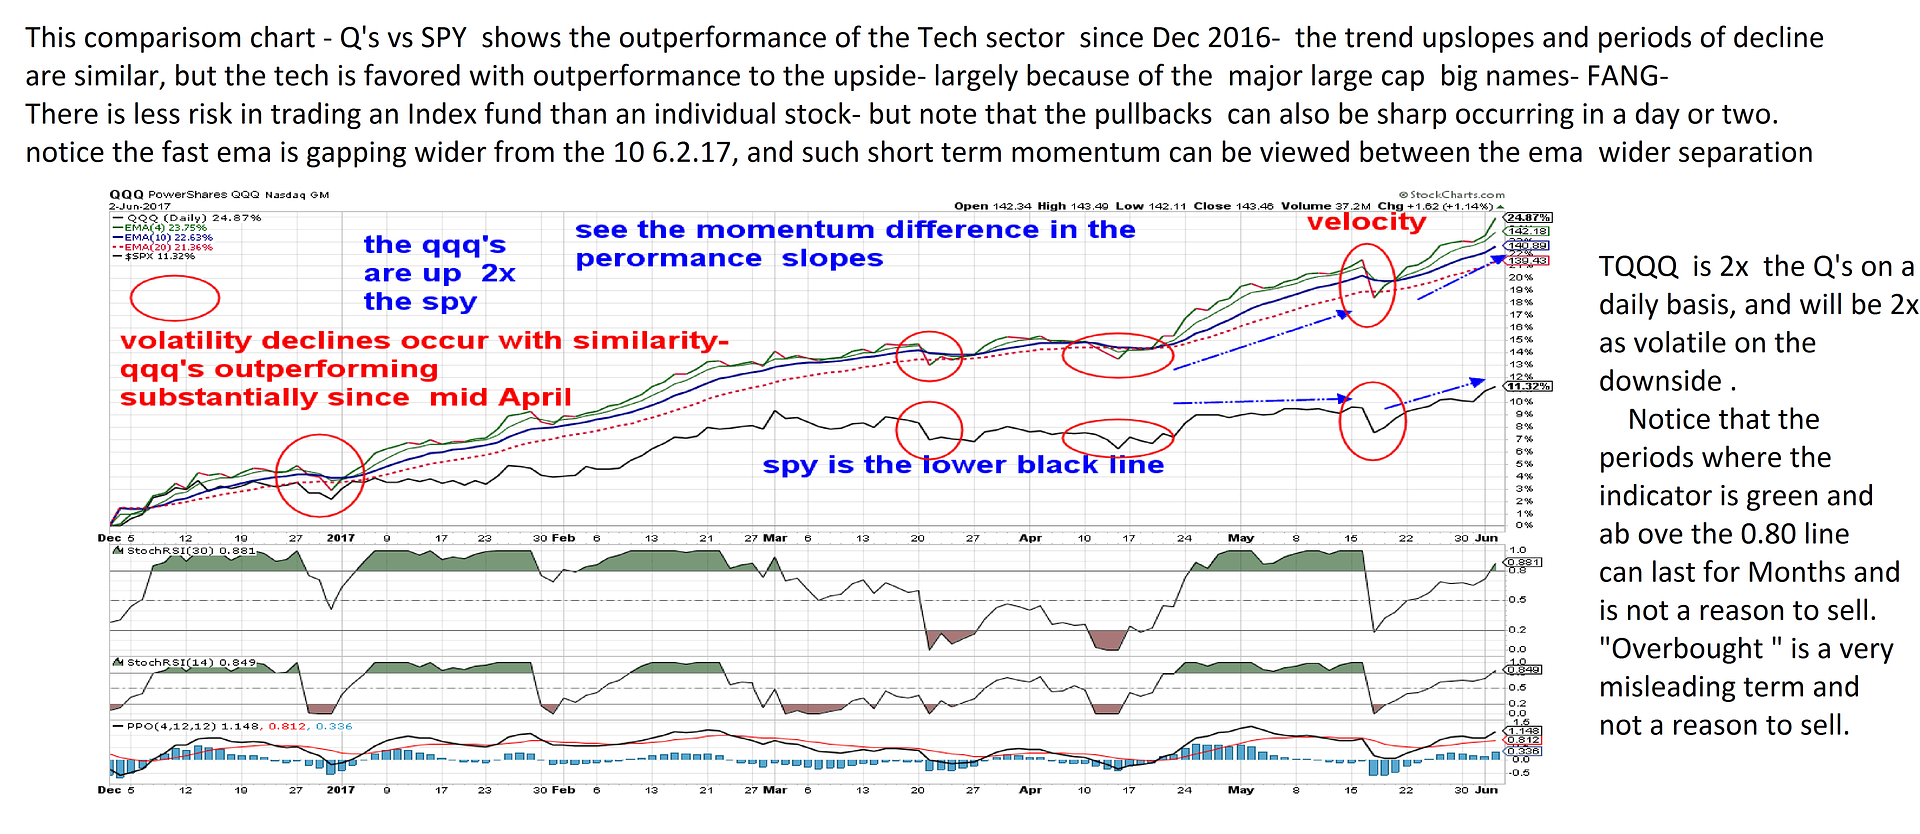
and a willingness to reenter if stopped out and price resumes the uptrend. That is my mindset in Holding TQQQ- while it is a 2x leverage of the Tech sector, Tech is outperforming SPY-
A comparisom chart of QQQ's vs SPY - The tech large cap index has really driven the outperformance-
www.cnbc.com/2017/06/02/the-nasdaq-100-is-on-pace-to-do-something-it-hasnt-since-the-tech-bubble.html
 |
|
|
|
Post by sd on Jun 4, 2017 9:22:35 GMT -5
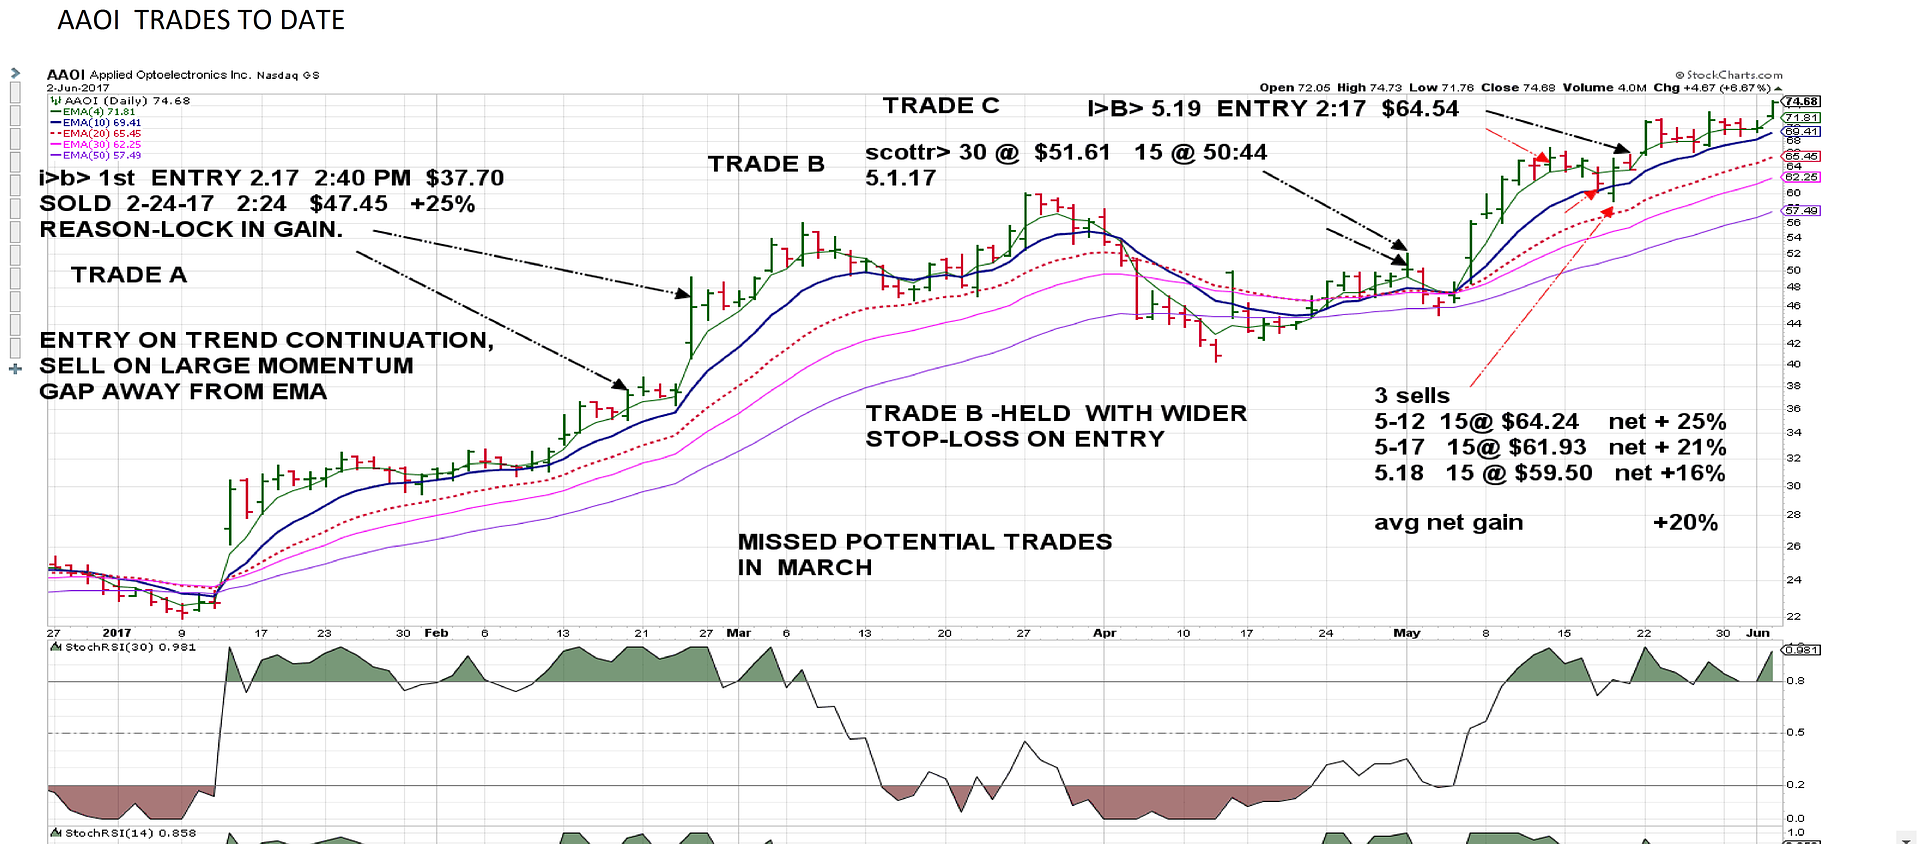
recap of past trades this year in AAOI- 1st trade was a small spec entry, 2nd trade took a larger position and held through the 2 day decline after the entry with a wide stop-,
tried to experiment with partial sells- designed to keep a portion of the trade available to continue for the longer trend- In this example, price penetrated below all 3 stops-
The wider stop was lucky in this example- had price gone lower, it would have been a substantial % loss. I think i held a mental stop in Trade B, wanting to see how price closed each day, and would have really risked much more than I normally would- Just fortunate that the trend continued when it did. The issue with stocks that have greater volatility swings is that it's not the same trade that one can just hold a tight stop -
While these trades were net successful, and the present position looks to be well into the money with the Friday move higher- I held with some patience- I will likely split this present position into 2 stops-
Printing out the chart to study -and evaluate entries and exits-
With the market moving higher, tide floating all boats etc, wind is right - until it changes-
That means that even though one may think a trade has gone too far, too fast, momentum works until it fails- until buyers fail to keep price supported by buying more-
There are opportunities to enter a momentum trade- that are closer to a Point of Failure- that improves the Risk/Reward ratio- as price comes back to the trend line, perhaps that normal pullback to the fast ema.... all are places I need to consider in the future-
Several of these trades were made on Fridays when I had time to view the markets- some were not "ideal" - but I don't have time to view the markets daily-
Also I have better confidence in Trading With The Trend- and With the markets direction-
The aggressive approach also requires a willingness to reenter on the trend resumption if stopped out.
|
|
|
|
Post by sd on Jun 4, 2017 21:27:36 GMT -5
i HAD ANNOTATED trades in TQQQ- I have taken this year- Stockcharts didn't cooperate with including the annotations-so no chart at this post-
I had taken 2 earlier trades this year in TQQQ in the IB account- my venture into leveraged territory.
the 1st trade was mar 1 and held until 5-04 - Why I exited then I cannot explain- particularly after holding during the sideways consolidation after the initial entry-
I apparently had sellers remorse and entered the following day, and held with gradually raised stops as price trended higher- Those stops got taken out on the high end off a price decline- 5.17 $99.90 -proved to be a prudent choice-
i switched over to the Scottrade account- and took a larger position in TQQQ 69 @ $99.68 and have an 11% gain- but the price action Friday - a large momentum up move- is typically followed by a pull back to the trend ema- This position size allows me to divide the stops- and I will sell 29 shares at the market open Monday- Hope to see a gap or up open that i am selling into. the remaining stops will be 20 at the 10 and the 20 ema for the time being- All are in profitable territory.
The goal is to realize when momentum is high to take some off, and apply the gains on what could be a rubber band pullback to the ema.
TQQQ is trending strong, and outperforming SPY- The decision to sell a portion is to lock in a decent gain - should be +10% - while allowing the remaining shares to ideally capture higher trend gains .....
Monday Edit update- sold 29 shares at the open- order filled 111.05 for an 11%+ gain.
At Midday, markets relatively flat.
|
|
|
|
Post by sd on Jun 7, 2017 19:57:35 GMT -5
6.7 markets flat, slight pullbacks this week- Positions are not making forward ground- basing at best-tenative is the appropriate word; waiting on the Comey testimony tomorrow is one market pundit's rationale-
- Tough when you open up the trading platform and see red in the column that compares today's prices and profits with yesterday though- That means the potential profits are dwindling.
it makes one want to naturally react defensively- protect those gains- but this year i gradually moved to a more systematic approach and intentionally somewhat less discretionary.
The best influence is the coincidental timing .... i have employed this approach -and stayed the course- and the market has obliged by not getting volatile and essentially trending and making new highs- even through May...... often referred to as the "Go Away Month". The approach -not reacting to minor moves- and allowing the trend to pause, and then resume- has the reward of reaching higher gains- and locking in profits on downturns- and also locking in smaller losses on declines.
I've also experimented with position size- and -lucky I think- in taking some larger positions when the market was also trending well- TQQQ is still a large position-with my partial sell and todays close within .04 - I'm looking or this base to breakdown-or break higher- the move appeared extended a bit, so i expected a bit o a pullback... May have to buy it higher if it breaks up...
|
|
|
|
Post by sd on Jun 8, 2017 8:59:23 GMT -5
6.8 Quick note- markets opened and BABA popped up from 125 to open at 142.... nice move exceeds 10%$ will see how much of the move it can hold onto, how much will be taken off by profit takers by the EOD... I doubt that it would be able to close higher. I just sold 10 $139.95 leaving the remaining 15 shares -
|
|
|
|
Post by sd on Jun 8, 2017 20:51:49 GMT -5
Regarding the BABA- trade...
And the price chart.
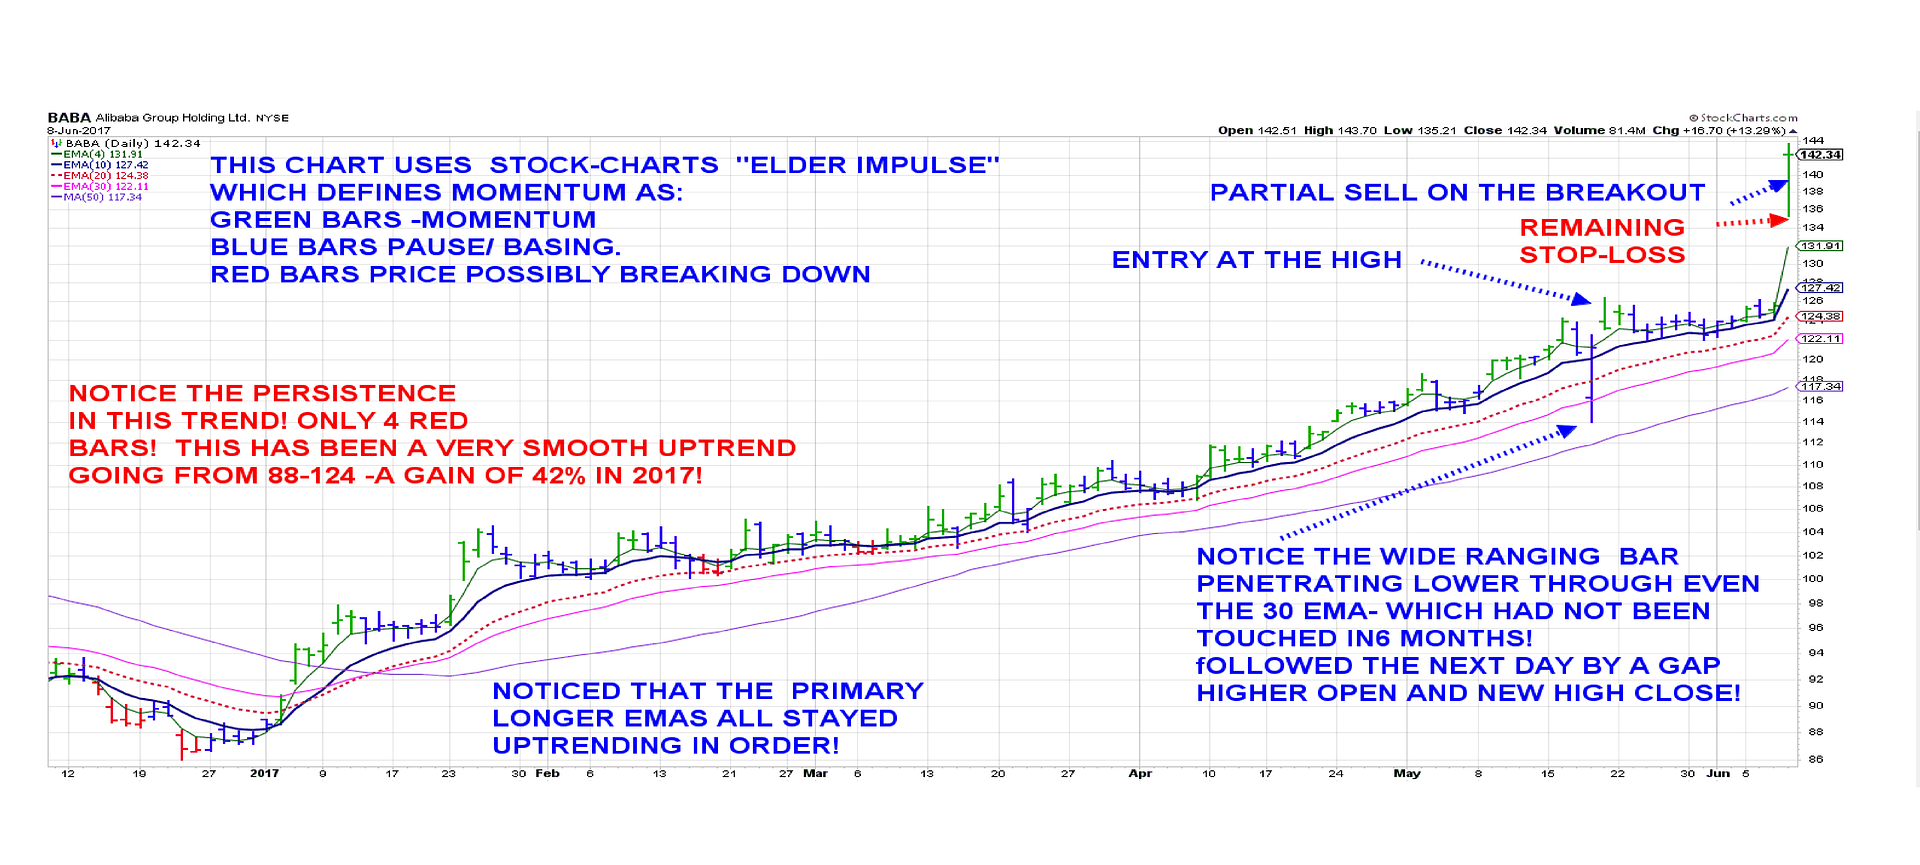
i entered Baba last week as it made a new high- I hadn't followed it at all, but when i looked at the chart-I couldn't help but notice the very persistent and relatively smooth uptrend-
Except for the major sell bar the day earlier and the strong higher recovery the following day where i purchased near the high of the day-
Looking back over this chart- Price action has been very smooth- major emas- 10,20,30,50 all have stayed uptrending- You have to expect that if you use such a fast ema as the 4 or 5 ,
it will accent the price fluctuations-
I have noticed that wide price declines that reverse quickly can lead into larger moves- That appears to have set the stage for someone accumulating a larger block of shares- taking out the stops and picking up shares on the cheap? This also seems to occur in sideways bases on occasion- and is worth noticing-
This chart Is different. It incorporates multiple ema's , but the price bars are color coded to show the directional momentum strength based on a MACD formula- (Moving Average Convergence Divergence) a very common and long utilized indicator- The histogram is more functional than the 12.26.9 line crosses-
Green bars are up momentum, blue bars represent slowing, consolidation, and red bars represent price weakening. Notice that in all of 2017, there were only 4 days having red bars, and they occurred in 2- 2 day periods.
So, This chart is interesting in that price has gained over 40% this year in a very smooth trend- with 2 possible sell warnings- (red bars) and the moving average approach has been closely parallel- so one would have had to recognize the narrow parallel emas and perhaps selected a slower ema to react to....
I haven't tried this chart style out across many other trades - and more volatile trades- but it certainly performs well here- Consider if one waited to set a tighter stop only after a red bar closes below the 10 or 20 ema? and then set the stop under the low point of that bar? or at a bit below?
Something for a future look see - i would likely add a faster RSI-5 to consider a reversal bar closing higher and taking the entry - This would be worth backtesting on reversion trades and reentry opportunities closer to the Point of Failure-
In the interim-
My net positive results this year have reinforced - Trade With the Trend- don't allow my negative and suspicious and fearful bias to cause me to jump onto small downtrending reaction trades that fade away lower after a day or two ..or three- Their time will come eventually-someday-
Take partial profits on wide moves- selling a partial position on a momentum peak move is prudent- but don't just sell it all- Raise the remaining position stops to retain some profits, well above entry- but allow the trade some room to pullback and consolidate (normal) and then move higher- It's nice to have a prior up move to determine where to set that point of the stop- iF IN DOUBT- perhaps check out Finviz and look at the ATR and choose a 2.5 or 3 x ATR below the price swing low- or drop onto a moving average- 20 ema
Keep the stops reasonably far away- Don't be so close intraday volatility hits your stop and then closes higher and resumes the trend-
understand that there are no absolutes- EMA approach works well when price is trending- as that trend loses momentum, and over time- the emas converge and can criss cross - If this is a sideways base- the longer 50 or 100 ema defines the trend- If emas start dropping lower and declining, I should be stopped out- The Fast ema by itself pulling back does not mean a downtrend is in effect- but if the fast, the 10, then 20 are inverting- price is well below and lower- position should have been executed and stopped out
All of this is a positive reinforcement to my way of approaching the market- as it is cooperating with me at this time-
This will not last forever- At some point, volatility and market indecision will be the order of the day and my positions will be chopped and stopped- I will take a loss that week as multiple positions will stop-out . Good time to sit on my hands and see what unfolds- Maybe jump onto the safety ETF's???
Anyways- take a few moments to consider the BABA chart- seeking to allow price some volatility to be able to stay in the larger trend- Would you or i have been able to not react before the red bars appeared? And would we have been able to reenter as soon as the following green bar closed higher?
This is a basic trend following approach -using momentum bars and multiple ema's - that appears to have "promise" that requires some rules and guidelines when applied to not so docile volatile stocks....
 |
|
|
|
Post by sd on Jun 9, 2017 14:08:45 GMT -5
6.9.17 Note-
This quote is from yesterday "All of this is a positive reinforcement to my way of approaching the market- as it is cooperating with me at this time-
This will not last forever- At some point, volatility and market indecision will be the order of the day and my positions will be chopped and stopped- I will take a loss that week as multiple positions will stop-out . Good time to sit on my hands and see what unfolds- Maybe jump onto the safety ETF's???"
Today appears to be that day- Didn't see that coming- except for the odd allocation into XLU for the prior weeks- curious why it is not benefiting today from the sell-off- But BRKB is benefitting. I don't think I took any actual losses- just reduced profits
The large tech sector showed broad market weakness. I had several of my positions stop out early this am- starting with the split trailing stops, and as selling continued, several more sold, and I then tightened the remaining stops - including BABA- as it appeared to be a Tech Sector Wide sell-off. While i felt the stops were adequately wide while price was still in Trend, the realization that a wider sell-off was underway caused me to tighten all remaining stops - and i chose to simply SELL the remaining BABA to lock in larger gains rather than allow price to slip lower in today's sell-off.
The analogy I use is that while a rising tide floats all boats, an outgoing tide will take them out to sea..... unless extremely well anchored.
This could just be a one or two day event, but it is being ballyhooed as a major tech sell-off - over 90% of the sector is lower-on 3x volume - and perhaps this is much more than a shallow rotation....
Price and valuation have been talked about for a long time as being at the high end- so this may be the start of profit taking and a valuation reset-
Summer is traditionally slower- and it will be interesting to see how sector rotation occurs, what themes will take over, where the money will go for growth and where it will be parked.
I am presently holding only one position OEUH in an account to have a diversified exposure-to Europe-
Will recap some trades as time allows.
3 pm Edit- Goldman suggested tech overvaluation and prolonged extended run caused complacency and overpricing..
seekingalpha.com/article/4080394-goldmans-big-fang-call-mispriced-factormageddon-looms?li_source=LI&li_medium=liftigniter-widget
|
|
|
|
Post by sd on Jun 10, 2017 9:27:55 GMT -5
THE BABA CHART- I took partial profits on the gap higher day, intended to hold with 2 stops the following day- hoped to see some additional upside momentum-
while price opened higher- the tech sector sell off occurred and i ended up selling on raised stops both smaller positions at the end of the day as it appeared the TIDE was going out for Tech. my expectation is that this was prudent , that price will revert back towards the prior trend line - note that this gives exposure to China and is similar to the AMZN-
not to be considered blindly , as it does not have the same financial scrutiny as AMZN - Or so I heard- Foreign exposure may be a better alternative to a highly priced US market with better growth opportunities? possibly so- A whole world out there- priced less expensively.

|
|


