|
|
Post by sd on Jan 29, 2017 11:20:00 GMT -5
Of the 4 trades -EXAS and EW are both health care related- and likely have been affected by the potential negative sentiment for that sector and the possible political actions against the companies.... EXAS was mentioned in a Motley Fool write up as a potential winner- with it's alternative testing vs traditional colonoscopies .
EW medical device mfg-
MU chip stock,
NFLX was an add to a position I took last week.
Chart will be a faster 2 hour chart
EXAS recently broke from a decline with a sharp gap move higher. It now rests at a prior wide trading channel prior to breaking down lower. There's some room here - the question is., with this recent break out and pullback barely testing the gap- will this move higher result in more upside? 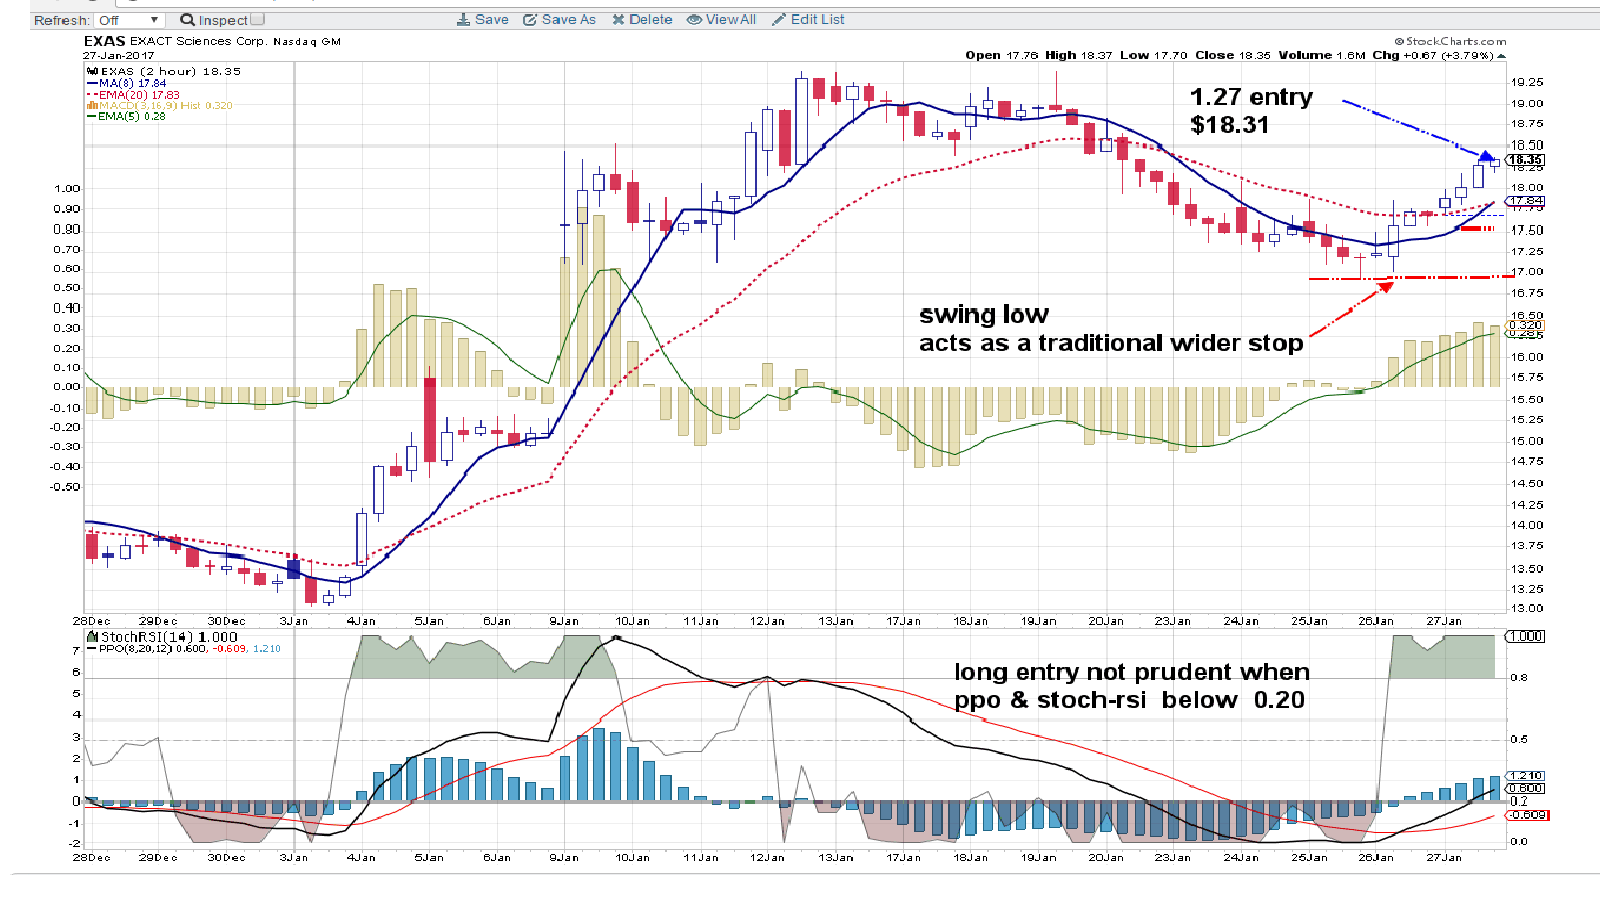 The Daily chart 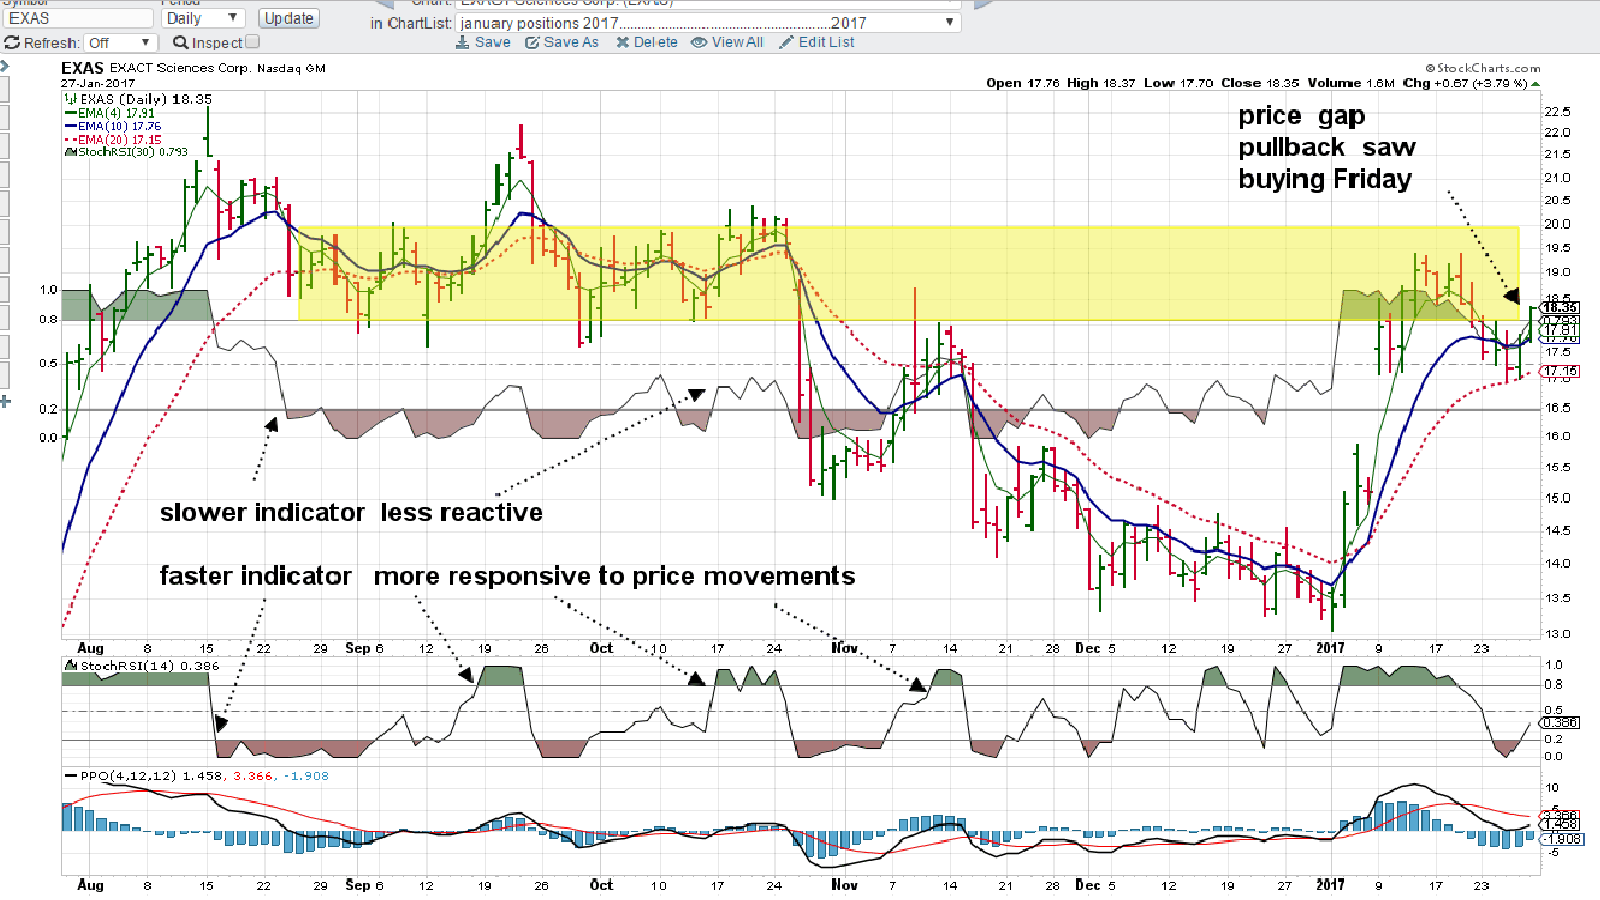 THE PRICE INVISIBLE CHART just to look at indicators as complementary to price action. even though you cannot see the price bars or candlesticks, the moving average lines identify when price is trending higher, lower- or sideways. Indicators follow price action- with faster indicator settings more responsive to smaller price fluctuations. For nimble short term trading- a faster indicator - for a less reactive approach, a slower indicator- Note the differences in the 2 stoch-RSI settings- the slower not reacting as quickly to attempts with counter trend price movements. Price leads- indicators can confirm- but I try to identify and trade With the trend-------counter trend trades need to be tactical-quicker- 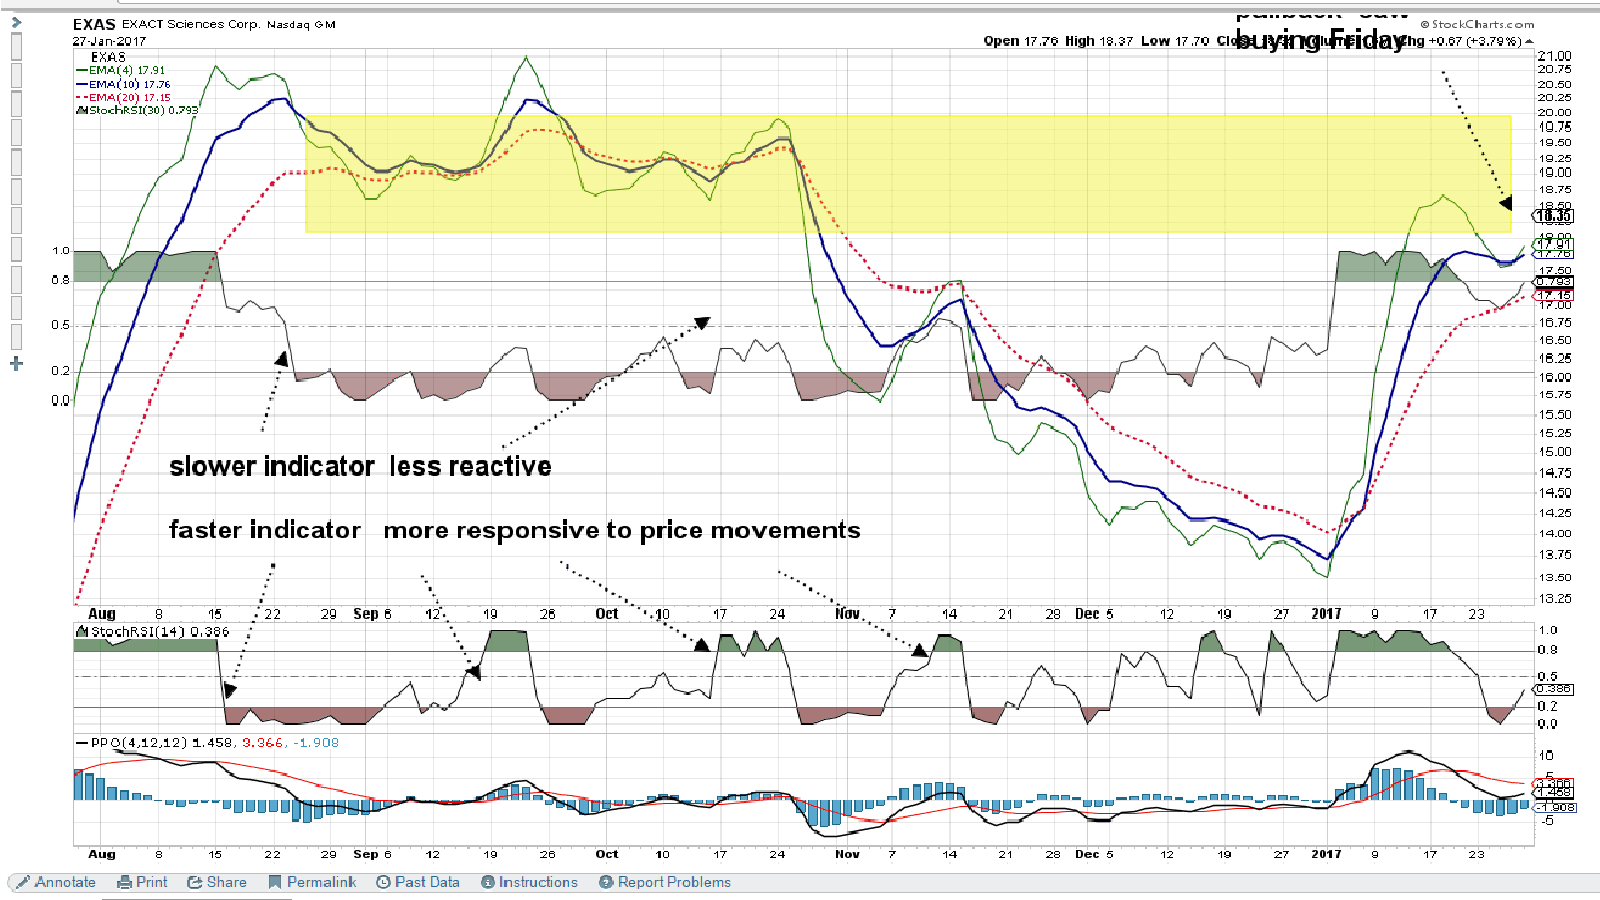 |
|
|
|
Post by sd on Jan 29, 2017 12:18:54 GMT -5
COUNTER TREND RALLIES-
I have found that I do better taking With Trend trades. They often have "persistence" in the present trend direction-is the word some use to describe this type of momentum probability...
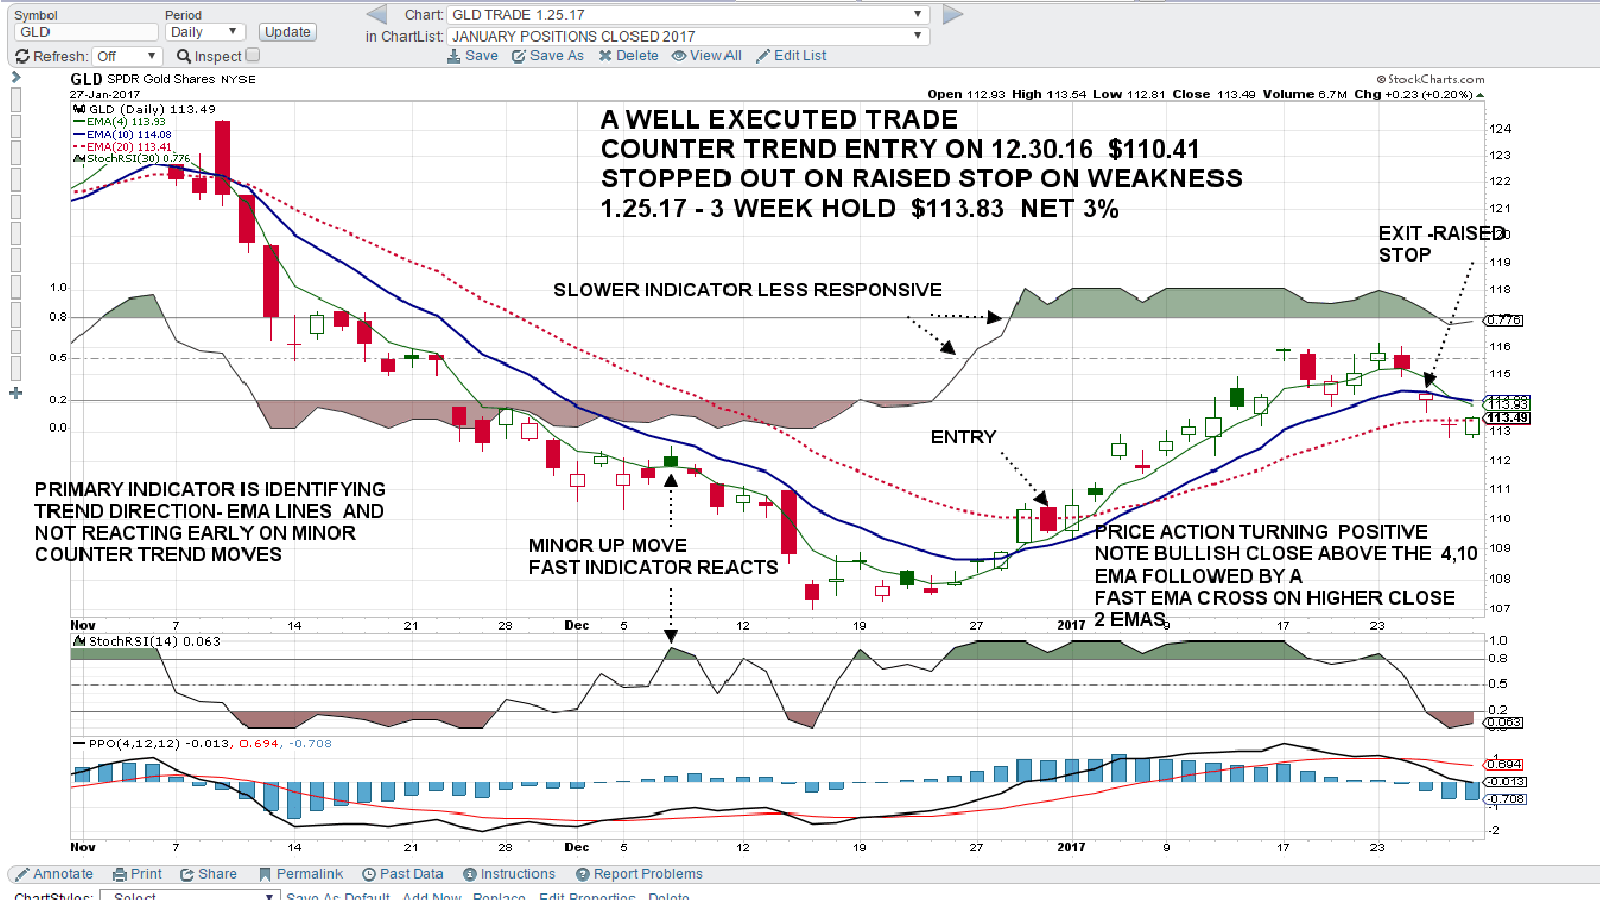
I took a Counter Trend trade in GLD that worked out . I have learned to consider these more speculative, and I usually will reduce my entry size .
GLD had been exhibiting weakness and trending lower- note the relatively uniform slope of the declining ema's.
I took the trade primarily because it had exhibited signs of turning higher-. signified by bullish price action closing not only higher and above the fast 4 ema, but also the trailing 10 ema- I saw the bullish close that actually brought the 4 ema higher and crossing the 10- put my entry to buy in and was filled on the following day
A comment again on trusting indicators- even during the decline- minor attempts to move higher would generate bullish signals on the indicator- The indicator does not qualify how it reacts based on trend direction- it is just comparing changes in what it is based on.
a fast indicator would be seen turning "bullish" and the trader may fault the indicator- for their losing trade- Not the indicator's fault- it is the interpretation by the trader of following the indicator as some sort of precise confirmation- Have to always look 1st and last at price action and where it is relative to the trend-
Going back to the basics..... this trade worked out based primarily on waiting a bit until price was indeed bullish- Note that there was not a lot of wide volatility between the fast emas and the other emas- things were orderly and parallel.
Price action obliged, by not making a single closing bar under the fast ema-but on 1-24, it closed right at it. Price had been sideways after the gap up on 1-17 , and- the longer price trades sideways, the closer the emas will converge.
The indicators reflected the slowing momentum- but that was also obvious at realizing price was sideways- momentum was not trending.
Note that price did have some lower openings under the fast ema, and penetrations towards the lower 10 ema-but managed to close higher each time.
When that does occur, I will -on occasion- raise my stop to the 10 ema value under that day- One could choose any method of trailing a stop-loss-and any ema, sma etc depending on one's conviction in the trade, profitability in the position, and willngness to give back some profits hoping to allow the trend room to continue to run.... One could also split the stops- which I do on occasion.
EDit Note- took a small reentry at the close in GLD 1.30.17
 [ |
|
|
|
Post by sd on Jan 30, 2017 20:13:08 GMT -5
1.30.17 Markets sold off today, possibly as a reaction to Trump's action of banning people from 7 nations entry into the US.
Is the Trump rally over? Or just hit a pothole? I think it depends alot on earnings-
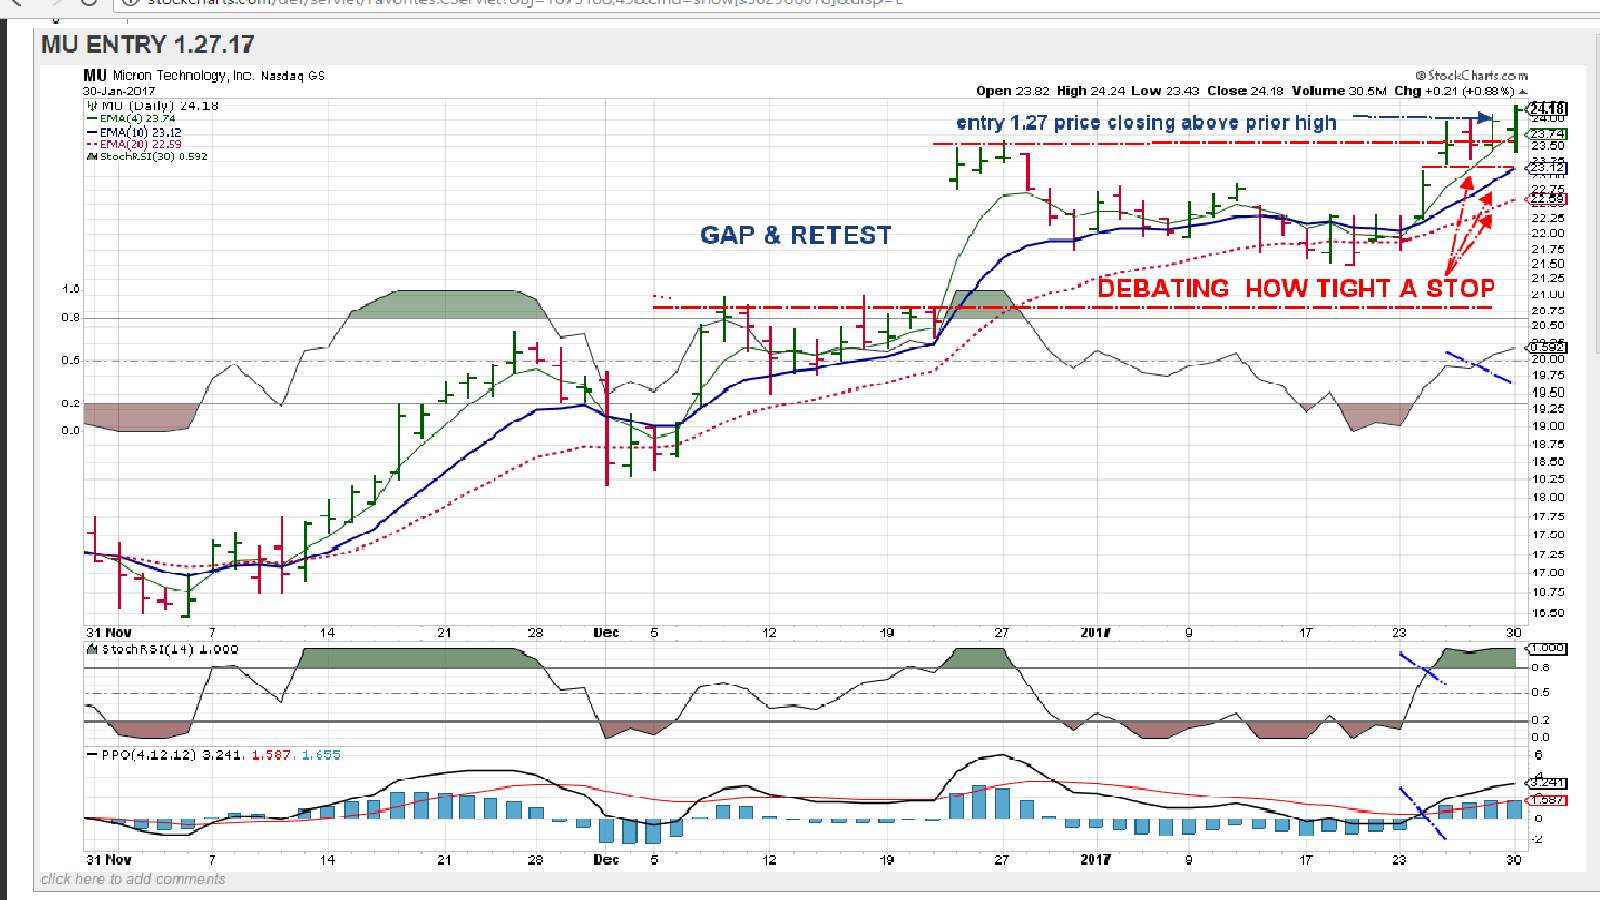
Everything i own was down with the exception of MU which I purchased Friday.
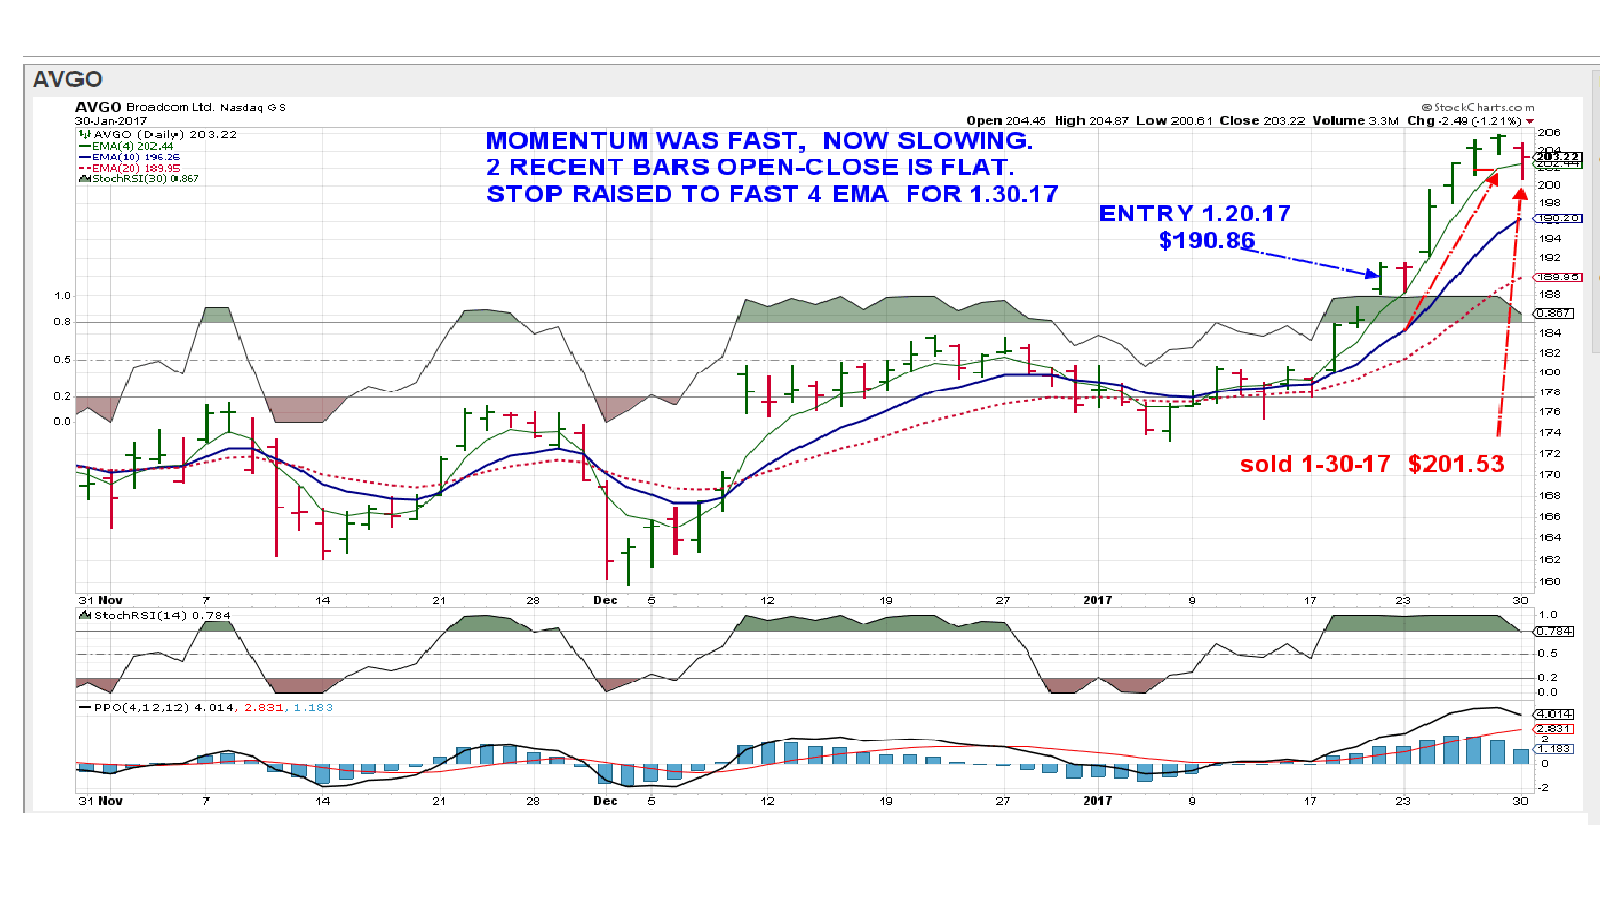
AVGO stopped out on a raised stop- The price action was muted Thursday & Friday, and as I was reviewing stops on positions, i decided to tighten the stop somewhat aggressively on AVGO- noticing that when price trends well, price stays above the fast ema generally, and in this case, I took the closing bar and used the fast ema value under that bar as my stop. This is aggressive and early- as i generally wait until a sign of weakness is exhibited by a lower closing price, generally closing under the fast ema, allowing price one strike and then it's out. In this case, AVGO weakened today and hit my stop-
As i have been going through some charts- some of the better trades i have made recognized a momentum peak- Price pulling Away from the fast ema -
Waiting for it to come back , and then close below the fast ema- allows the trade to potentially move higher, but leaves a lot on the table. Splitting the position with a tighter profit stop and a lagging trailing stop may be the approach in the future.
i also have a position in GOOG- AVG price 821 - and I elected to give this one some leeway- Stop is $795.00 and looks iffy that it won't take that out- I was hoping for a better earnings-- and there is a lot of indecision about the new accounting process- i will likely take a hit on GOOG this week.
  |
|
|
|
Post by sd on Jan 31, 2017 19:18:06 GMT -5
I was stopped out on GOOG in one position- stop activated at $795- filled $794.57-
I hold a second position- stop at $790- that was almost taken out today- likely will be tomorrow-
Loss of $27/822 or 3.28%. I failed to react on the drop lower close under the fast ema with a raised stop- because both of these positions were taken in accounts that I had expectations to be longer term holds- with wider stops- Since I held 2 positions, thus it is overweight portfolio wise- it would have been prudent to have responded more actively on one of those positions. I really had expectations that the recent range $800- $810 would have provided some better support. I had the opp after the earnings miss to exit close to my entry, but i thought the earnings "miss' would be interpreted more favorably- So much for optimism infecting my view of what the chart was telling me.
I also am holding AAPL into what turns out to be a bullish earnings- and planned to hold FB into earnings- Earnings are dicey- good earnings will be a gap higher open, and bad earnings a gap down....
I heard Trump met with some large pharma ceos- and the pharma and biotechs moved higher-Also heard Cramer warning tonight that the sector is still at Risk of government regulation- and gains should be sold into-
EXAS position popped higher-but EW failed to respond. I found that odd-somewhat disconcerting....and moved the wider stop on EXAS up to the 20 ema-
I was tempted to tighten more, but $17.40 gives it a bit of room under the lows of the prior 3 days.
TSLA , has given that close under the fast 4 ema I reference- and I already had a stop raised to $246 under the 20 ema.
Yesterday, it had a low of $247.10, today a higher low- $247.70 and a higher close- it is basing sideways in an uptrend-
I have held TSLA since 1.11.17 $229.24, so a stop out at $246 would yield about 7% gain.
I bought FB 1.6.17 123.71 - stopped out on weakness yesterday $129.95- Also stopped out on the wife's long term account- small gain- -5%-
I heard that there are 46 analysts with BUY ratings on FB- No holds, - WHY would this stock decline into earnings then? Certainly, the market has been weak for the past 3 days- but why did it not hold a tighter sideways base-
FB ran up to the 132 level last week, a prior resistance high, seen last Oct/Nov.
If FB disappoints, it could drop into the 121-115 recent trading range- and if it beats on earnings, it will have to make a new high- above 132.
A buy-stop at $134-lmt 135 might be appropriate on an earnings beat- looking at a weekly chart going back 1 year- Look at those large moves-
Viewing the Weekly chart and looking back 1 year- A large up move occurred on earnings- followed by profit taking the next week-
i just noticed that TSLA is testing the prior high made last April in the $255 range....
|
|
|
|
Post by sd on Feb 1, 2017 21:26:31 GMT -5
AAPL had a large gap up on Earnings- I won't be putting in a higher trailing stop-loss- I will be putting in a Market Sell-for Thursday 2.2.17 for 15 shares, with 10 shares remaining with a stop-loss at today's low. The sell order- Hoping to catch an opening move higher- above where it closed.and locks in a decent short term gain- makes up for my GOOG loss. The stop-loss smaller portion gives it a chance to move higher. I may then look for a pullback to reenter- The estimated target value is somewheres mid 130's .
I expect AAPL will quickly sell-off - and not run higher immediately- thus the more tactical trade to sell into strength. however, since i haven't calibrated my crystal ball, i have split the position- One portion sells at the open- and fingers crossed that's a second gap higher- and the other portion sits at the low- as a market stop-loss- If AAPL opens higher or lower, the one position becomes a market sell order- If it opens below 127, both orders will sell. If it opens higher, the market sell position gets executed, and the stop-loss position gets to be raised to the low of tomorrow-
Got in too late to catch any financial news- But EXAS looks poised at resistance- EW moved higher- PJP sector is higher- I tightened the stop on EXAS to a few bits below my entry. I'd rather lose $.15 than $1 if it doesn't have the stamina and buyers to push through higher.
EW has also moved up a bit, MU gapped very nicely higher today ,allowing me to raise my stop loss up to Break even and still give price room for some volatility. , GLD reentry had a nice 1 day gap higher to recent highs, and gave most of it back-today.
i'll raise my stop to below today's close to try to protect my 114.17 entry. 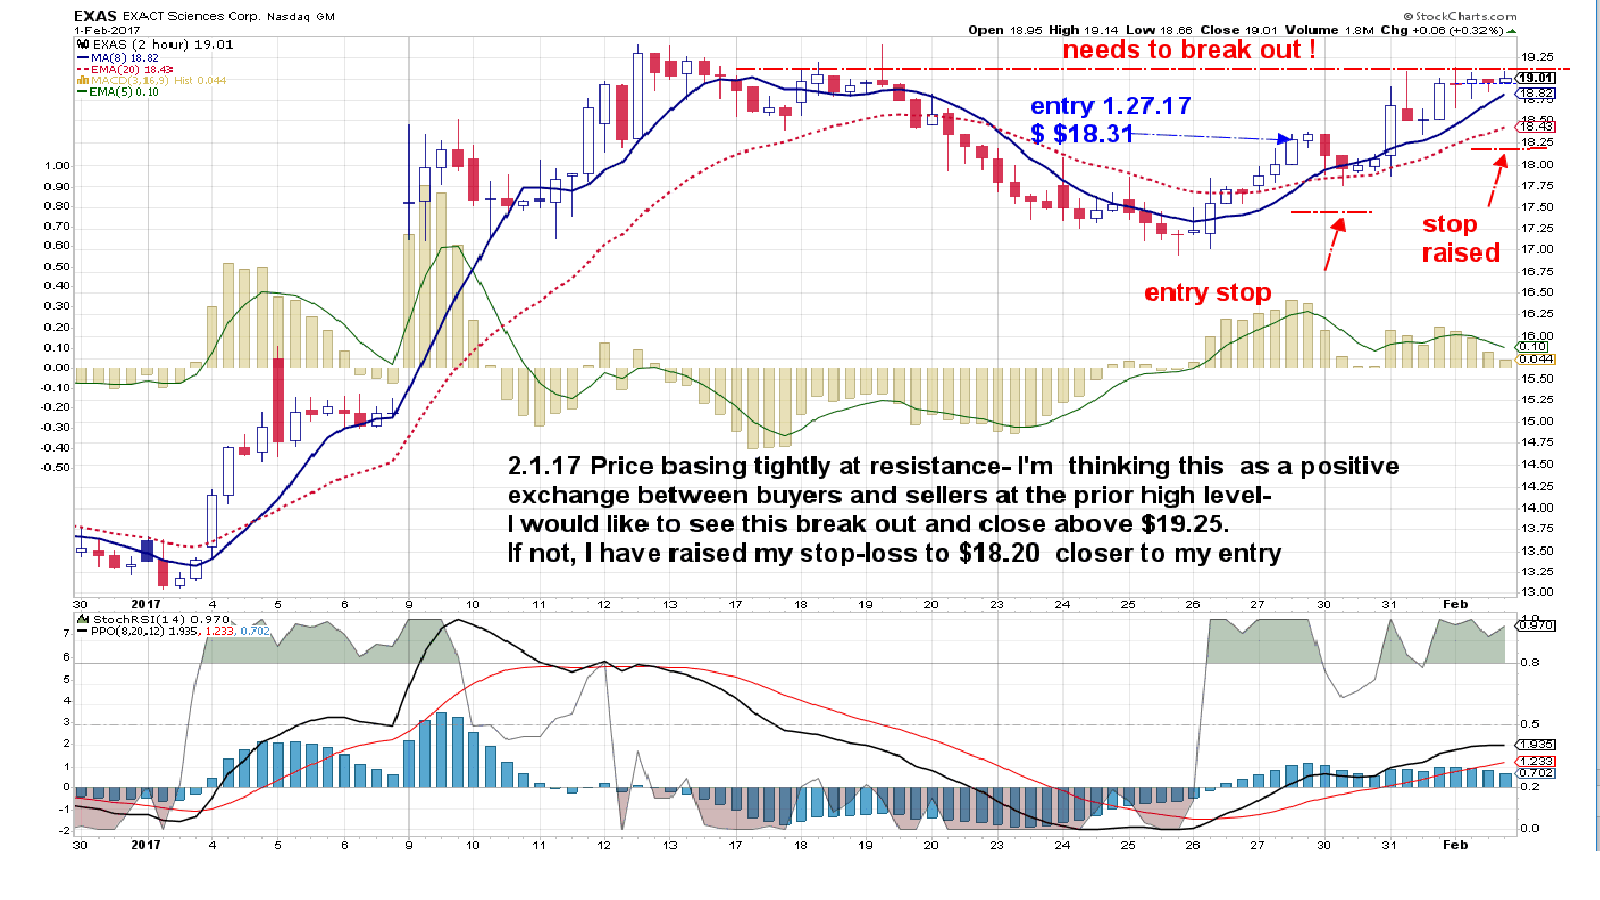 |
|
|
|
Post by sd on Feb 2, 2017 19:19:30 GMT -5
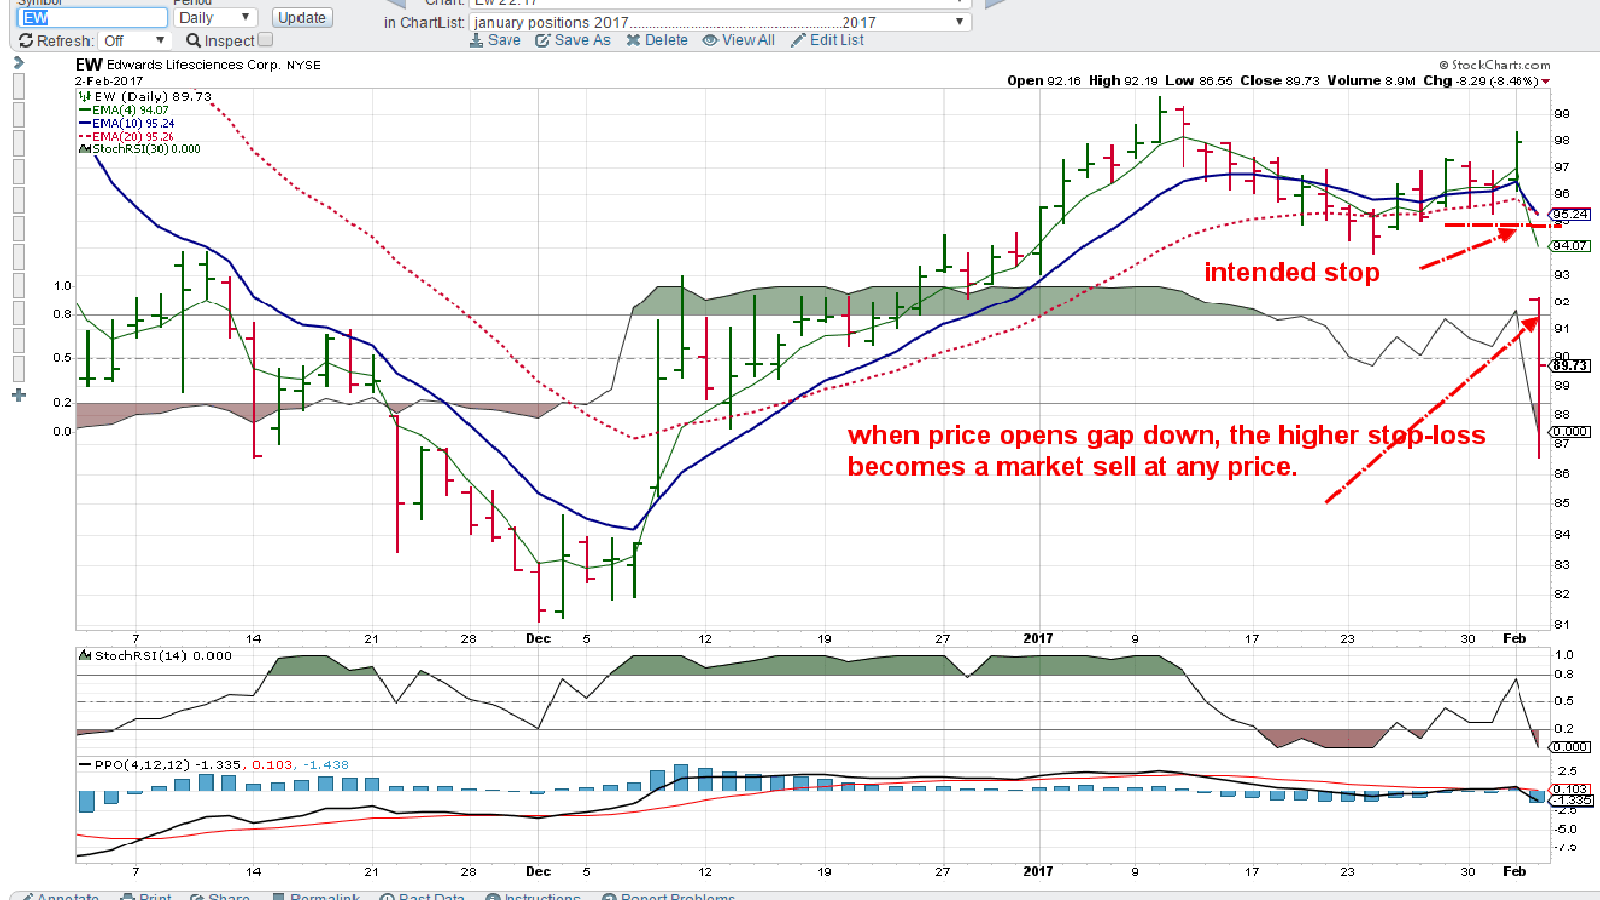
EXAS did push through resistance today- chart attached- Linked by sector- EW gapped down well below my stop-loss- and served me up a more substantial loss! I did sell 15 AAPL,on an inside day , so i did not get the benefit of a second move higher to sell into- Stop on the remaining 10 shares will remain at 127 -waiting to see if shares will stop out or move higher. FB- i had stopped out the other day, it had moved higher, but gave up today's higher opening, and sold off.-down $3.50 I think the sell-off after starting higher is indeed a warning- and i will follow it to see if i want to try another entry..... I think FB is one of those stocks that will evolve- and has a future for a few years....
Note- XBI may be the way to play the middle biotech- companies- Amgen had good earnings and is linked with a smaller company CYTK- but these medical companies- even EW- EXAS offer the higher Risk of single stock exposure.potential larger gains, but also that downside risk. 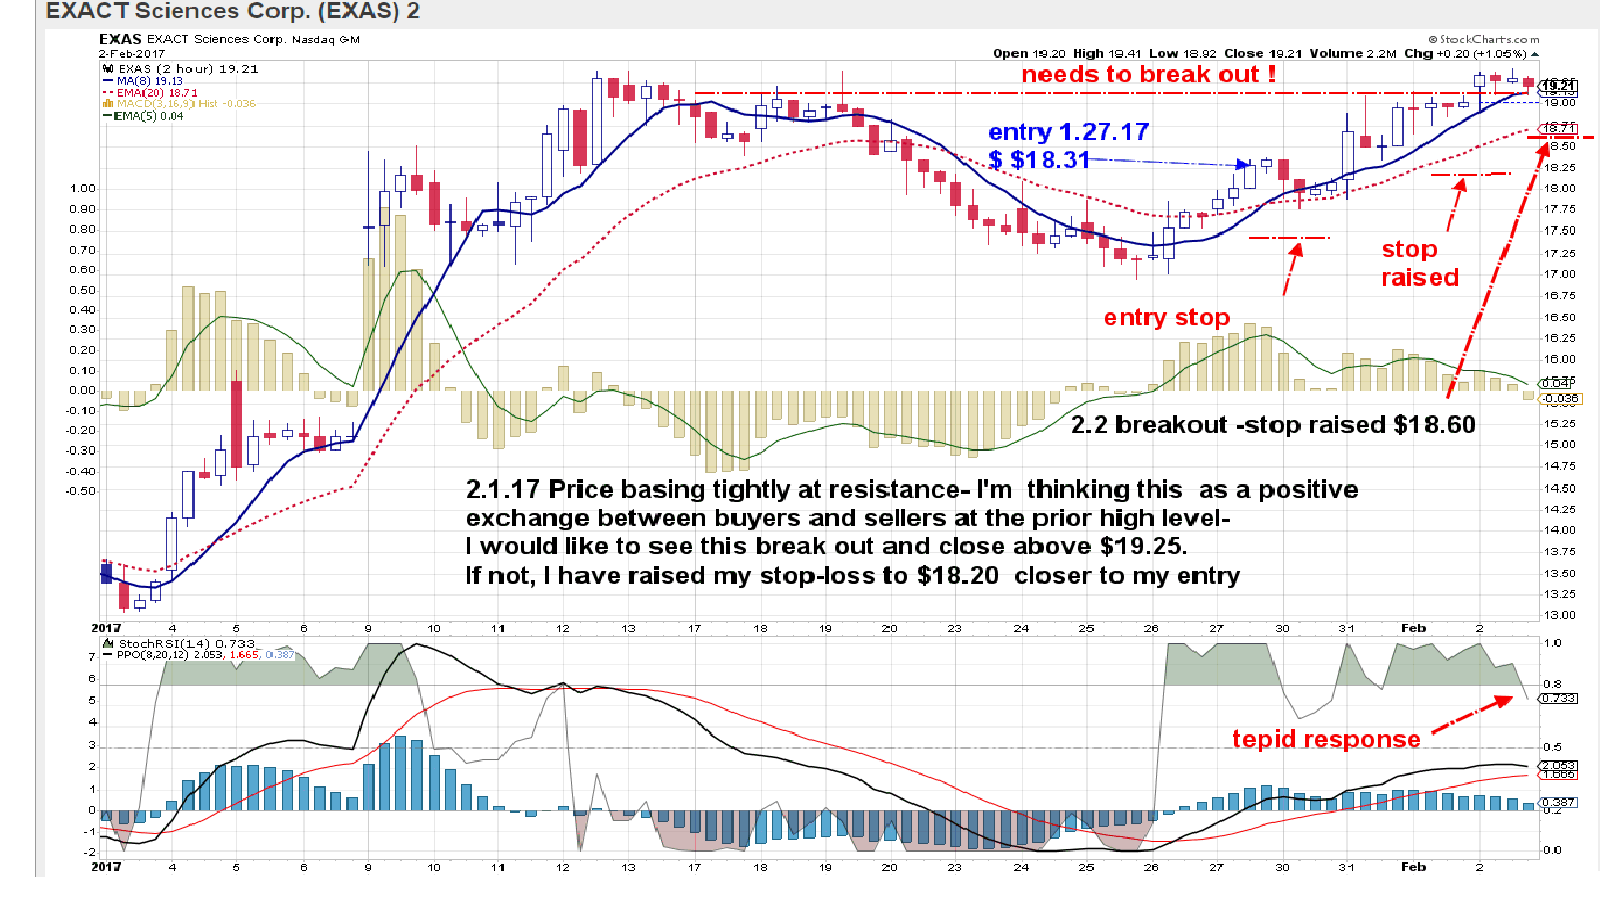 |
|
|
|
Post by sd on Feb 2, 2017 19:33:07 GMT -5
A losing trade-
After winning with EW earlier, i had confidence in taking this second long entry- - $97.14 -not noted on the chart .
I was quite surprised with the sharp decline gapping well under my stop-loss- i anticipate this may have occurred on a disappointment in earnings.
As with GOOG, this illustrates the potential reward- and Risk- of holding individual positions rather than the broader sector or Industry group ETF....
|
|
|
|
Post by sd on Feb 2, 2017 19:44:41 GMT -5
Worth noting- I have held TSLA since 1.6.17 $229.24 and i have adjusted stops higher- presently stop has been holding at $246- and TSLA is basing- a few dollars above my stop- It is not worth scrimping a few pennies to move the stop-higher- i'll be taking a buystop- XBI- $65.60- $66.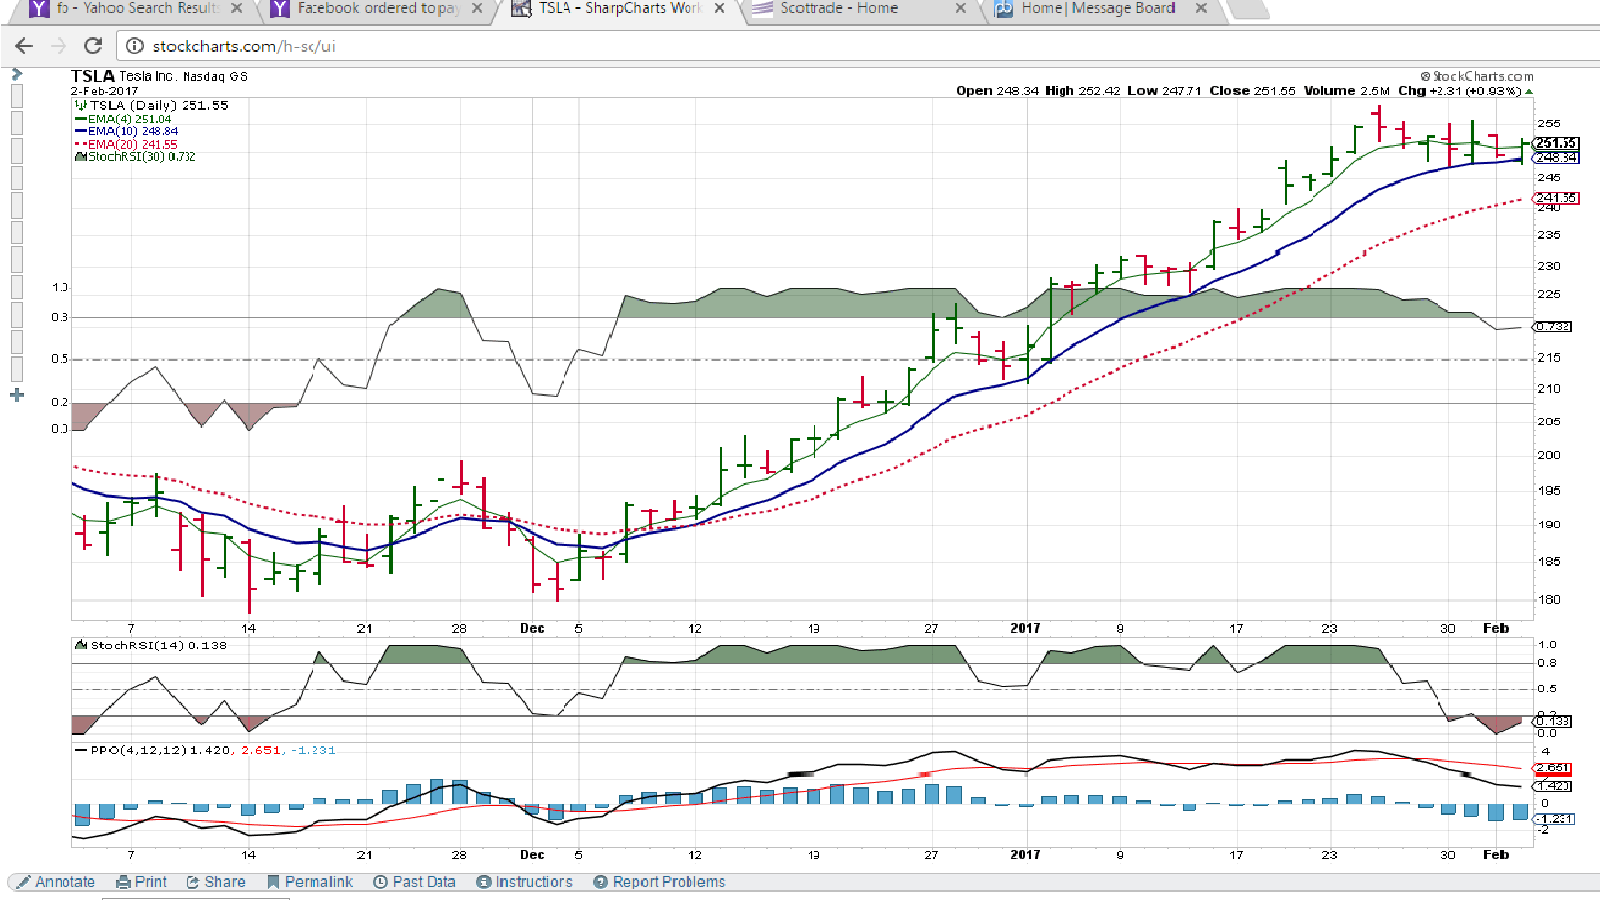
|
|
|
|
Post by sd on Feb 3, 2017 20:48:56 GMT -5
I made a few entries today-Since Goog did not breach my $790 stop- i added back a couple of shares-as it moved higher after 2 days lower.
The basis for selecting $790 as a 2nd position stop was the prior price action range i hoped would act as nominal support-
I bought some msft today, as it had moved higher from a week long base, hit a new high, and pulled back- so now it's closed just above the base from where it "broke-out'. Today, it moved a bit higher on a 1st rally - but it is above the slightly lower prior base. It is something of a 'test' to see that the $62 prior range low will hold-. MSFT should likely belong in a long term portfolio type account. - as a stable investment- i think a stop at $61.75 should serve the purpose.....
i also bought a couple of speculative ETF's - ROBO, BOTZ- based on automation, robotics- Botz is just 6 mos old, and includes a focus on artificial intelligence-
Certainly sounds like this is the direction we are going, and technology will be the driver- Is this 2,000 reincarnate?
It's hard to put this in perspective, because we are living in this moment- and cannot necessarily see the forest because of the trees...
But technology drives us and brings about change and eventually transformation. As a society, we have grown accustomed to what technology brings- and it is expected that the next best something is just a new release away-
Back in 1990, i met a guy that had a phone he carried in a bag with a large battery attached.
I bought my 1st computer in 1991- it was a 386 sx and had more computing power than the 1st space mission to the moon- or so i was told.
With the advent of the internet linking anyone with access to an internet provider- have You got Mail? _Yes, i was an AOL subscriber back in the day....Here we are today.... talking about the "new" Ipos- SNAP - losing millions of dollars each year- and think TWTR- as we are in this social evolution - FB appears dominant- Bbbbbut there's always something "New" that challenges and may overcome the present leaders-
One theme that is continuous though, is that Technology- causes disruption, change and evolution, while individual companies will transform, fail, be absorbed, or dominate- Change is the constant.
Technology brings on the advances in medicine,healthcare, defense, agriculture, computing, transportation- oil and gas exploration etc-
Even something as new and trendy today- as AI- artificial intelligence- which seems to be the leading edge- from Watson to autonomous driving cars...
Will eventually become the new normal ..... After all, we have refrigerators today that will tell you at the grocery store that you need to buy another gallon of milk- and that can be linked with the home security system - so you can be ever linked socially- and personally-
your investments can be properly allocated and periodically adjusted at a minimal low fee, and the "broker" taking his cut in fees goes the way of the blacksmith shoeing horses-No longer in demand....
purchasing a few shares of MSFT today puts this in perspective- once one of the technology leaders , it achieved size and dominance-back in 2,000 it traded near $40.00 and 17 years later achieved a 50% gain .
As Blygh mentioned- IBM - a market leader back in the day....
These Huge market leaders- failed to hold their dominance despite their size- They likely lost that competition because of their size and inability to adapt - like the Titanic, once on a course, too large to make a workable transition...
new technology replaces the old- In Prior decades, change occurred at a much slower pace, just ask Chrysler and GM and Ford and Lee iacocco when faced with bankruptcy to a more competitive import with better quality from the likes of honda and Toyota- Our industries here in the Us failed to adapt to the changes in technology/ workmanship, and - and were almost eliminated as viable companies.
just a mumble- but i think the greater risk is betting on an individual company over an extended period- Dominance today does not mean that company will dominate tomorrow- i think the less risky investment for those with a longer term view is to bet on the sector or industry group vs the individual company. JMHO
|
|
|
|
Post by sd on Feb 4, 2017 11:24:57 GMT -5
Took a few at work photos- but e-mailed them and tried to upload-mixed results...
On the technology theme- I don't work with this stuff, just helped to build the space, but it's neat to see what creativity and imagination and the surrounding skill sets- programming etc can accomplish...photos are from a lab space that also includes learning to program 3D printers -
As these newer technologies evolve- or newer business models- or newer social platforms, or medicines etc......it disrupts the once successful existing model, that has to continue to compete, or become obsolete- And this evolution occurs at a more rapid pace of acceleration-Look at how Uber disrupted the cab companies- Think of 10 years from today, most cars will be electric-and self-driving- The trucking industry will have a huge boost from self driving trucks,
      |
|
|
|
Post by sd on Feb 6, 2017 10:23:58 GMT -5
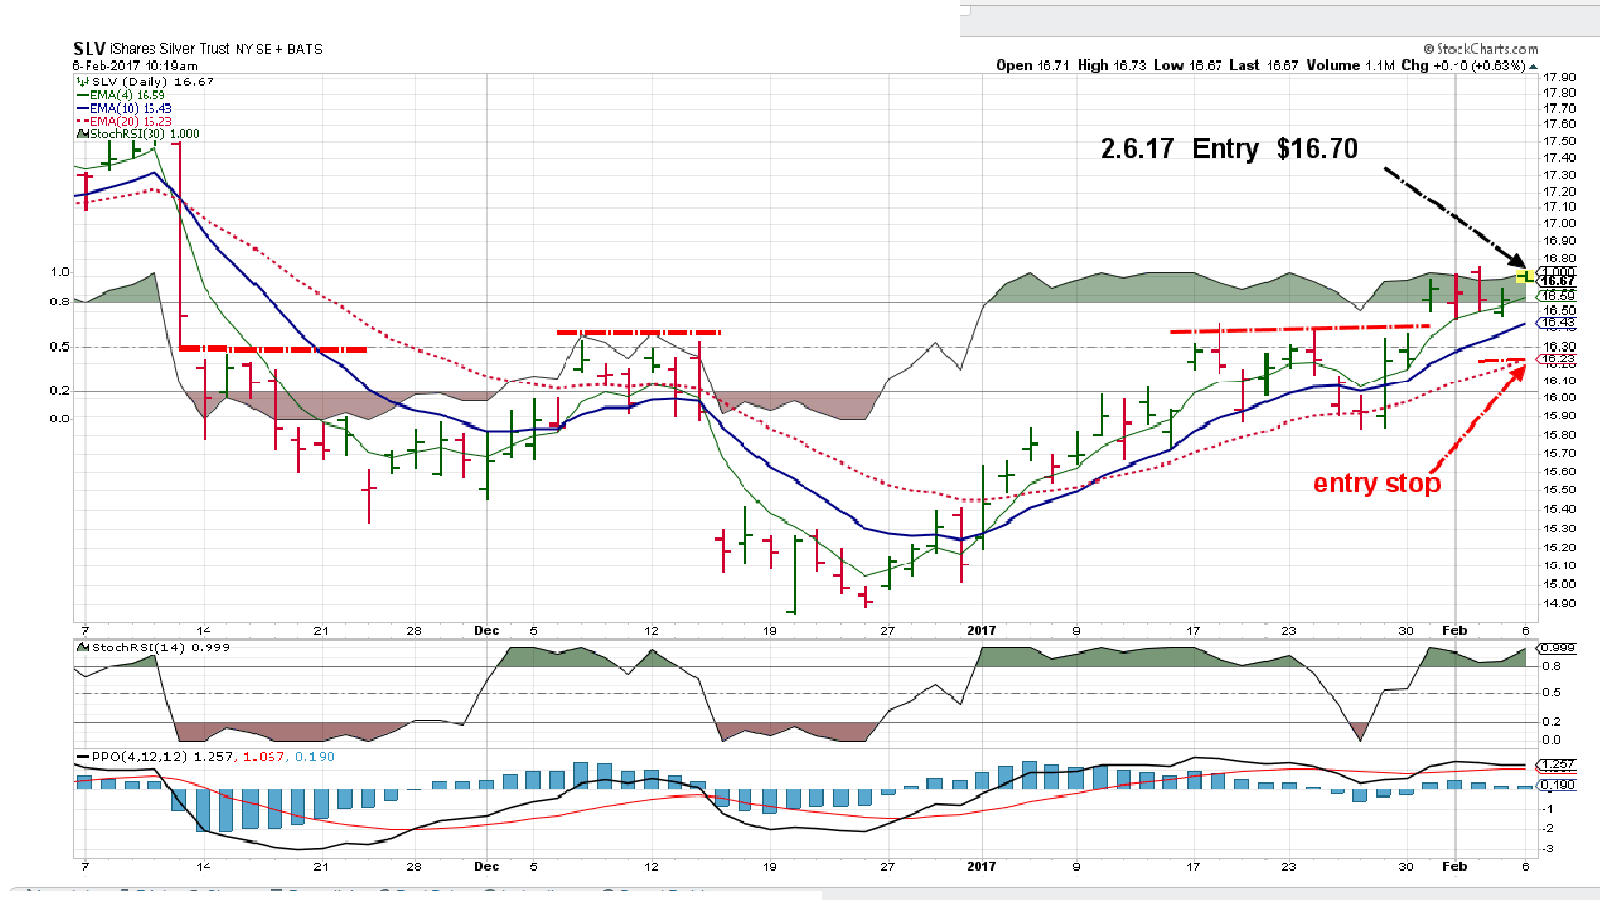
2.6.17 I have been holding a small GLD position, bought some SLV today $16.70-It's been trending higher, as has GLD..
|
|
|
|
Post by sd on Feb 6, 2017 21:00:49 GMT -5
I still have to print out ALL of the trades i have taken this past year- I've printed out only a few-charts- The goal is to print the chart well after the trade has passed- and see what the follow up price direction was- and was the exit warranted- or just a stop set too close to the price action that ultimately went higher without me?
i think it is important to recognize good trading behaviors vs poor trading behaviors-
"Good" would start with properly executing a plan- even if that plan may be flawed, and is eventually changed- only by being systematic can you analyze the results objectively. "Poor" trading behaviors might include just reacting to news or one's bias and not seeing confirmation in the charts.
Since becoming a more active participant on this site, I stepped up in my trading and i think trade with a greater restraint, not reacting to those impulse trades that tickle my bias as often- But i am long today both GLD, and SLV , but it is "justified" by the chart
My goal is to continue to refine my trading approach -and -ideally hold trades for a longer duration- as long as they do not violate the stop protocols. Or- to take profits on a move deemed excessively wide and likely unsustainable. If they are stopped out, or if i sell on momentum, my job is to reenter the trade on a resumption of positive price action.
I've done better by not taking counter trend moves- and jumping in early-One exception I entered GLD 12.30 -$110.41 and caught that move early on, I stopped out higher, on 1.25 $113.83 and have since reentered- That was a hold duration exceeding 3 weeks- perhaps that would be a good "example' of what i try to do by swing trading with a relatively close stop when weakness appears. Cut the trade on weakness, but try to allow a winner just enough room to run.
TSLA is another example- I bought TSLA 1.6.17 $229.24 and have held it now for 1 mos. It just Sat sideways-for the past week+ and i had trailed a stop-loss from the $240 on a higher move, and then I decided I would raise the stop as TSLA went sideways-On a positive bar that opened below the fast ema, but closed above, I 1st went to $248-as a stop- But i realized this could just be a sideways base forming- and i elected to back off the stop using the 10 ema under that bar and drew a line at $246. as my stop. Keep in mind that I am using a very fast 4 ema as my closest moving average for a reference- One could choose any ema to react to- I arbitrarily selected the 4 ema- but it could have been less reactive had i selected a 5, 8, 10, or 20 ema-
As price settles into a stop in upwards momentum, and starts to base , this allows price to come to equilibrium- between buyers and sellers-
This is a normal pause in the trend, , healthy, and is repeated- consider it the half time between quarters in the game, where buyers and sellers settle up- This is where the moving averages start to converge- This is also where Art and Science crisscross- and where Technical analysis is not well defined- price gets choppy- and the moving averages may converge and overlay one another given enough time.
Back to TSLA- It broke out of this recent week+ base and closed up $6- about 2.5% on a stock priced this high-
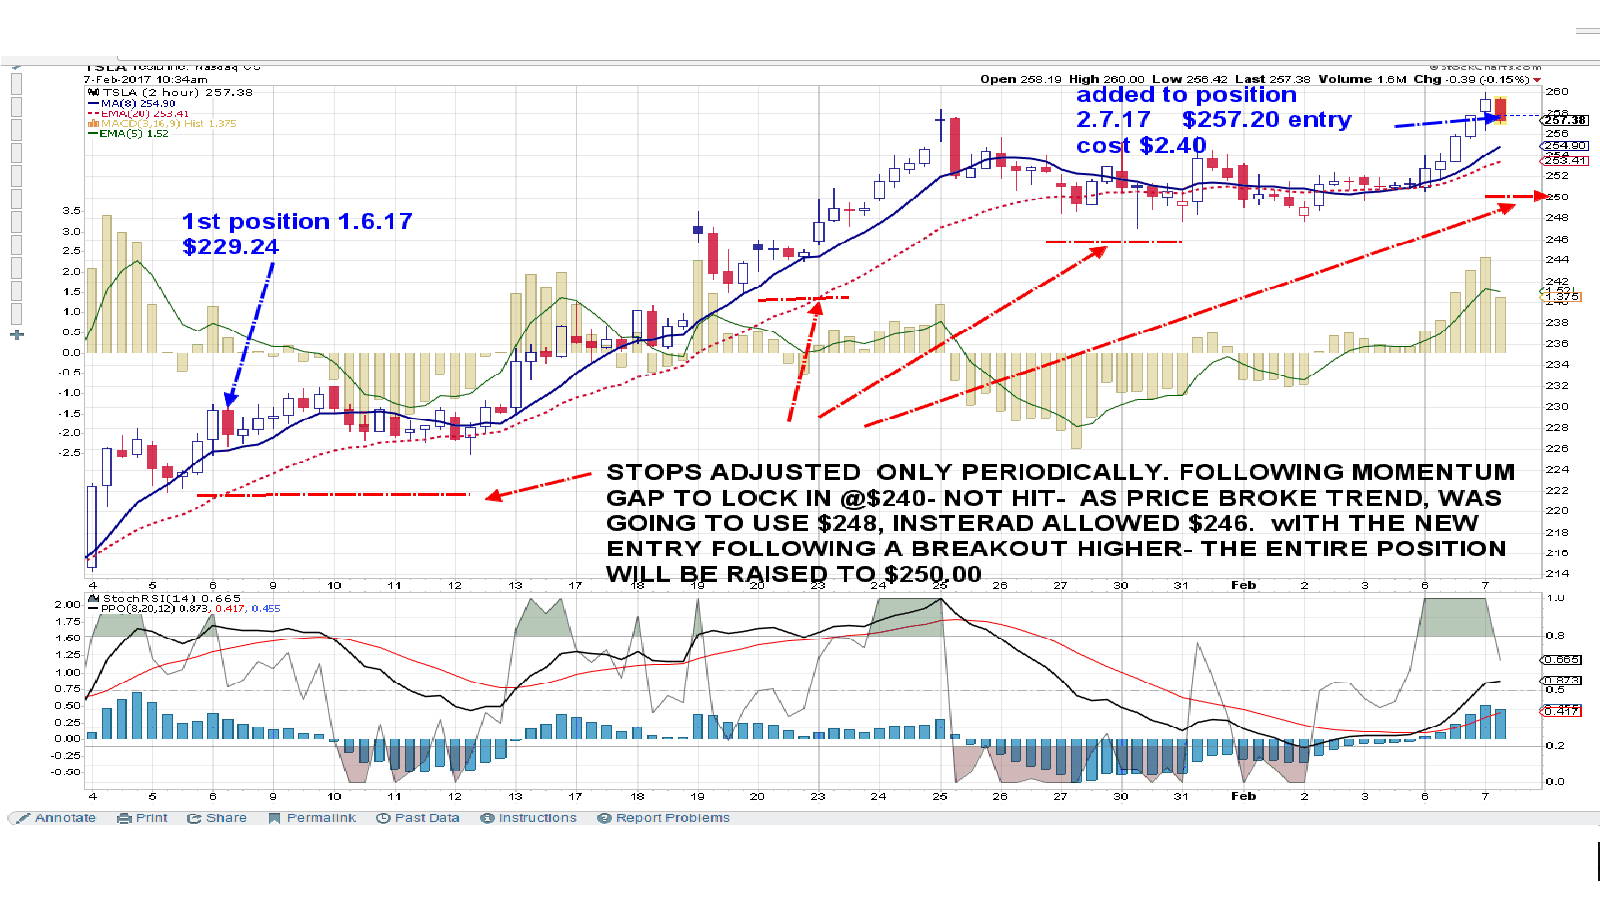
This move did not take out the prior recent high- perhaps matched it- there needs to be follow through- but this move is wide enough that I can tighten my stop-loss to $250.00 adding about 2% to the trade if stopped out. This defines the outline of my 'approach'-
You have to decide on a point off entry, an initial stop-loss- and then- if the trade progresses in a positive direction, allow that trade room to run. Taking too quick a profit may be taking too small a profit=-
At some point, the trade will break below the stop-loss- but i would have to be willing to realize-
That by setting a stop-loss- at any point- is where i am drawing a line in the sand- Should price exceed that line and the stop activated and a sell follows- that is trading- - i have limited my downside by using a stop-loss price. my position becomes a market sell order.
Here's my take-away- I will have a lot of small losers, small gainers, and an occaisional big winner- That occasional big winner % wise will
take care of all of the rest.....
|
|
|
|
Post by sd on Feb 7, 2017 10:42:02 GMT -5
I just added to TSLA, 257.20 intraday on break...
The expectation is that TSLA may retest this breakout move- indeed, has not gained today- and it may pullback some- As price pulls back from the breakout level, buyers ideally will step in and take positions- The initial breakout move was wide enough and closed well near the highs-
|
|
|
|
Post by sd on Feb 7, 2017 18:56:44 GMT -5
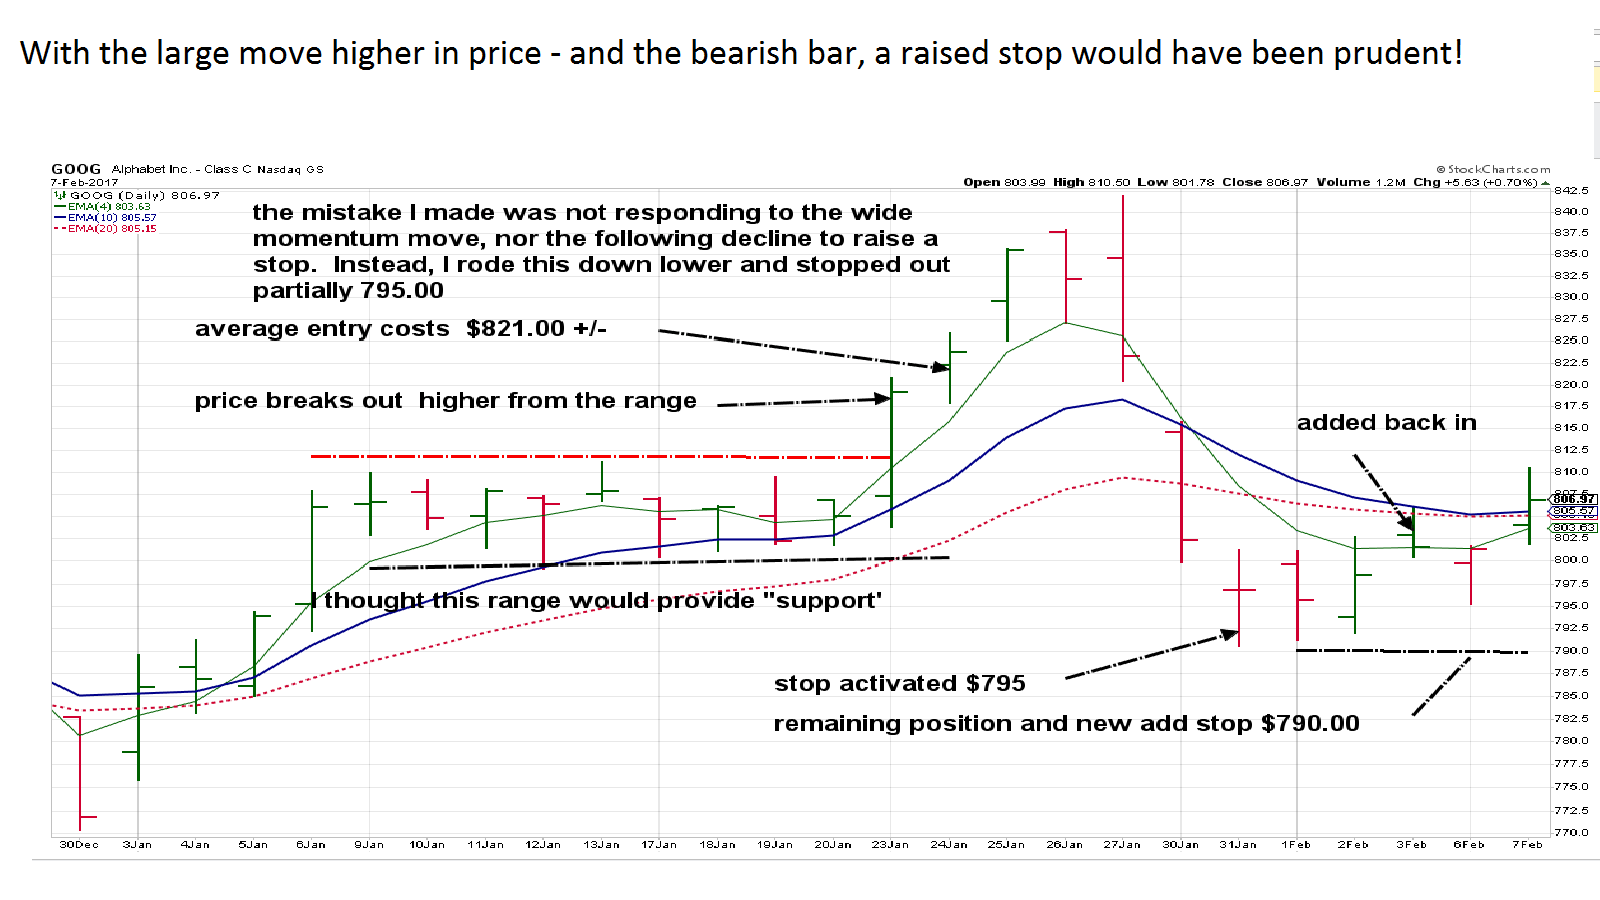
Posting a chart of the GOOG trades- It started off right- price broke out from a base and closed higher- I made an entry on the continued up move with 2 separate positions a few dollars apart- $820, $822.00 + change.... Price properly moved higher with some momentum, ran up to $840- a $20 gain - but not a large enough % move higher- and i'm thinking GOOG should be a longer term position...The $840 price spike takes the fast ema up wide- followed by a big red sell-off bar-
I wanted to hold for a larger move- and I was using the recent range as a perceived line of support- The premise being that that area would see buyers stepping back in and adding to their position. That failed to slow the decline in price, and my 1st position stop went into a market sell order- filled lower at 792 and pennies. That's a pretty substantial $ move- but not too much % wise for a high priced stock- About 3.5% .
Price came close to taking out my other position with a stop at $790.00, but rallied a bit- after a couple of days, it moved up slightly, and i added back into the trade-Stop still in place at $790.00
This last add was much closer to the Point of Failure- so it represents a smaller % possible loss .
Adding back into a position at this level is different- IMO- than adding back into a trade where the trend is declining-
The distinction is that the uptrend is still viable- and stops are in place for the full new position....
one mistake I failed to correct is that GOOG is overweight in position size-so the impact equals 2-3 separate positions in terms of dollar impact-
 ANOTHER WAY TO VIEW THE CHART: This is a renko chart on a short term- 30 min. time frame- Notice the moving average line - and - while one cannot react intraday perhaps, The moving average line rolls over as price declines- there was an ample opportunity to use the raised stop-loss approach off price closing below the fast ema to have raised the stop- and saved the trade from a 3% loss after being 3% higher- 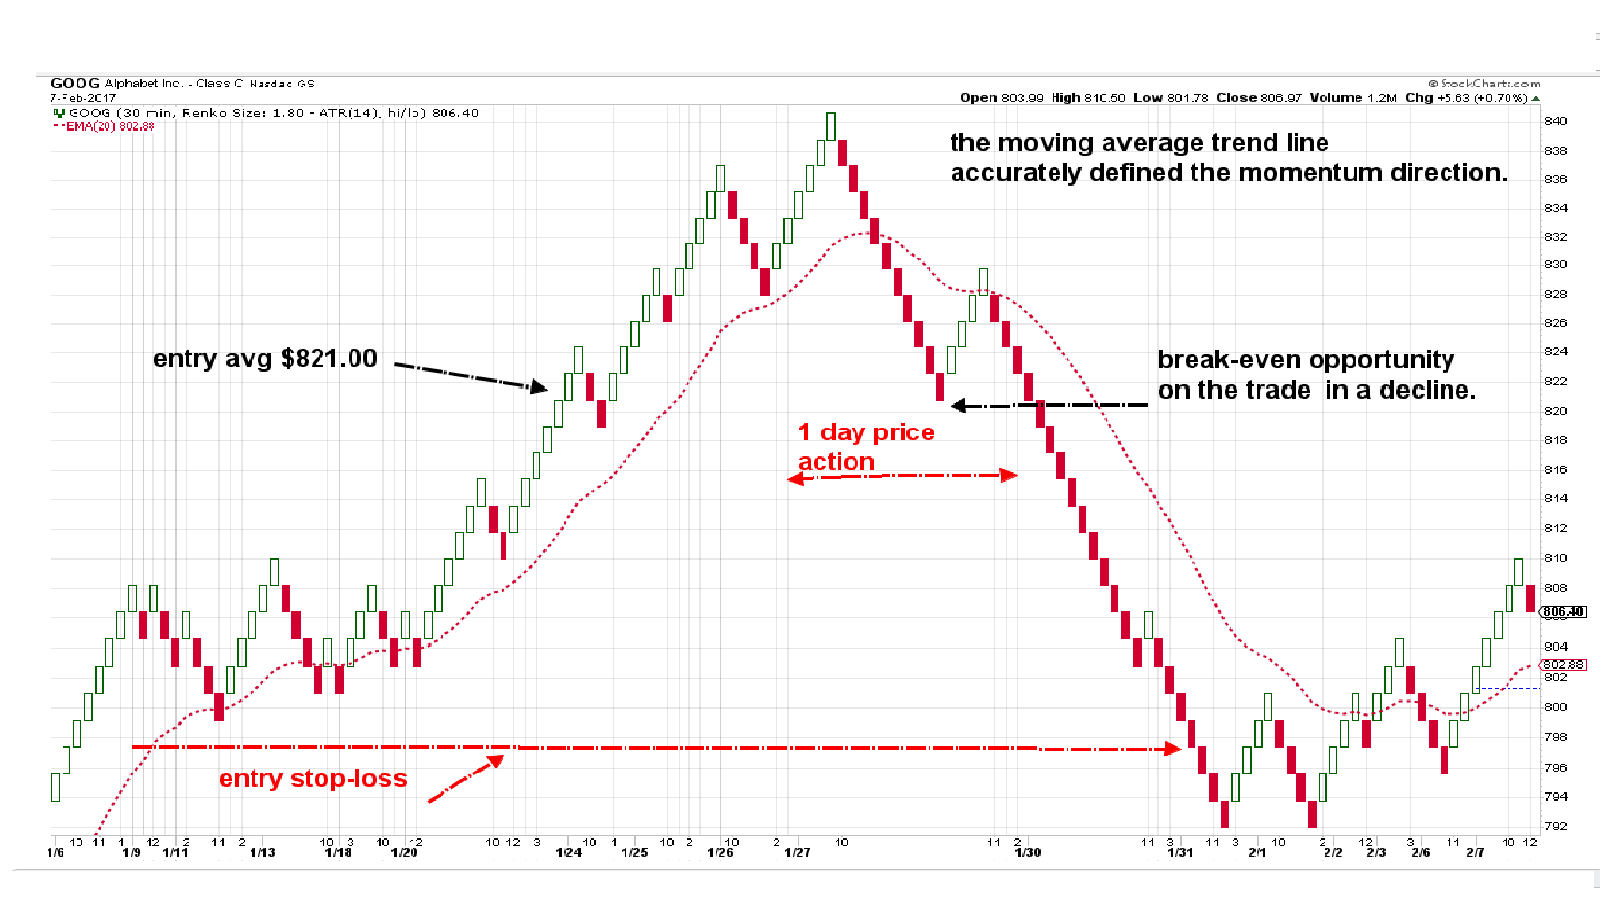 |
|
|
|
Post by sd on Feb 8, 2017 19:13:58 GMT -5
TSLA did move higher today, up about 1.8% and breaking/closing the prior high, as well as the high set last April.
NFLX moved higher; FB moved higher- (took new positions in FB); AAPL is plodding higher- (added) both in longer term accounts but I think I will continue to close stops on weakness. Msft is sideways. Waiting to see it move higher-or stop out...
Got stopped out on MU for a small gain, offsetting the small loss in EXAS, but XBI took my tightened stop out and whipsawed back higher-I haven't looked up the damage there....Robo stopped out on a tightened stop as it closed at the fast ema 2 days ago.
GLD and SLV are both trending higher- HMMM- Perhaps that's an indication of some 'fear' creeping back into the market?
GDX has been trending as well-
|
|


