|
|
Post by sd on Feb 9, 2017 6:33:01 GMT -5
2.9.17
Looking closer premarket at GDX- closed yesterday $25.41- Momentum is slowing ,some indicator weakness , so I'll start today with a lmt buy $24.65 assuming price may drop lower below the fast ema today- If that does not occur, I may go ahead and take an entry position later in the day.will add to gld on a pullback 117.30, stop-loss raised on present position to 116.00
TSLA surging higher premarket at a new high-$273- see i it holds!
EDIT UPDATE-
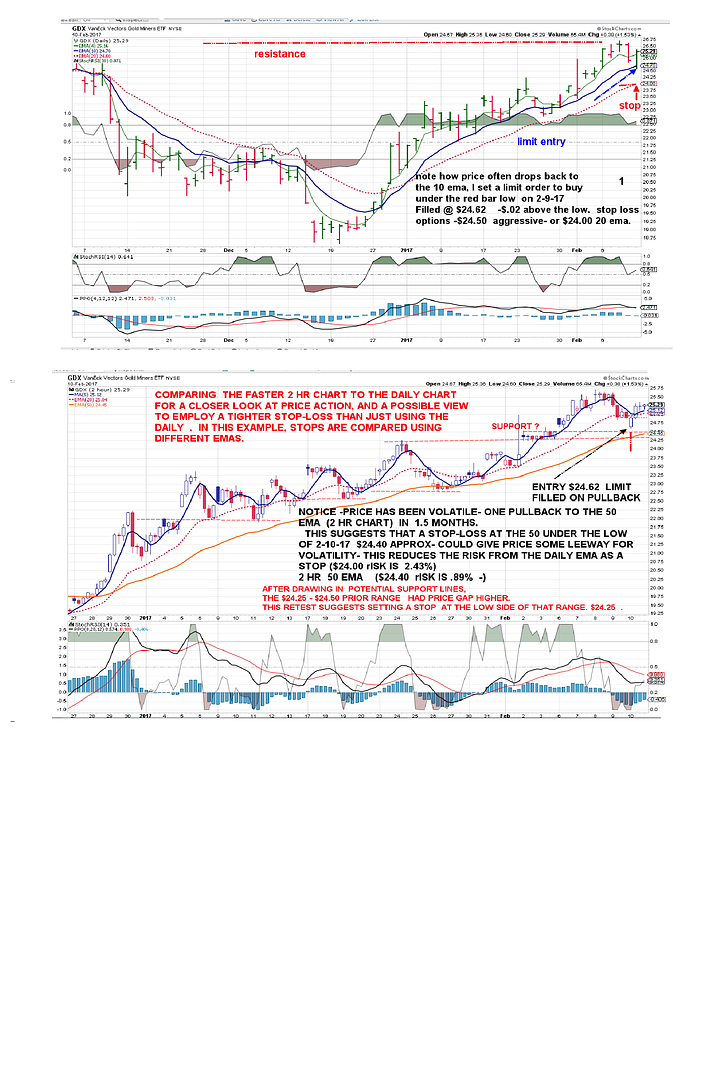
My limit order was filled $.02 above the pullback low 2.10.17-
We will see where this trade works out in the days ahead. The present question is how close might I put a stop-loss that would still be effective-
Since price made a nice upside reversal after that opening low, it looks promising- and potentially a stop just under the low $24.60 might suffice- particularly if i only want to hold the trade for a day or two-but since it has trended well for the past 6 weeks- I'd like to give it enough room to not get taken out on a minor whipsaw in intraday volatility.
That being said, I look at 2 options - price relative to the emas on both the daily and the 2 hour -
Price has held well above the daily 20 ema- the 4 ema seeing multiple penetrations back to the 10 with only 1 closing bar below the 10 ema in 6 weeks.
And, although it came close, the fast ema never crossed the 10 ema yet on pullbacks or consolidations-
Since jan 1, price has been in an uptrend reversal from the prior downtrend- The 20 ema has had plenty of room as a trailing stop-loss- Purpose of trailing a wider stop is to have something in place ..just in case- Recognizing that price fluctuates with the emas getting wider during momentum, and coming closer during consolidation , price volatility is the norm with this product. At some point , this trend will end- and that will likely start with a warning close below the 10 ema- Arbitrarily selecting the 20 ema as a stop at a "safe" distance from what has been seen as normal price volatility makes sense to hold for a longer term period of weeks ideally- That ema value is at $24.00 - the value of the 20 below the low that was put in. Options would be to just update daily with the 20 ema as it closes each day higher-
How to improve on the stop-loss-
If i was hoping to just hold for a few days, I might set a very aggressive stop just below the low of the entry bar, as it had a strong reversal higher- this can be seen better on a faster time frame chart-
Looking at the faster 2 hr chart, the price fluctuations and volatility on that time frame are more noticeable-On this chart i have a 5, 20 and a 50 and price is all above and below the 5 and the 20, with the 50 ema getting price closing below once during this time-
So, the 2 HR - 50 ema looks decent as a potential stop-loss during this past trending look, and is closer to the price than the daily 20- reducing the Risk % with a higher stop-loss. Also, the faster time frame chart offers potential more visible entries in a trending stock vs the daily chart.
ANOTHER VIEW:
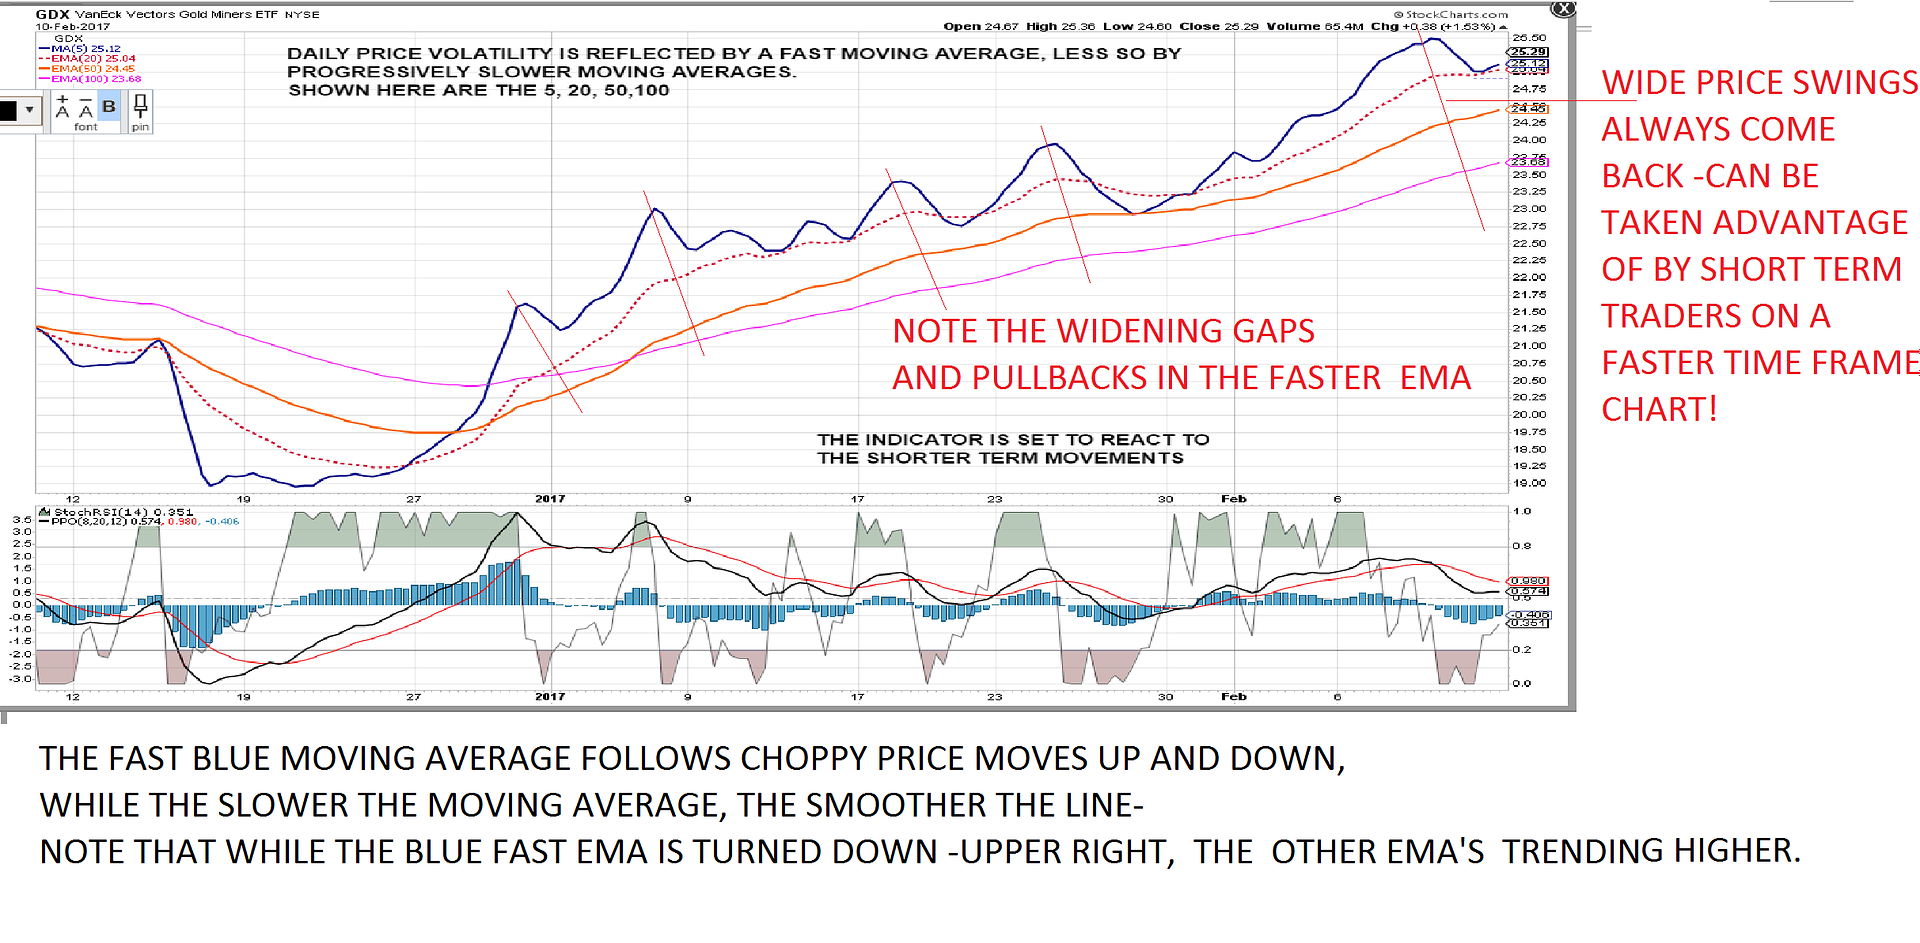
tO ILLUSTRATE WITHOUT PRICE BARS CLUTTERING UP THE SCREEN-
PRICE VOLATILITY IS GRAPHED BY A MOVING AVERAGE LINE, WHICH SMOOTHS THE PRICE ACTION BY AVERAGING IT OUT OVER A SET PERIOD - IN THIS CHART, NOTICE HOW THE VERY FAST 5 EMA IS COMPARED TO THE LESS VOLATILE 20, THEN THE SLOWLY CURVING 50, AND THE ALMOST STRAIGHT 100.
WHEN I GET SO FOCUSED ON THE DAILY PRICE ACTION, I HAVE TO REMIND MYSELF TO SEE IF PRICE IS INDEED BREAKING DOWN AND STOPS SHOULD BE RAISED OR THE POSITION SOLD- TAKING SMALL PROFITS OFTEN GENERATES EXCESS COMMISSIONS AND WILL MISS THE GAIN OF A LARGER MOVE- AT LEAST THAT IS WHAT I AM TRYING TO
TEACH MYSELF BY MAKING THAT CHOICE AS TO WHEN A TIGHT STOP NEEDS TO BE IN PLACE, AND WHEN IT SHOULD NOT BE REACTING TO "NORMAL" PRICE ACTION- LIKE
PULLBACKS INTO A BASING ACTION WITHIN A GREATER UPTREND- FASTER TIME FRAME TRADERS CAN TAKE ADVANTAGE OF THE SHORTER TERM VOLATILITY TO NIP PROFITS AND QUICKER REENTRIES- BUT AS AN EOD SWING TRADER, I'M TRYING TO DEVELOP THE PATIENCE TO STAY WITH A TREND UNLESS VIOLATED- OR AN EXTREME UP MOVE OCCURS FROM WHERE PRICE WOULD NORMALLY RETRACE ENOUGH TO OFFER A VIABLE REENTRY.
RECOGNIZING THE PREDOMINANT TREND IS GENERALLY THE DIRECTION i WANT TO BE TRADING IN- AND COUNTER TREND REVERSALS ARE MORE DIFFICULT TO SUCCEED WITH-BECAUSE THE TREND HAS SOME BUILT IN MOMENTUM THAT USUALLY DOES NOT REVERSE DIRECTION IMMEDIATELY. i DID HAVE A GOOD REVERSAL EARLY ENTRY IN GLD -BUT MOST TIMES I'M LOOKING TO TRADE LARGER "WITH" THE TREND- AND SMALLER IN COUNTER TREND- AND WHEN THE MARKET IS IN RALLY MODE- WITH TREND IS SAFER THAN BETTING AGAINST IT. THERE ARE EXCEPTIONS OF COURSE STOCKS AND SECTORS THAT ARE NOT IN FAVOR- OR ON EARNINGS DISAPPOINTMENTS-
EDIT NOTE -I WAS STOPPED OUT FOR A SMALL LOSS ON GDX.
|
|
|
|
Post by sd on Feb 16, 2017 13:41:45 GMT -5
TSLA -STOPPED OUT ON PART OF THE POSITION YESTERDAY 2.15.17, REMAINDER THIS AM
\ 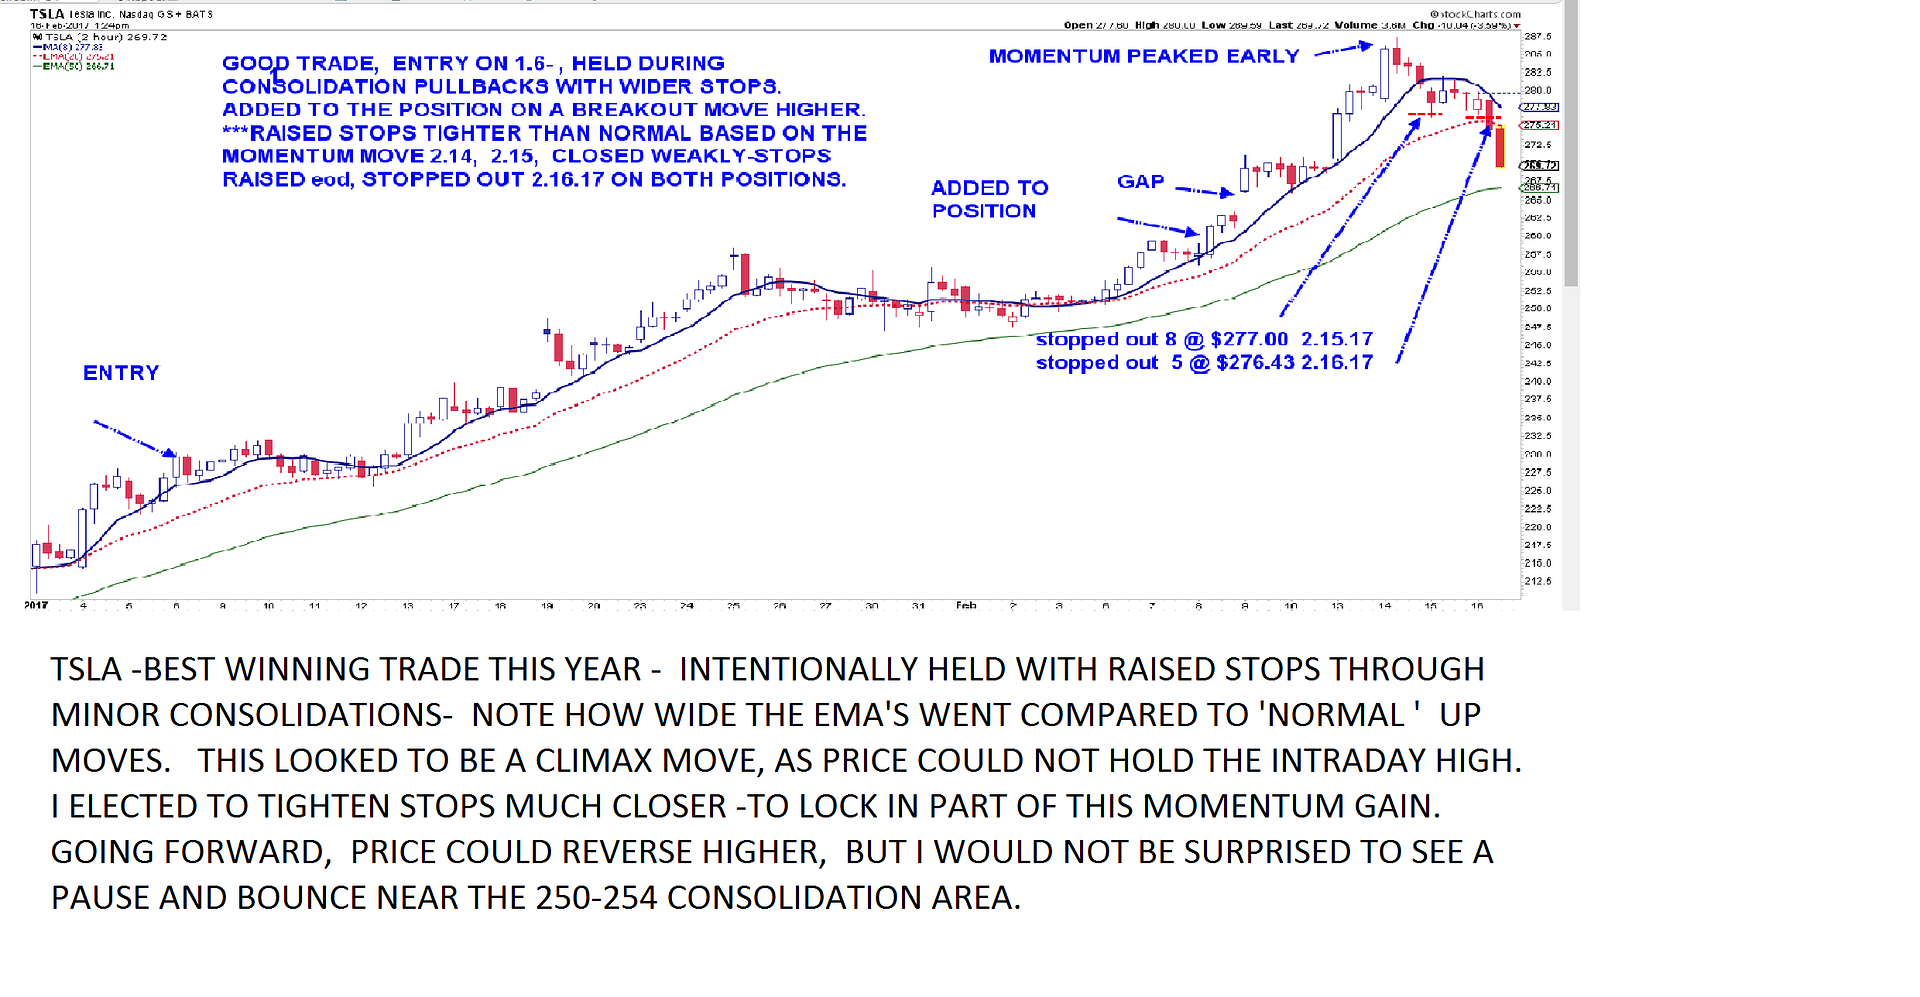 Had -2 positions- in 2 accounts.... 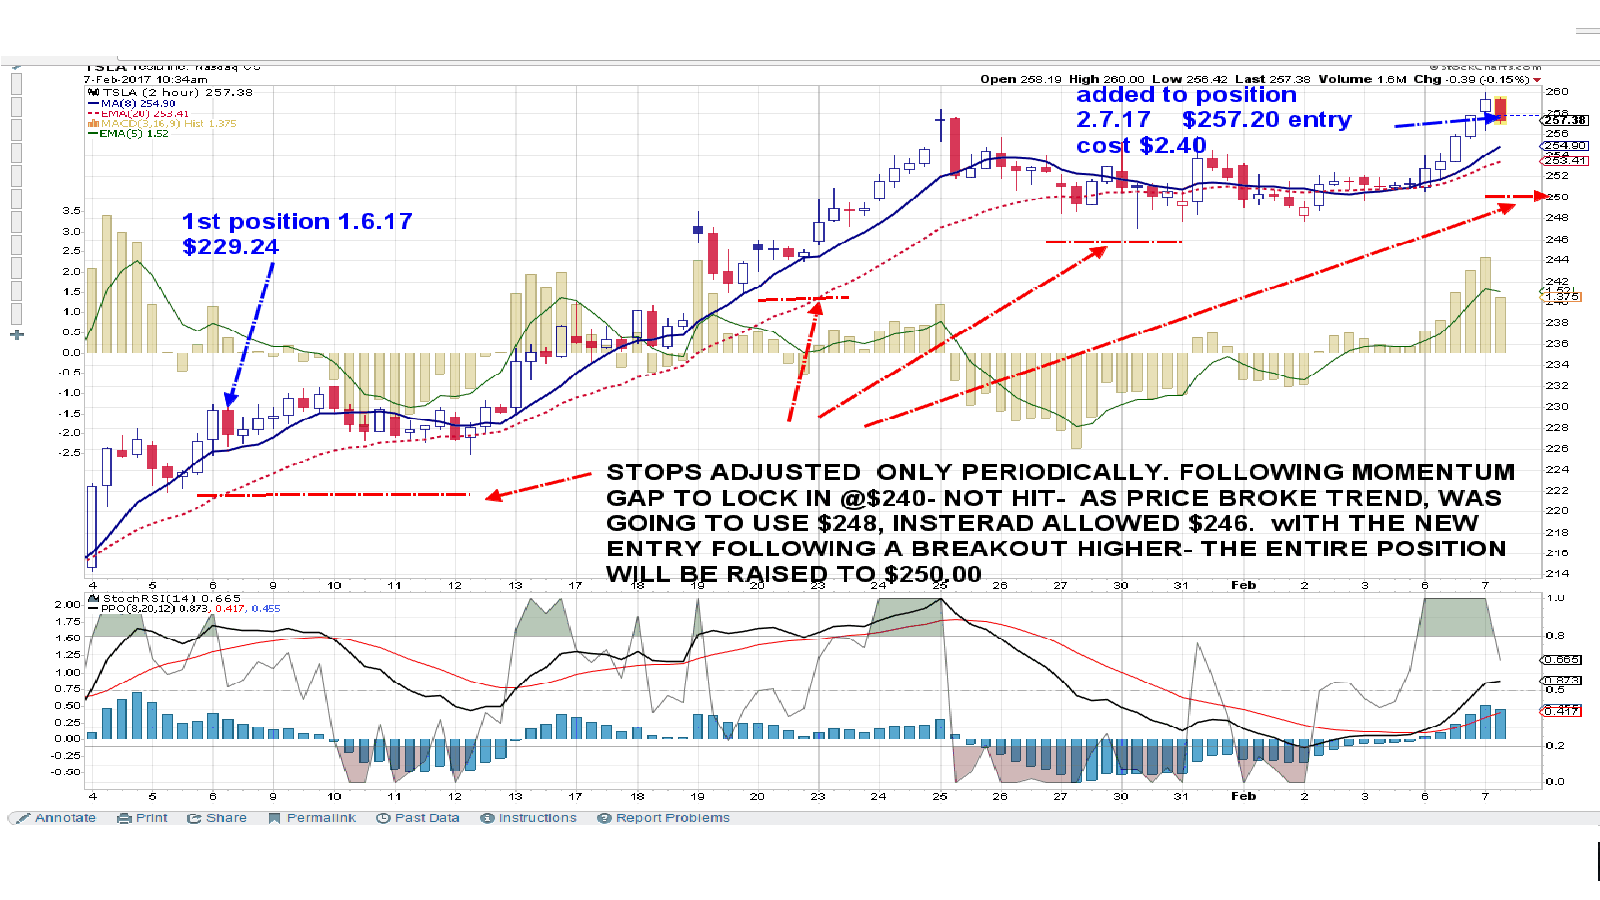 |
|
|
|
Post by sd on Feb 16, 2017 15:40:23 GMT -5
MSFT TIGHTENING STOPIntraday opportunity to check out positions-limited time .... I'm scratching my memory - but cannot recollect whether I stopped out on msft as it had moved higher in this chart- Might be confused with Goog- But- like Goog- I did make an early entry (reentry in Goog) on a early reversal in the trend.
The MSFT 2 hr chart illustrates an unsustainable vertical momentum move that breaks out from a week+ base, goes sharply higher- gaps and the gap fails to hold, price reversing the next day- A Friend had purchased MSFT- Aha! and so I tracked it as it pulled back- I set a higher buy-stop well above the declining price as it neared support, and was filled the next day- and i considered the low of the prior day a likely stop-loss-. Since the prior base was more substantial just below that price decline- it seemed a reasonable Risk- I usually wait for the typical base to develop in a decline-because the 1st up move often fails- The indicator histogram also was ticking higher from extreme oversold... 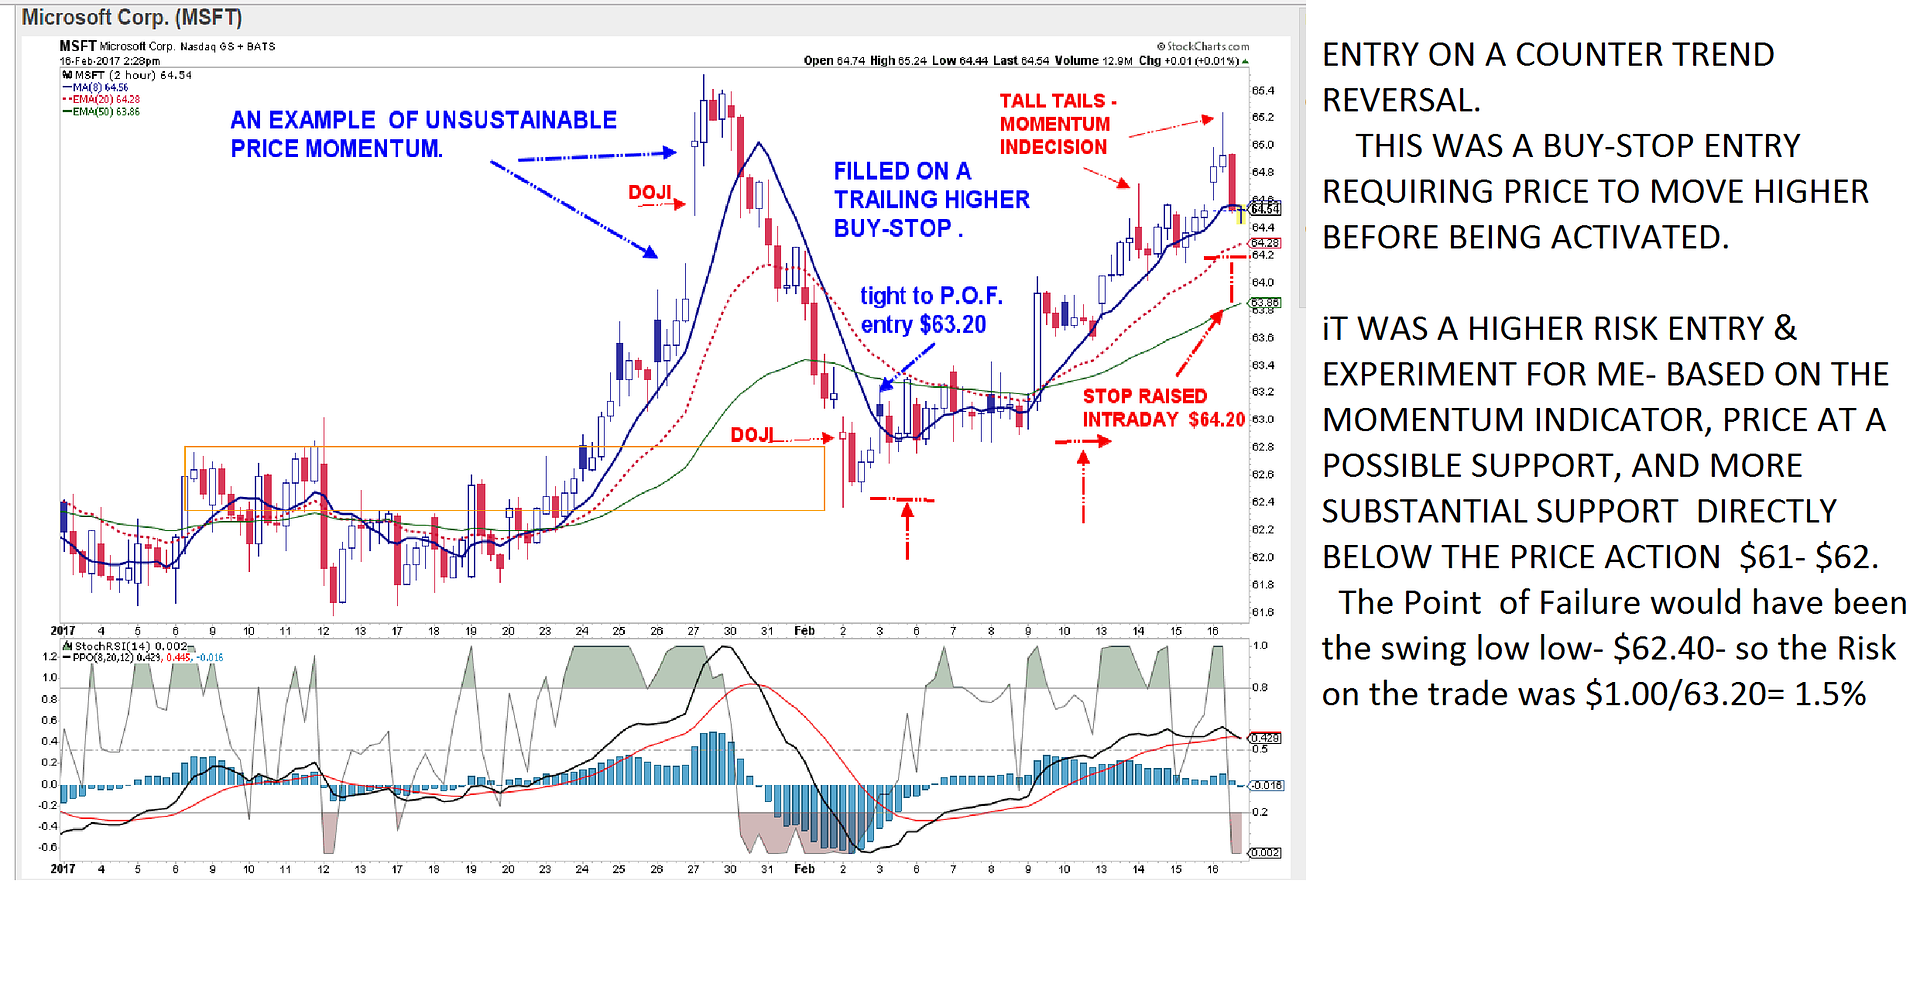 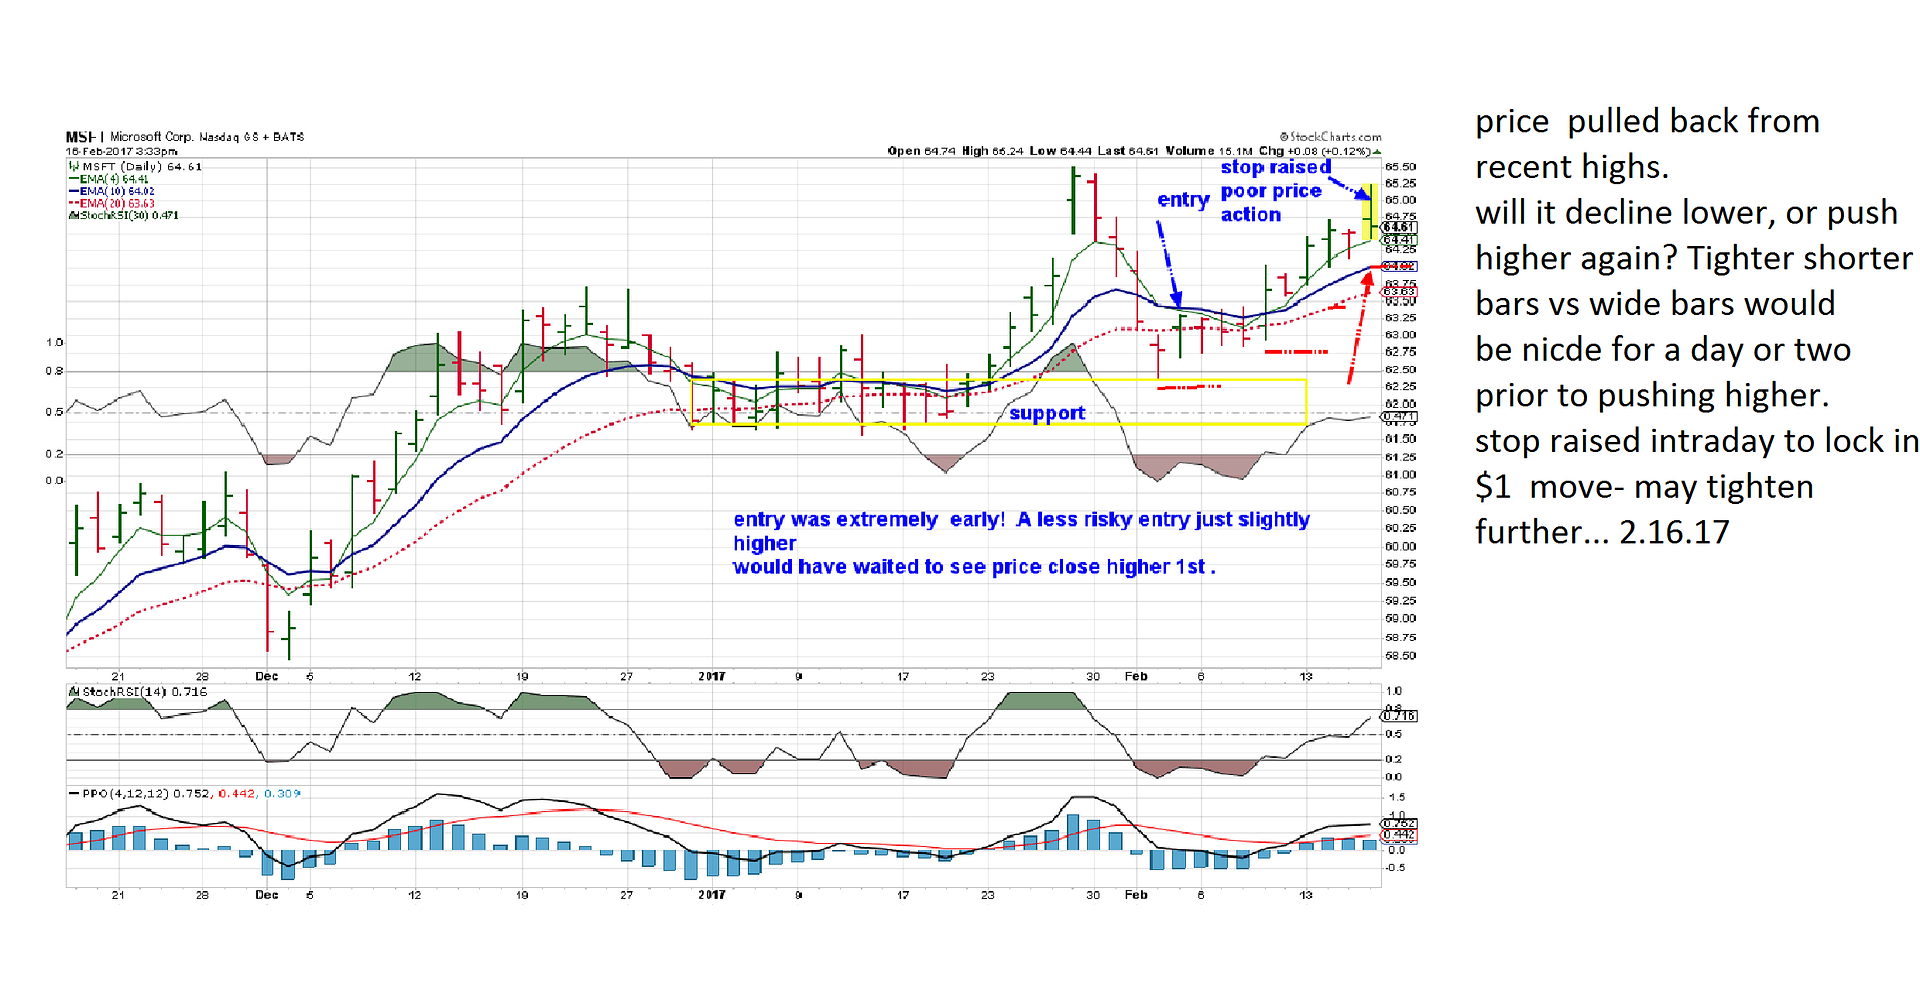
|
|
|
|
Post by sd on Feb 22, 2017 16:08:51 GMT -5
wED 2.22.17 4:05 -
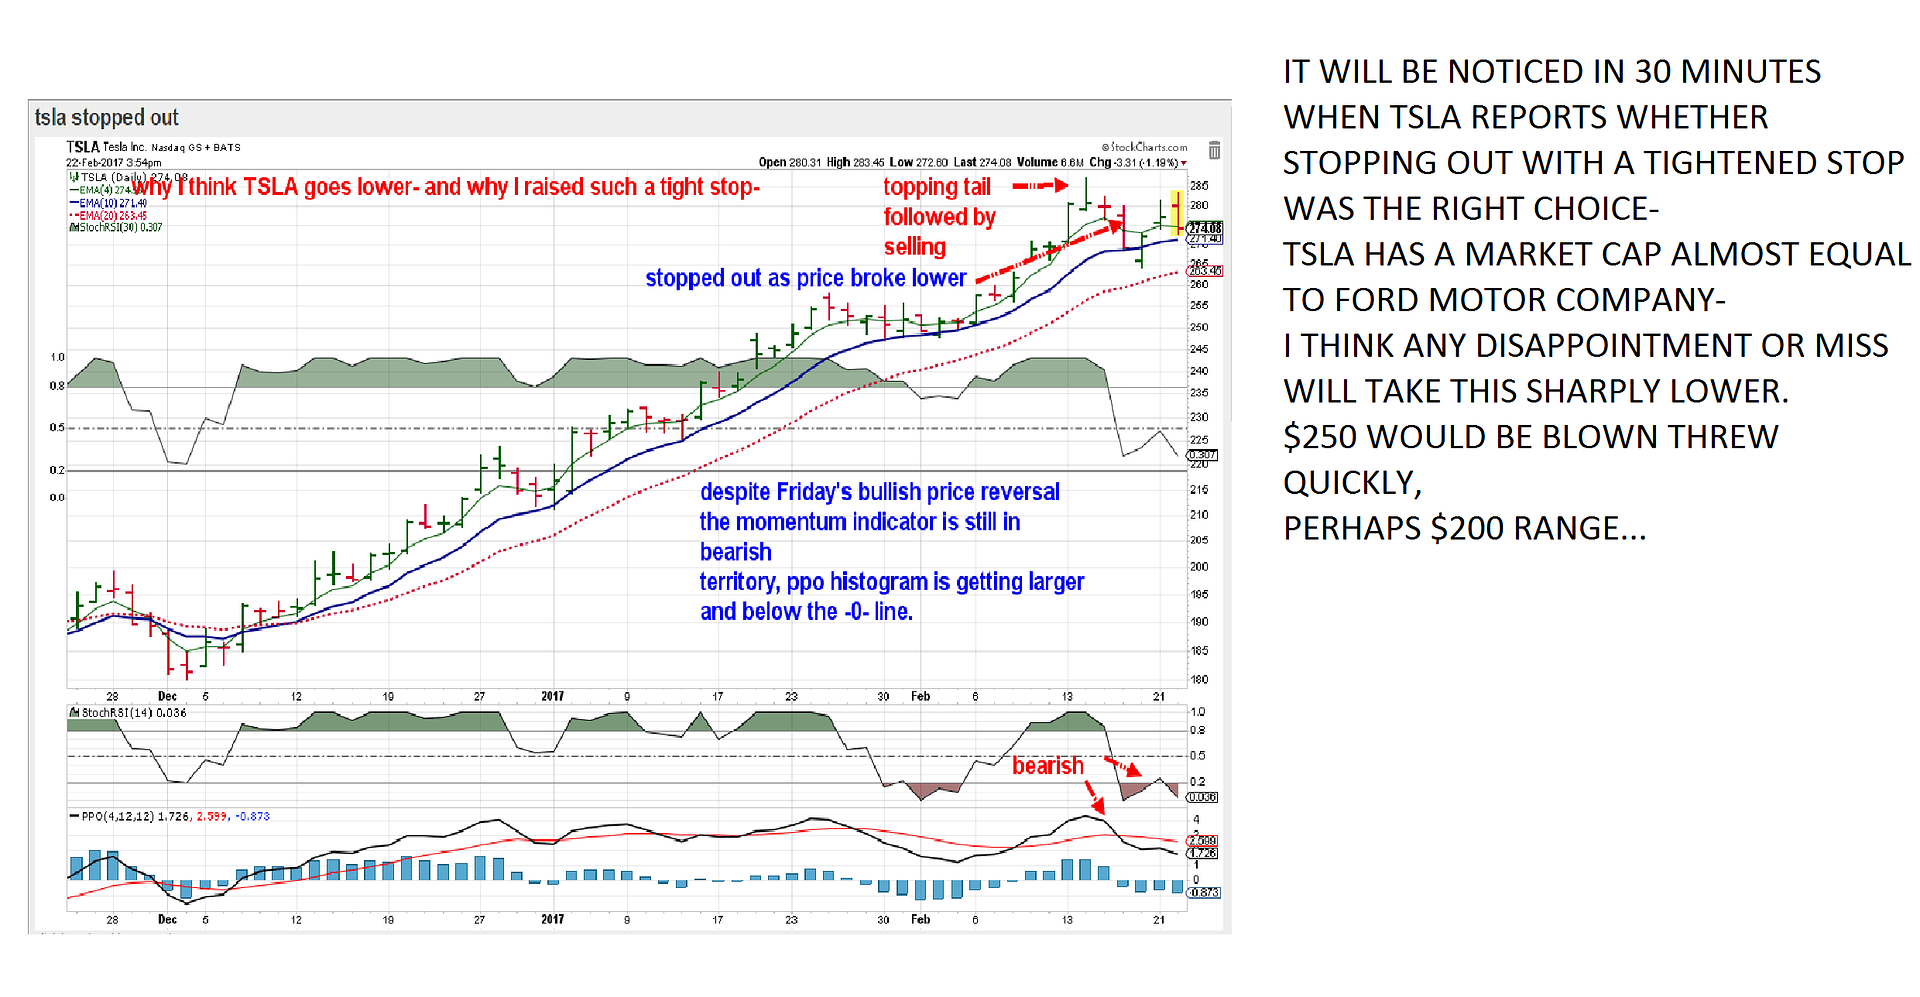
TSLA -reports in 30 minutes- It presently has the market cap of FORD! Any earnings miss will likely send it sharply lower - I think exiting as i did makes sense- should it beat, and move higher- i may reenter..... Edit -TSLA gave pos guidance, and is up slightly in after hours 279-280 range- won't rush into this trade tomorrow-
|
|
|
|
Post by sd on Feb 23, 2017 8:34:34 GMT -5
TSLA moved higher in after hours, and we will see if it can sustain it's after hours gains today- I am out of the position presently, and realistically cautious about jumping back in today-
There was interesting commentary by Tim Seymour on Fast money- and several other commentators that point out that investors in TSLA are buying a Story, and Elon Musk as a visionary-
That's not to discount that TSLA- moving with upside momentum, can likely be traded as a shorter term trade- allowing the TSLA story as an investment in a portfolio be a very small spec position if one has the deeper pockets needed . Note that "High Flyers" often get a lot of attention on the way up, and can be sources of profit taking in a declining market.
Here's one article that points out the TSLA shortcomings-
seekingalpha.com/article/4048307-wsj-tesla-investors-susceptible-getting-burned?ifp=0
|
|
|
|
Post by sd on Feb 23, 2017 10:29:34 GMT -5
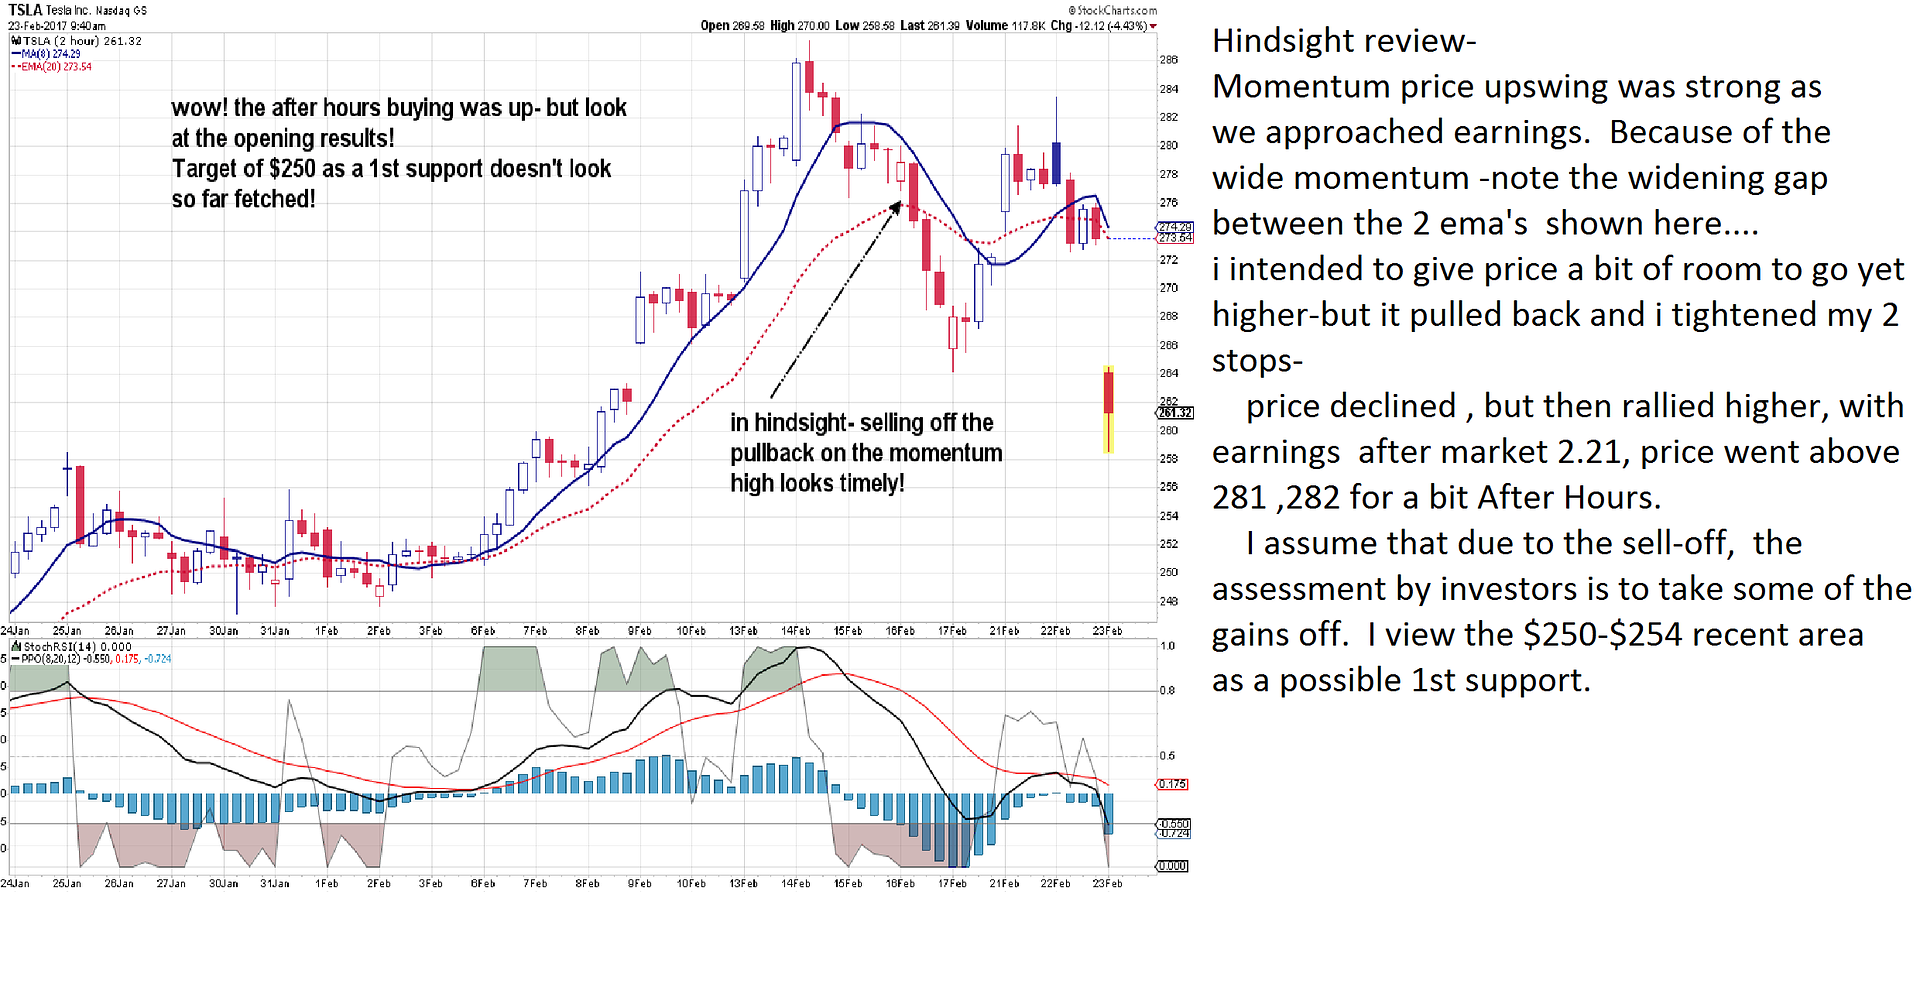
caught the 2.23.17 open and TSLA gapping down lower on the open.
Earnings are a crapshoot- it could have gone either way- and after hours it looked like TSLA was going higher.
Hindsight- it was a good decision to tighten stops on the momentum move a few days before earnings and get stopped out.
I had a nice hold, and add into this trade, and both legs of that trade made profits.
Earnings as a catalyst - lots of 10% or more moves can occur on earnings beats or disappointments.
I'll log this one is as a well managed trade-and lucky decision to take action on the momentum move.
This also reinforces the need to adapt to the type of price action that is occurring-
So, the earlier positives were -as price slowed into a consolidation, I kept a stop just wide enough below the consolidation it was not whipsawed-
I had intended initially to set a tighter stop- but backed it off about 1% wider- the tighter stop would have been hit, the just slightly wider one came close- but was not touched.
Another plus is that I added into the position when it was moving higher-This was easier to do as I had already had a winning gain on the initial trade- but the point to positively reinforce is that once price is trending, go with the trend.
I took a loss in URA - on split stops- and not reacting to the choppy price action.
Presently, a good entry on the AVGO breakout from a consolidation in an uptrend- I believe i had also gained on this trade earlier-
|
|
|
|
Post by sd on Feb 23, 2017 20:37:13 GMT -5
Thurs PM - A lot of things sold off today- including some large names within their space-
NVDA broke down and it looks like the analyst that declared NVDA is overbought will be right- targeting NVDA between 75-90 per share. HMMM, is the enthusiasm for the far future declining/? I think i had an initial good NVDA trade, and got whipsawed some weeks ago- part of the learning process ..... Don't react too early -give it time to prove itself.....
Forget the intraday price action- the open and close tell the better story..
Regarding indicators- i like to adjust them to be more responsive, but i actually do not rely on them much. They are useful as a confirmation of a certain level perhaps...or a warning..
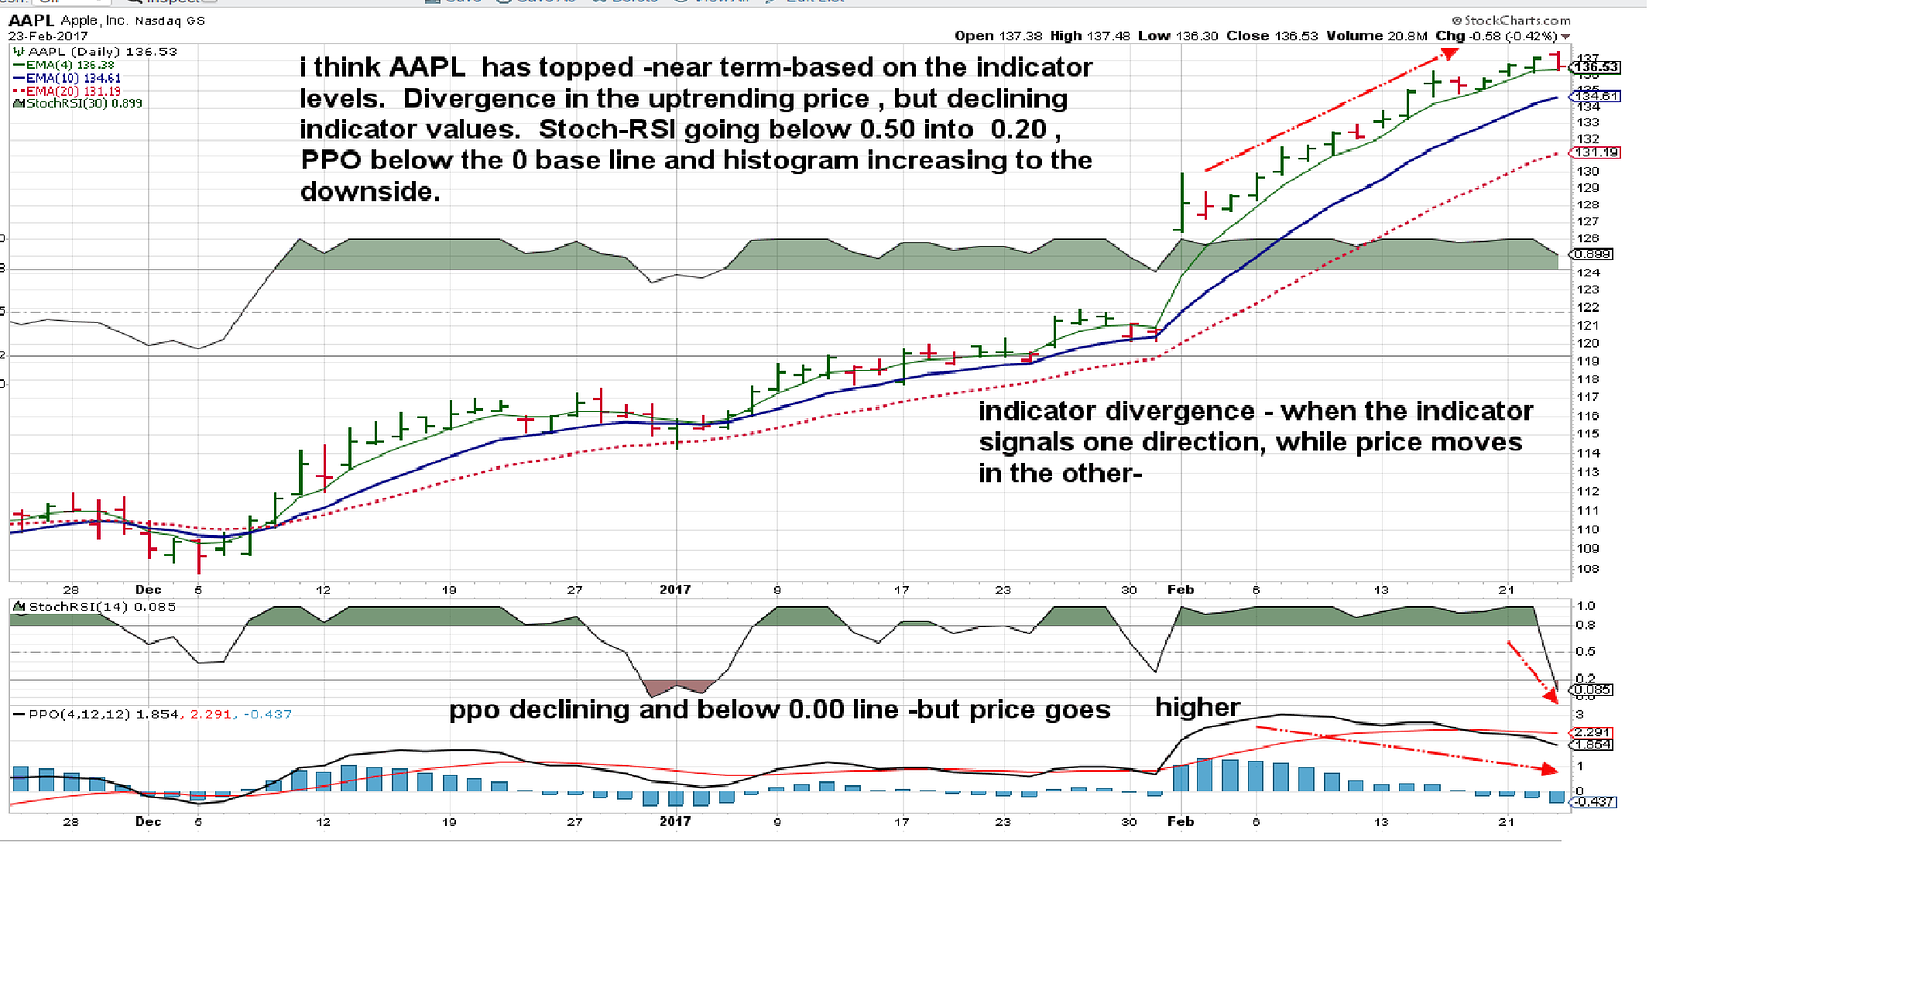
AAPL has been a long term small position- and the indicators have gone into negative territory, while price has continued higher. This is called a divergence- with the indicator supposedly
has now fallen lower than it has been in a while, although price still closed above the fast ema. This gives me reason to tighten the stop-loss somewhat aggressively- it will allow me to lock in a nice % gain on a price pullback, so a 136 stop is quite aggressive- and i would hope to see a 5% pullback . i think a good part of me would like to see a market correction where i could Buy FB, Goog,AAPL AMZN at a 10-15% decline in a longer term hold......I think Technology will drive us forward././..and in the long term , betting on the large cap performers will be the place to be- After all, they will likely buy up the smaller disruptors of the newer technology- consider it the BORG if you are a sci-fi fan- absorbing and assimilating that in it's path.
Is that not Capitalism? And- somewhat combines Darwin survival of the species- i think of that each day when i approach students in a crosswalk with their eyes solely focused on their smart phones! AHH- back to charts and trading- The AAPL outperformance has been consistent, steady, and the indicators suggest it is perhaps getting tired and needs a rest...
. |
|
|
|
Post by sd on Feb 24, 2017 14:15:03 GMT -5
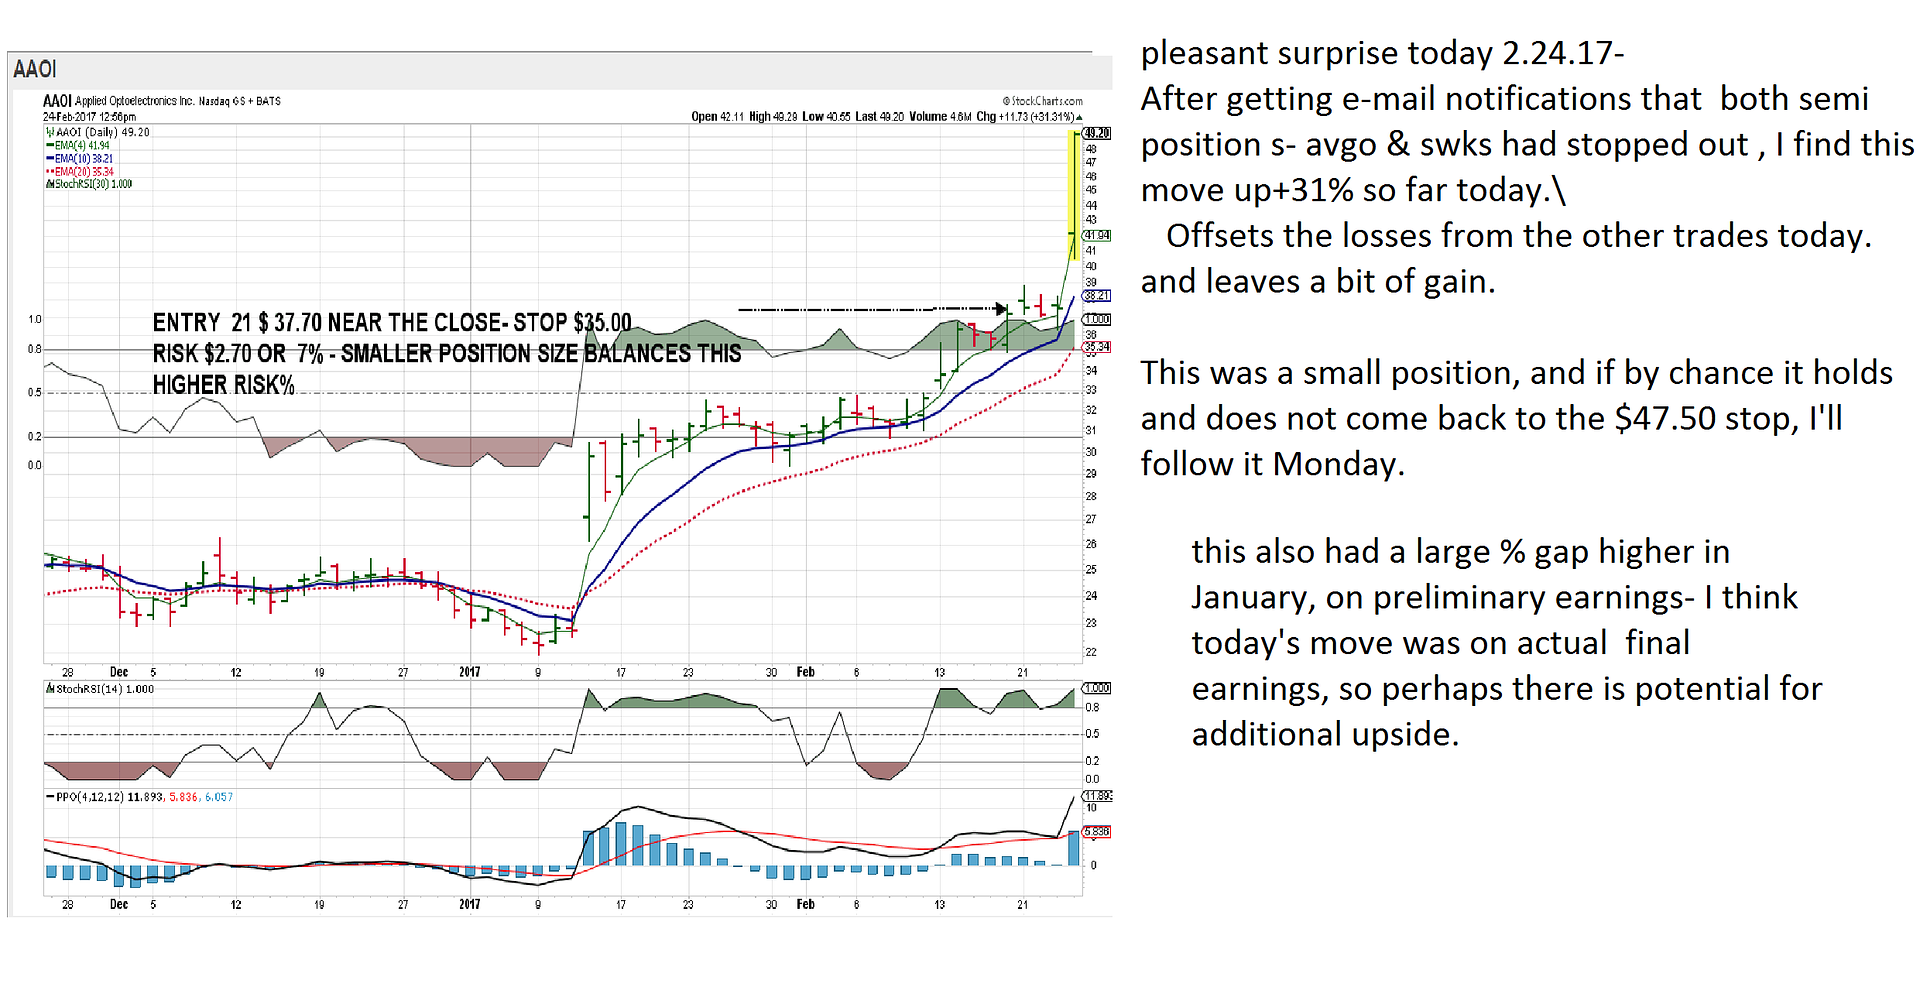
Nice present today- after being notified 2 chip positions- AVGO and SWKS both had hit my stops (losses),
I get an email AAOI is up over 2% (standard e-mail on a move up or down from the IB Broker.)
Pleasant surprise to see this small position move up over 30% in one day! I tightened the stop, will determine at the close how I will
let this play out. Greed suggests to simply sell....
EDIT Note- Stopped out $47.45 14:22
|
|
|
|
Post by sd on Feb 25, 2017 9:52:13 GMT -5
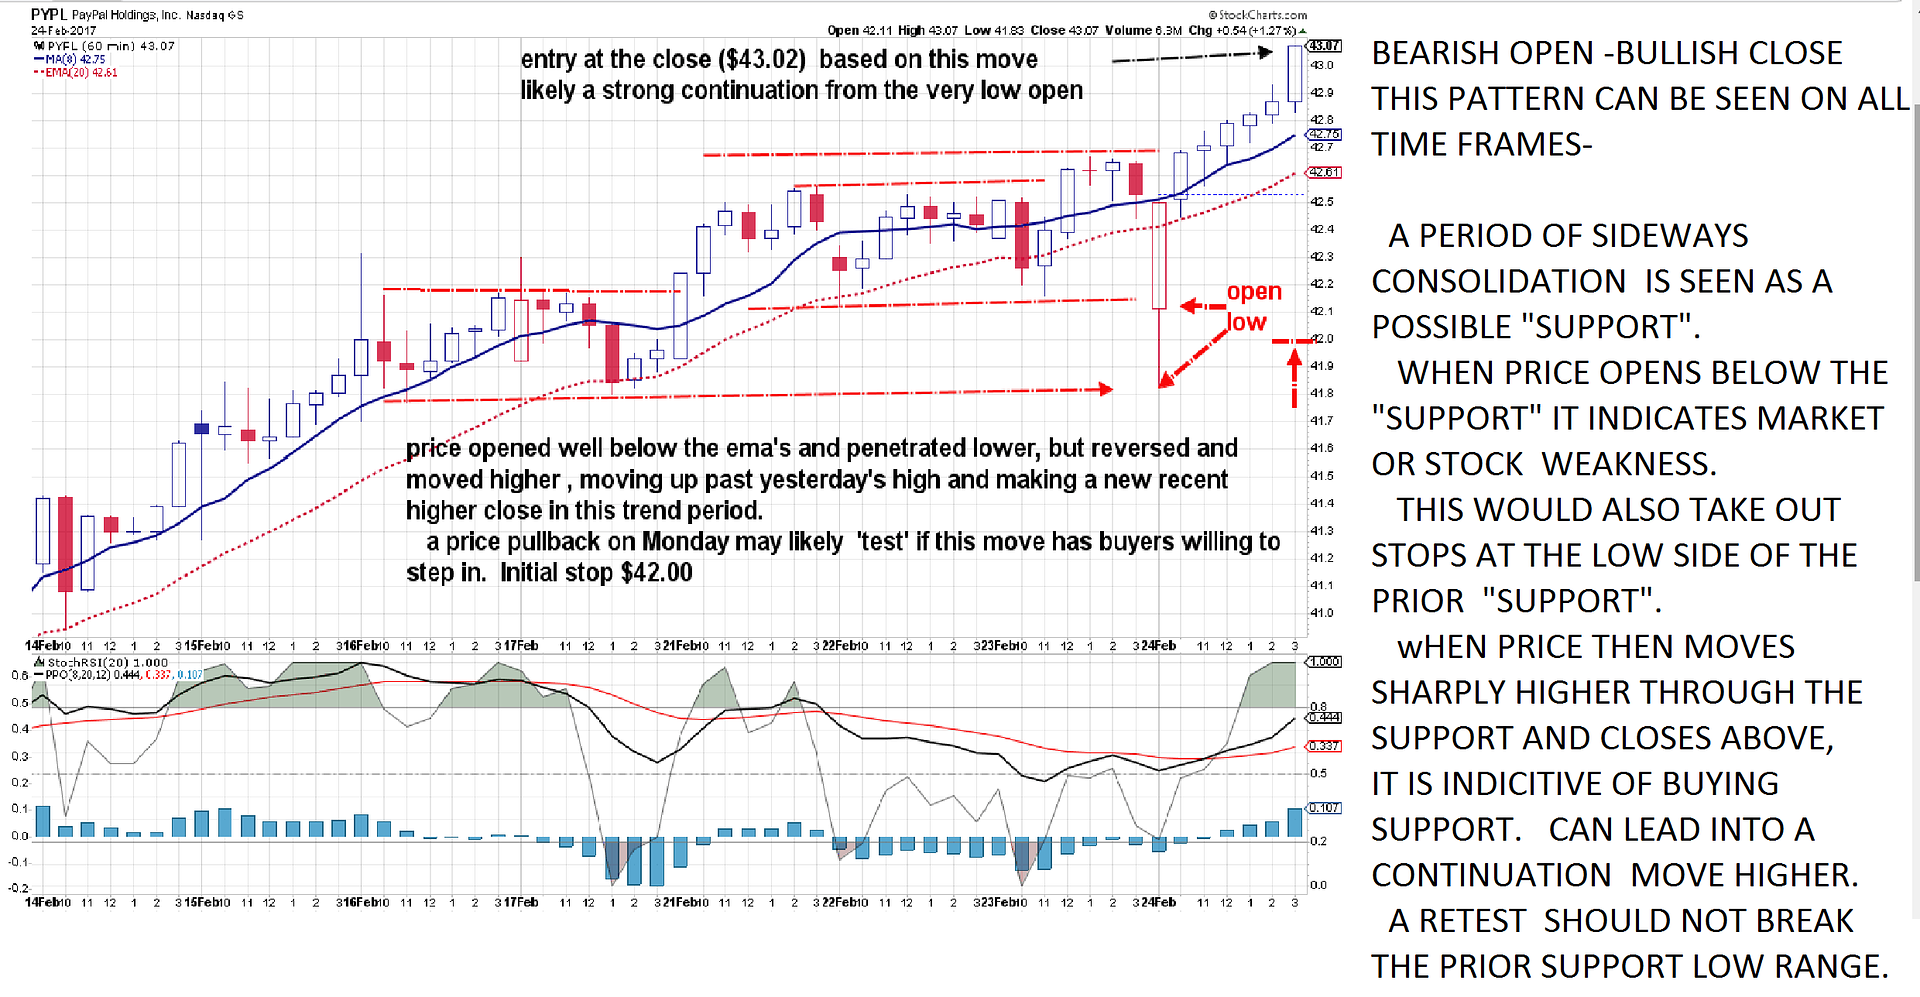
Caught time to be on line just prior to the market close- I took positions in TLT, and PYPL-
PYPL has been trending up- and a better BUY could have been had at lower levels-But today's price action/reaction
looks like a potentially positive continuation of the uptrend.
While this has more significance on a longer Daily or Weekly chart, this faster 1 hour chart sees price trending, a couple of days of sideways consolidation- and then a price opening under the consolidation, penetrating even lower in the 1st hour, and then reversing higher to go back up through the prior consolidation and go on to making a new recent closing high.
I view this as a bullish continuation, and potentially it is institutional Buying that will keep purchasing and pushing price up.
A retest should not be able to go back below the prior support levels- or below the Open that opened Low. JMO. If it does, it would indicate that there is not enough buying demand to
push prices higher.
 |
|
|
|
Post by sd on Feb 26, 2017 21:00:07 GMT -5
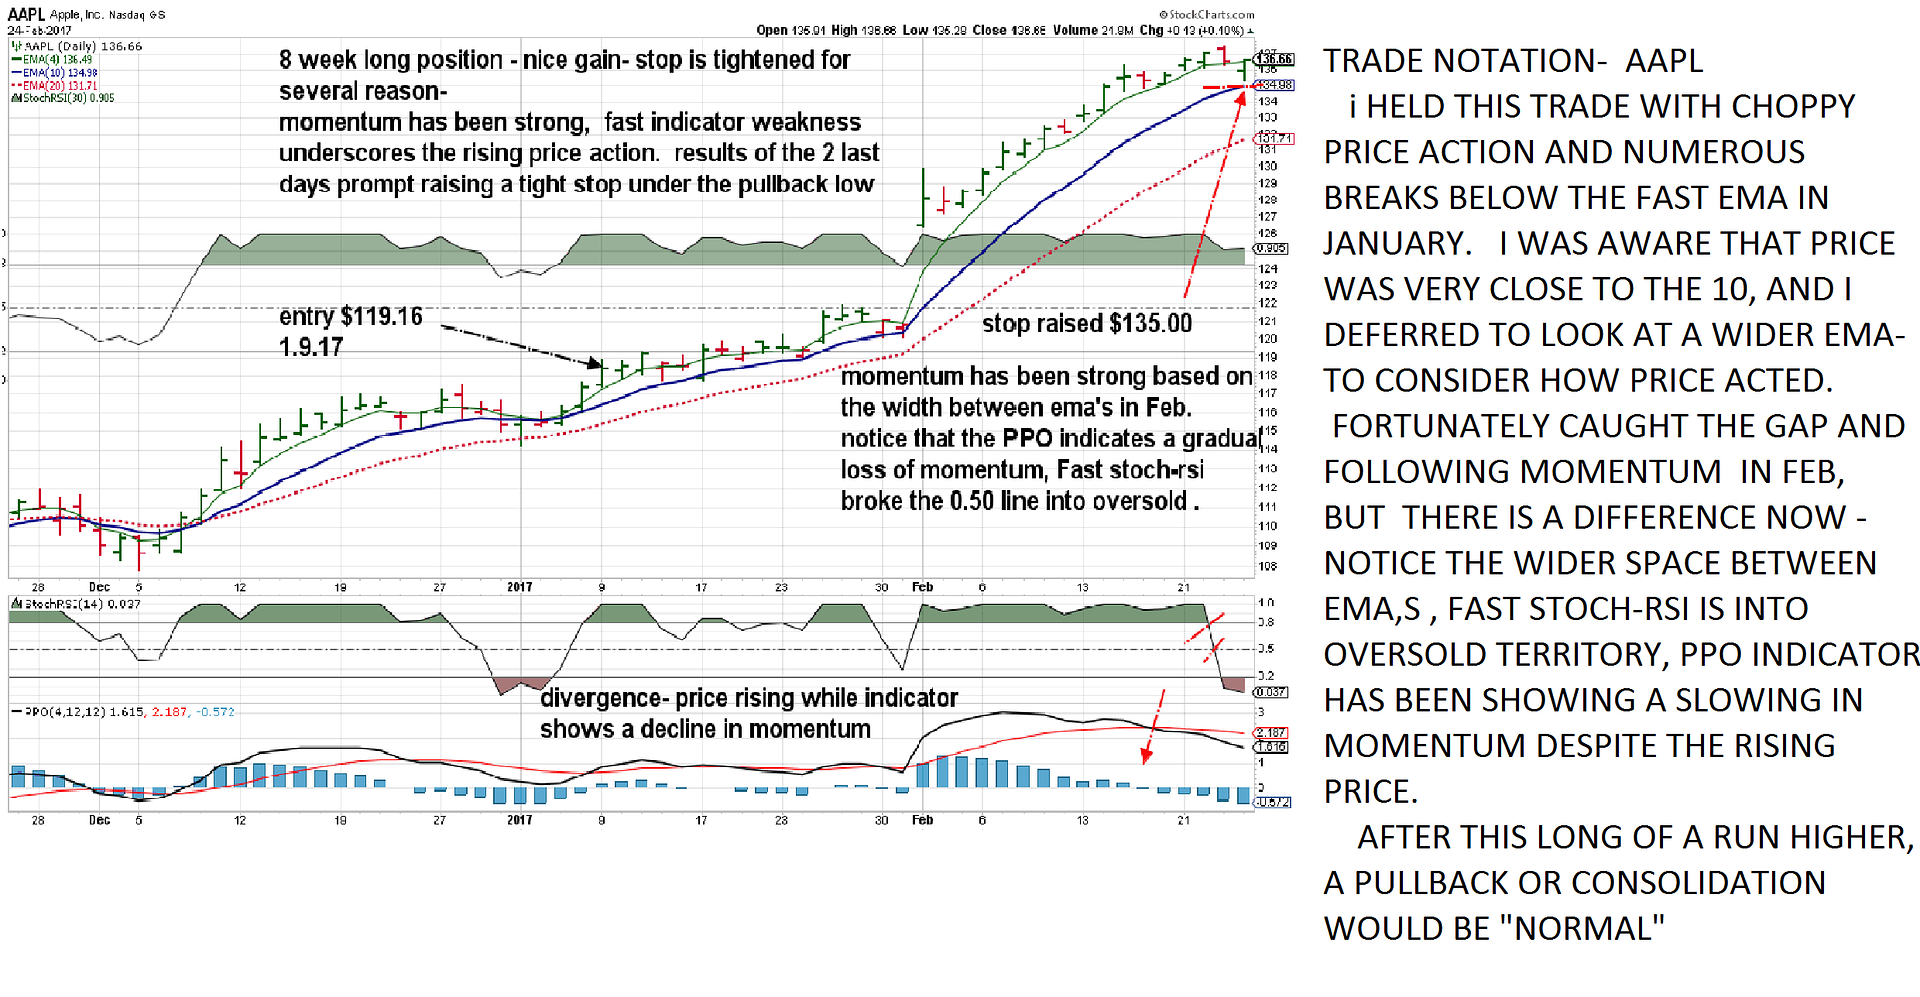
AAPL POSITION- RAISING STOP-LOSS
I entered AAPL in the longer term accounts- or trades for both my wife and I - but did not try to be too aggressive with too tight a stop-loss.
During the month of January, price tepidly inclined higher, with multiple closes below the fast ema- I was not aggressive- and kept a stop back near the 20 ema, and some patience
in following the trade. Had price broke down with multiple closes and breached the 10 ema with a close below, I likely would have reacted.
As it was, AAPL moved slightly up, Feb gapped higher, and the greater momentum is noticeable by the wider gaps between the ema's,
Worth taking note of was the price action in both December and january - as somewhat choppy, slow momentum, but moving higher-
The indicators graph this choppiness in the price action, notice the histogram declining before price actually slows. Over reliance on indicators- or values- is a mistake if taken literally, but they can be useful in interpreting or confirming price-
For example- Just because the stock has a RSI value that is in overbought territory is not a reason to sell by itself- Overbought- can remain overbought for many points higher- It simply indicates that momentum is strong- Same with "oversold' Does not mean it's a good time to Buy- Wait for the turn
AAPL gave that possible Turn signal Thursday/Friday- Thursday was a red bar- above the ema, but it started the indicator to break lower- Friday saw price open lower and close under the the ema-
That's a challenge- to the momentum- It does not mean it will immediately decline- but this uptrend this month has been substantial, and a pullback or consolidation is warranted.
Stop is raised to the low 135.00.
Should i stop out here, a reentry on a pullback or move higher is warranted.
|
|
|
|
Post by sd on Apr 25, 2017 20:02:28 GMT -5
4.25.17 Overdue time to make an update-
Broke the usual routine, and elected to spend and focus my energies on the Home Front-a more immediate demand than trading...
I decided in March i would Buy Both XBI and TQQQ and hold without any stops- Bought both at the highs of course! I had a couple of other positions in place with stops- just let them ride......
Then, Ostrich like, I inserted head in sand for 3 weeks or so and looked - and Lo and Behold, they were down substantially and my other positions had stopped out - for small profits-
With this recent market rally, i'm back in the green, and bought a few other adds today- ITA- defense- ROBO, BOTZ, and a bit of AAON (Only company in the industry group with NO DEBT) Also Spiderman's Horse race pick this week.
Free time Focus is more centered on the home projects-these days, usually revolving around growing things in the Spring- And i tend to put Blinders on and concentrate on the "task' at hand- Had i been getting substantial wins in my trading, perhaps That would have kept me involved- but perhaps not.....
Finding and keeping a balance in your life is healthy-
i had noticed that in my less active trading account- and my wife's- better % gains with fewer trades, wider stops-Perhaps just the luck of the draw- but fewer trades, lower commissions, larger gains, less attention...... HMMM......That has appeal.
So i went for TECH- 2X TQQQ and Biotech XBI - and bought positions, and let it ride sans stops-With an almost 8% decline, biotech finally came up for Air, TQQQ breaking out to a new high- With today's Adds, I have filled up the 'Active' account- and we are heading into MAY-
So far, early earnings are coming in higher, so I have to elect how to approach these positions with stops- just not too tight .....
Will these positions be higher in 6 months? 1 year? Will the eventual "correction' occur? Stocks are presently highly valued- but even BRKB is rallying after a sizeable pullback.
I think stops are prudent today- Valuations are not inexpensive, and so momentum carries the day- eventually earnings and momentum will have to be justified- Check the market tempo to see if there are a greater number of new highs - as the market pushes forward- or is it just a smaller % carrying the flag?
Got to install a new drip irrigation system this weekend and just bought 4 additional varieties of Fig trees at the Raleigh Farmer's Market! Now, that's tangible! It's all an investment to reduce the Time necessary to properly ensure that I get a return on my Investment of Labor and Plant materials.
FWIW- I think that if one is going to be an active trader- One has to keep a focus on those events that move the market- and a wider understanding of the macro trends- One has to be 'nimble' to be a short term trader- to try to take advantage of short lived trends. Much more difficult than being an "Investor"
That takes Time and focus- SD
|
|
|
|
Post by sd on Apr 27, 2017 11:55:23 GMT -5
|
|
|
|
Post by sd on May 1, 2017 19:48:33 GMT -5
I've implemented stops on all trades- Fortunately, the market is benign, and so I am comfortable with a wider stop- but cognizant of that early sign of weakness- I had just entered ITA ,
it had broke to a new high- with momentum- notice the wide gap between the 4 & 10 ema- It had just a single red bar , that did not close under the fast 4 ema- but it potentially threatened to drop below my entry- so i put a tight stop under the low and was taken out .
The trend is still intact and to the upside, but today's move pulled back and "filled" the gap- also closing below the prior high it had overcome 2 days earlier. I was anticipating a move to go higher and extend the trend- The 1st warning was Thursday where Price made a new high but closed a bit lower from the open. This small retracement may hold and go back from here - filling a gap at a prior attempted move higher should shake out any weak holders - I think the macro view should be towards continued bullishness- but I haven't listened to any political/budget news that would unfavorably affect the sector.
AAON moved higher after almost hitting my stop-by pennies- Today i added AAOI and it lost the opening momentum ; my averaged cost is $51.51. and I'll have to watch this one without setting a tight stop- $47 range is the lows of the recent base.... That makes an ugly higher risk wider area to contemplate possible volatility- Had the move closed positively higher, I would have $48 as a comfortable disaster stop- but this action is indecisive
|
|
|
|
Post by sd on May 6, 2017 7:38:29 GMT -5
|
|
|
|
Post by sd on May 9, 2017 11:53:53 GMT -5
Stockcharts.com is offering a free 1 month trial- Personally, I have an "extra" membership- but one could get a basic -and just access the site for that free month....
Reason I mention this is members get access to some good members only material-
I believe I posted all of this some time ago- but I'll do it again .
Arthur Hill has a number of articles- on systematic trading and testing-
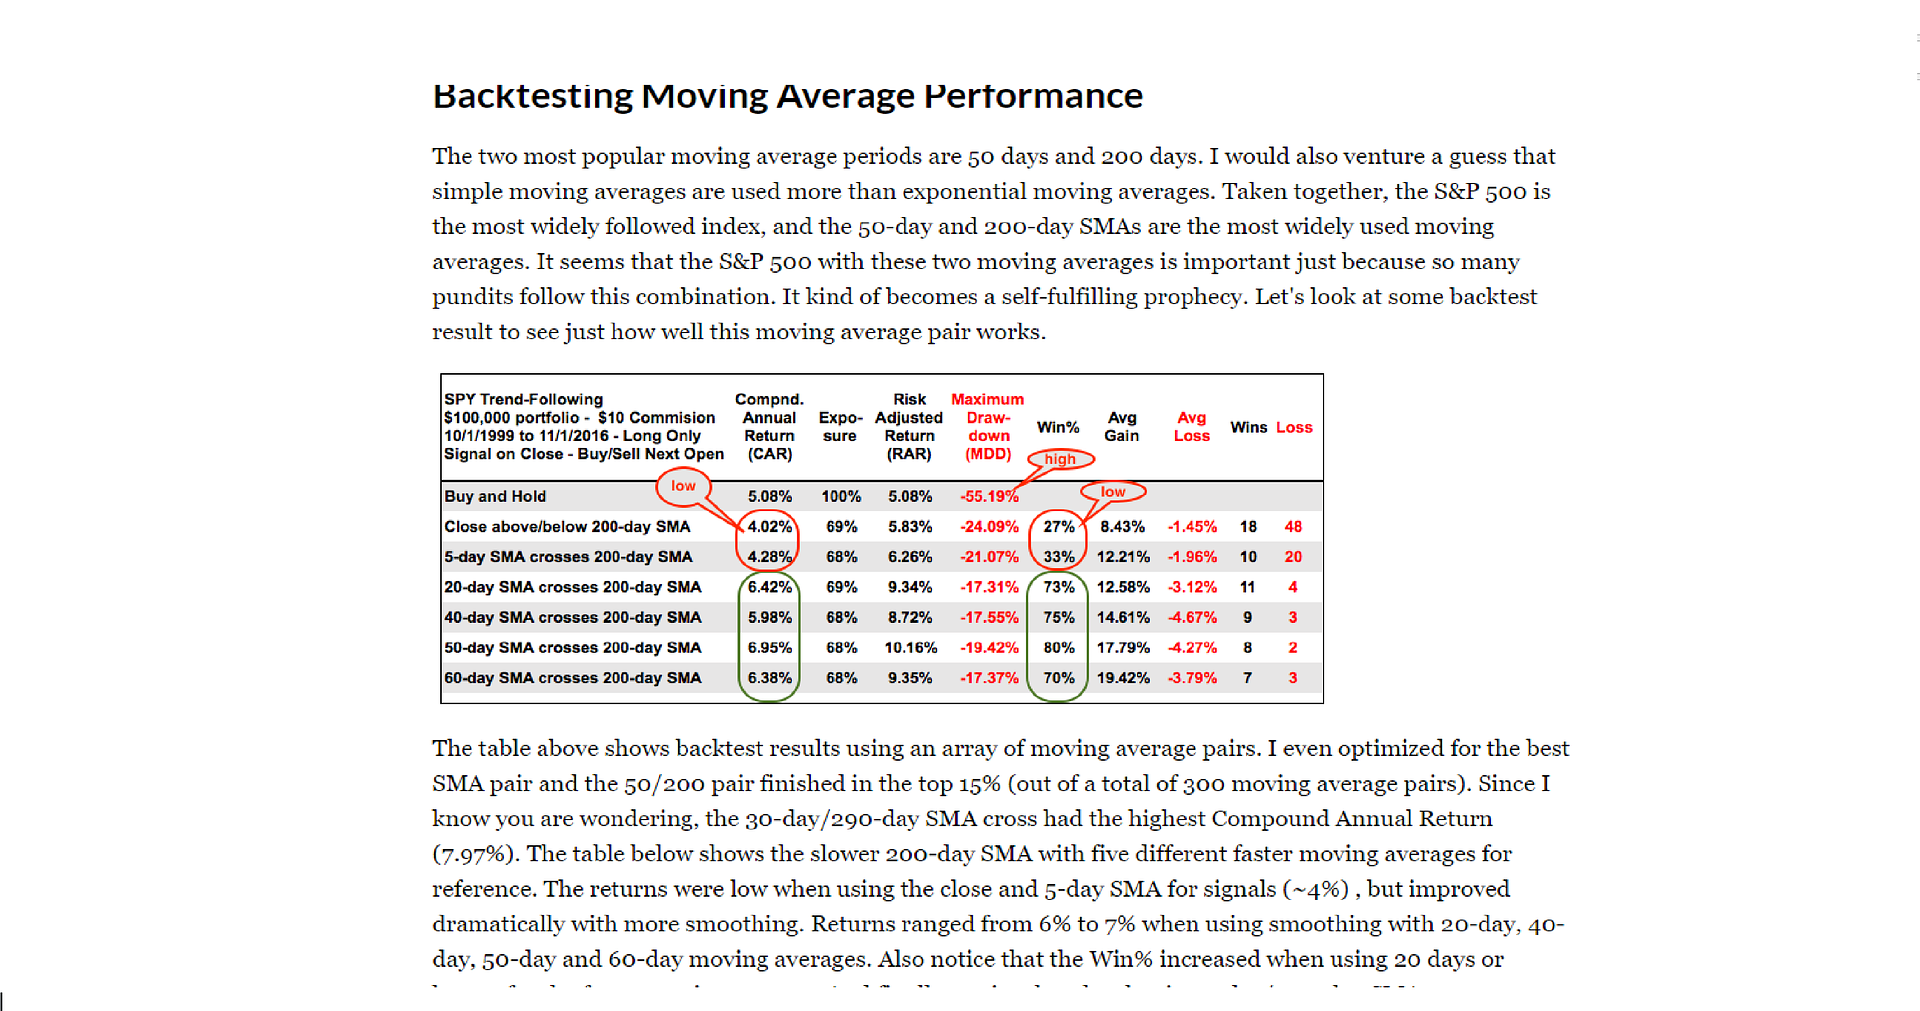
This excerpt I am posting is a table comparing results of Buy and Hold- Spy and then using some moving average crossovers to enter and exit-
His test results would indicate that having a set of rules to enter and exit just using moving average crossovers improved the results compared to buy and Hold.
Interestingly enough, the 5/200 crossover had the poorest results while the 50/200 results appeared to be much better-vs Buy and Hold gains of just 5.08% with a 80% win rate.
And only 10 trades total. Average win 17.79%, avg loss -4.27% drawdown 19.42% net gain avg 10.16% double that of Buy and Hold.
On the fast end
a 5/200 cross had 30 trades- 10 winners, 20 losers, avg gain 12.21%, with losses under 2%
In other articles on system trading , he does different comparisoms using different criteria-
Point is, if one chooses to access stockcharts for a trial, one could access the members page and get some trading ideas from the various contributors.
Short term trading is certainly different from long term trading- Don't see how I will get accustomed to viewing a 50/200 moving average and realizing how much profit was given up to that point...So that may not be what I am comfortable with considering later on.
And results that work for backtests on specific indices may not perform the same in the future- or work for another index or stock-
|
|


