|
|
Post by sd on Jan 3, 2017 20:59:53 GMT -5
Well, I was trying to be Witty- I know- my wife tells me i can't carry a tune, but i try to sing along anyways...
Allow me to try to interject a spot of Humor-
The Title was supposed to be "Trader Seeking long term relationship with a Stock that likes to Trend" - something you might find in the personals section of Craigslist? HMMM but I'm only allowed so many spaces....so the Thread title is what it is....
A friend has asked me about the trades i made in NVDA in December- i added into the position on 3 occasions- as price continued to show upside momentum- and i exited on what i called unsustainable momentum- and that was very timely - in the relative short term-last week. Can i repeat that in multiple trades in 2017? Will i be able to time going back into NVDA once it makes a turn ? Or- as this bull market has ingrained- just Hold long enough and you will be made Whole- eventually-
Short term Swing trading offers a great opportunity to capture segments of up/down moves and controls the possible losses with appropriate stops-
Each and every trade deserves to have an identifiable stop-loss when the order to Buy or Sell is placed. Take the emotion out of it- Position sizing dictates how large a potential loss may be- and it should be mentioned that if one has multiple positions in market correlated stocks, they will all likely decline with the market, meaning 5 positions with a 2% loss could be a portfolio loss of 10% on a single down day or week. Something to be aware of-
Too tight an Industry group focus may offer larger gains, and also larger losses.
The Investment Race is starting this year- I think it offers a great balance to the weekly horse race- and should be applicable to anyone with a dime in IRA investments. Hopefully, that is everyone that may read this-
With limited investment resources, we can invest X amount of dollars into 1 idea- 100% and take a gamble- Buy TSLA - or a biotech- or AAPL-or GOOG-
With some common sense, we know we cannot foretell the future , and we can spread the Risk among multiple positions- multiple stocks are very Risky IMO- or multiple ETF's- which greatly reduces the individual stock risk- but we still have to get the sector right.
A goal of mine this year is to gain a better understanding of the market environment, and sectors coming into favor, and those going out of favor- This takes some time -
i've mixed up my present positions, and - my goal is to hold for a longer term- as long as the trend is still in my favor-
Getting back to the question of Why i add into a trade- Because my initial smaller Entry is protected by the price movement, the trend is up, and the momentum/velocity appears to be favoring the trade. In the final analysis, I would ideally end up with 5 trending full positions, and hold them for weeks or longer..... gradually relaxing the proximity of the stop if the trades prove themselves.
I will be adding into T, and EW tomorrow , as both have moved higher out of recent bases in the uptrend.This is an opportune time to Add into a longer term position, as there is an established base just below the breakout- If the breakout retests back through the prior base, and goes lower- there is indeed a problem- There is something to be said for trading the slower and steadier.....
|
|
|
|
Post by blygh on Jan 5, 2017 17:28:58 GMT -5
I can appreciate what you say. I have held IBM since 1979 - to my regret - assuming that technology was the wave of the future -which it was and is - Big Blue is just not part of it. I have held Microsoft since 1988. What I should have held since 1992 is EMC which was up 88,000% from 1988 to 2000. I sold it for much smaller profits.
It is all kind of like a Biotech company with a block buster drug. The price rockets up. Then a competitor come up with something better or the first drug is found to have dangerous side effects (remember "Phen-phen" ?). A new development can destroy a stock's value despite every other indication. Fracking brought down big oil and gas. Criminal indictments destroyed Enron. Patent law suits won and loss can have enormous effects on valuations.
I mentioned this before on this forum. I did an MBA in the 1990's. In one course on computer simulation, I simulated expected returns following an investment strategy which changed 10% of allocations from mature stocks to growth stocks to bonds to money market funds based upon price changes of 2 standard deviations ("buy low" - i.e when prices in e.g. growth stocks fell 2 SD from a MACD trend - "sell high" when a price was 2 SD above its MACD ). This strategy was tested against a buy and hold strategy. After 50,000 runs - "Buy and Hold" won hands down.
My long term holdings now include TSLA VZ T BRK.B IBM MSFT XON (and a few losers that have fallen so much that they are not worth selling - at least not until I need to off set taxable gains with losses) . Long term ETFs include FBT ITA IYR MOO
We will see
Blygh
|
|
|
|
Post by sd on Jan 6, 2017 10:30:56 GMT -5
I recall your earlier posting of the backtest performed that found that Buy and hold was the best course of action vs the parameters of shifting asset allocations based on technicals-
"I mentioned this before on this forum. I did an MBA in the 1990's. In one course on computer simulation, I simulated expected returns following an investment strategy which changed 10% of allocations from mature stocks to growth stocks to bonds to money market funds based upon price changes of 2 standard deviations ("buy low" - i.e when prices in e.g. growth stocks fell 2 SD from a MACD trend - "sell high" when a price was 2 SD above its MACD ). This strategy was tested against a buy and hold strategy. After 50,000 runs - "Buy and Hold" won hands down. "
"
I would agree with some of what you said- The average retail trader/investor that tries to time the market reportedly only get's 1/2 the results of those long the Buy and hold-if that. As someone that got burned pretty good in the Tech crash, it affected my bias when it gave me that life lesson about investing- including the decision to "Hold" SUNW and not trade-(That was called Sun Microsystems- no longer listed as SUNW) and see another additional 50% decline after a few years of Holding. That ticker now belongs to a new company.
During the 1980's and early 90's , we had a strong growth market-(I wasn't in it then) and perhaps if you ran the same or a similar test today, or between 2000, and 2009- the results would have been different?
I think you make an excellent point though- that just because you bought and held a stock- IBM- does not guarantee you success.Although IBM was a market leader, technology brings change- as you noted- and with change, some companies- or entire industries can fall out of favor for years, or become totally irrelevant in the new world of tomorrow-
We see short term sector rotation swings, Note Healthcare and Biotech were leading sectors for 4 years, +_400% gain in an index is outstanding, but now those same favorites have come under fire and are out of favor-
Choosing any one individual stock as a long term position creates a high level of Risk- Certainly, there is the potential for outsized gains if successful,but also outsized losses if there is not an exit strategy based on how the rest of the market chooses to view that individual company -
The question becomes - what dictates selling a stock one chooses to believe in?
With today's new "Smart" etf's and rebalancing within the various holdings that no longer meet the criteria, one has a better opportunity of holding a diversified portfolio for years, and through periodic rebalancing, capture a good portion of market upside in areas that may outperform the Spy, and reallocate - capturing some of the gains- and reallocate those profits to becoming a value buyer-
Keeping in mind that having greater or lesser amounts of cash as an option is indeed a position in itself- Markets correct periods of excess- and it could be argued that we are now in such a period in longevity and higher PE's/valuations- but this could continue for another 5 years- and so, on e could stay in cash- thinking it will correct any day now- or one could step in and have a plan as to how to determine if a 5%, 10% 15% 20% correction is too late to exit now.... I think the Investment race will provide a good mix of investments that i would like to see if a Technical exit- on a weekly chart- could provide a exit signal and a reentry- and how do you eliminate the n on-trending periods of weeks or months in a sideways condition?
You've given me ample food for thought- just dropping this note mid morning at work-Thanks for the Input!
Snow coming this weekend! Might catch up on some of those good intentions- like charts for all the trades this past year weekly and daily for me to print out and analyze as to which were "Good" trades- but profits and losers.
|
|
|
|
Post by sd on Jan 6, 2017 18:23:03 GMT -5
With the afternoon off early, and some cash freed up as NVDA and some regional banks had all hit tightened stops, I made a few added purchases- I reviewed the list of the Investment Horse picks, and there are a number there i could have selected from. I did choose MON as it broke 3% higher out of a month long base.
Looking at the semi sector- NVDA looked indecisive, and i chose both CRUS, and XLNX as they are both attempting to move higher in what i term is a 1st reversal- attempt- that often is early- but it gives a base floor for price to trade within - Have to see. I had sold the larger portion of T on a raised stop $41.80, and have tightened the stop on the remainder - The position will remain a profitable trade if this remaining portion stops out.
As i just added into the position, it increased my average cost basis to $40.96 . Price was basing sideways, and the expectation was that it broke higher Jan 3- and although I don't usually concern myself with volume- it was a good volume move and closed the day near the very Top of it's range. The next day there was no follow through, a lower close than open, and the following day a lower day yet back in the prior range with a penetrating low that prompted the raised stop . This protected the majority of the trade with a larger gain, and this 2nd stop should also net a profit should price not rally higher Monday.
I dusted off a moldy Scottrade account, (Can't stand paying a $7 commission-) and added some prospective trades aside from the IB account-
TSLA, trending higher the past month, weekly & daily both up-
FB- After 2 months of a sideways channel, breaking out this week and closing higher. 114 would be the low end of the channel on the weekly, but I'll follow this on a daily most likely- Did buy some for a seperate longer hold that the weekly chart may be used for.
GKOS- (medical instruments) saucer pullback on the weekly, this week testing lower the recent uptrend and closing higher-
VRTU- gap move breaking out of the recent range- Tech -I-T
SND- This is a recent come to market- Industrial metals- sounds ideal for an industrial recovery- 8 higher closes out of the past 9 weeks-
KRO- Specialty chemicals- Breaking out from a 6 week base this week
Of these entries made today, CRUS and XLNX - while looking better than NVDA- are both early entries in the recent decline- the chip sector has seen-
I'm less optimistic about each of these because i usually wait to see a better turn- and ema upcross- I would qualify these 2 as premature entries.
While the markets appear to be still trying to rally higher- My bias says we've rallied too far etc- but my bias has often been proved incorrect by the market. Taking a shorter term approach, and not an investment approach- means that i'm willing to step into a trade- but also desiring to protect the downside . So, if momentum goes against me - usually noticeable by a close below a fast moving average- that's as much leeway as i want to normally allow- overriding my desire to hold a position for weeks if it behaves- That close below the fast ema - is not a sell necessarily, but a warning to raise the stop to protect some profits- or that my recent entry is not behaving as hoped for-That may be putting the stop just under the low of the day.
Of course, this will vary depending on the time frame i view- While i have not done my post mortem on this past year's trades, my gut tells me that cutting a losing trade quickly- and trying to allow a winning trade to continue- will be my goal this year-And- not to get suckered into counter trend trades thinking the sky is falling unless it really is-
|
|
|
|
Post by sd on Jan 7, 2017 12:37:27 GMT -5
On Backtesting- Blygh had mentioned that in the 1990s he had done backtesting that confirmed that a Buy and Hold approach outperformed a technical method to signal exit and reentry. Arthur Hill did backtesting back to 1950, and also concluded that up through 2000, the buy and hold approach had the best overall annual average return- He compared results with 3 other testing methods- A Jan entry, A Feb entry, and a moving average crossover entry/exit using the 50/200 ema.
It needs to be noted that total return was not the only category compared- The win-loss ratio, the Max drawdown, the Risk adjusted return results- Average gain vs average loss-
I'm mostly interested in comparing the moving average crossover- 50/200 - because it provides a slightly smaller average return about 1% less in the 1950-2000 era, but take a note of the Higher Risk adjusted return, significantly lower drawdown 33% vs 52%,
the SpyBuy and Hold Avg gain + 16.64% Loss -12.30% drawdown -52% SPY Buy and hold Risk Adjusted return 7.55
The 50/200 cross Avg gain + 26.58% Loss -4.74 drawdown -33% 50/200 Risk Adjusted return 9.42
Total Return is not the entire story that an Investor needs to consider - The 50/200 cross strategy significantly reduced the drawdown and added a measure of stop-loss safety to the portfolio during this period, Reduced the overall Risk, also capturing higher % wins and lower % losses- This is worth noting, because it adds a measure of control over the investment based on trending components. (moving averages) .
From Stockcharts.com - Arthur Hill
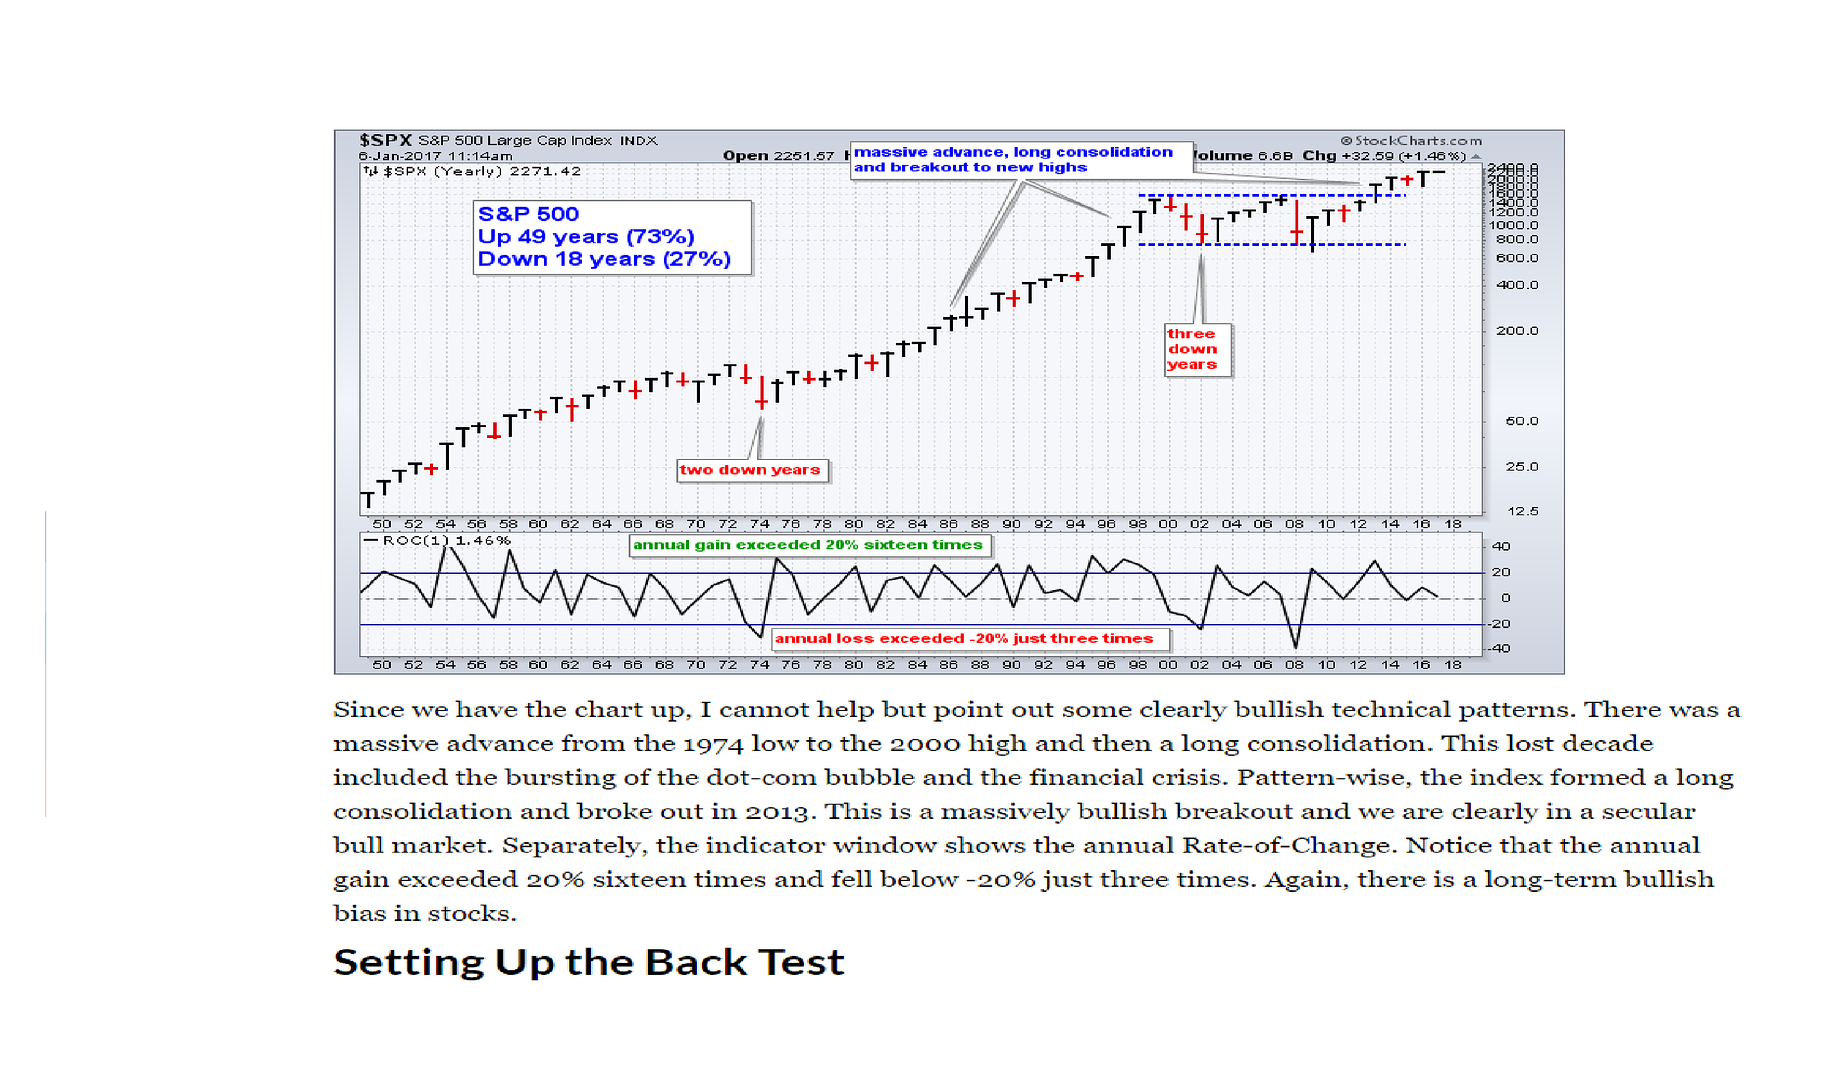
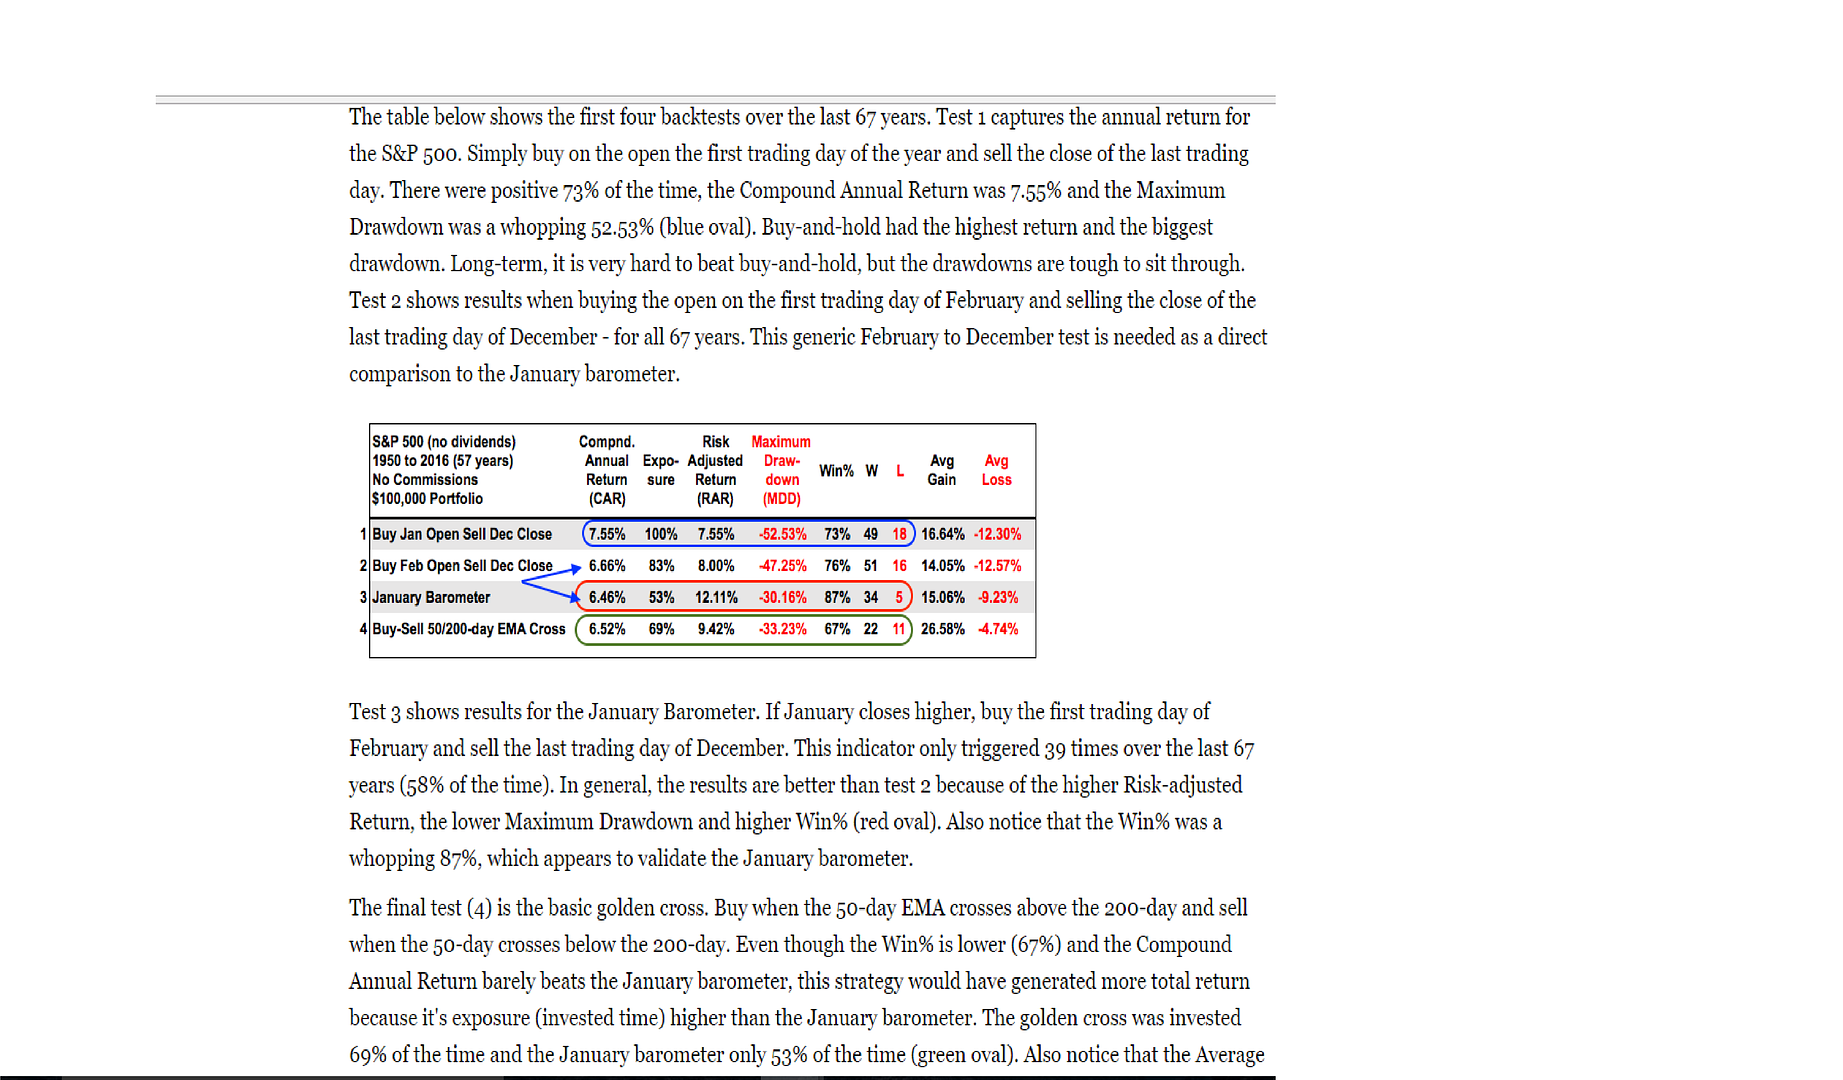
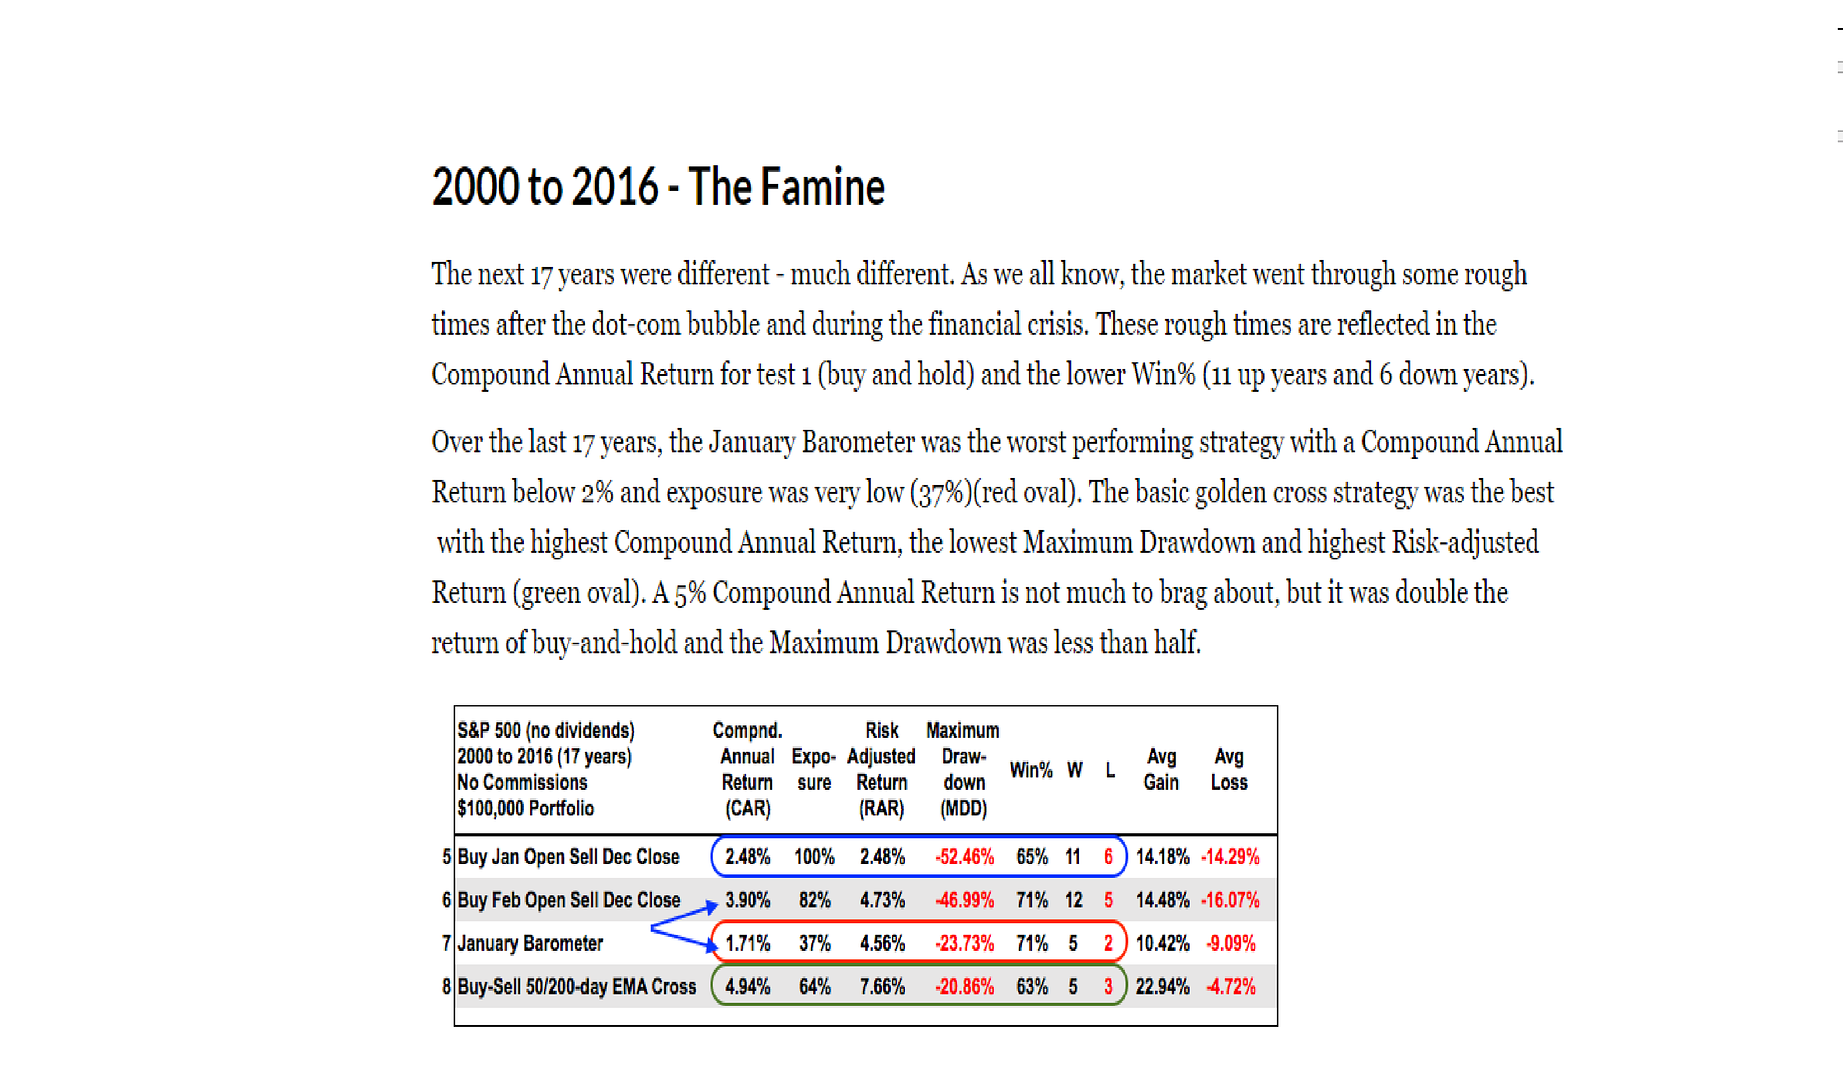
From 1999 to present day- the results are much different -lower average returns for the Buy and hold, higher drawdown, and the crossover strategy achieves higher returns with reduced Risk.
Consider that this is not a swing trading strategy, but is best suited for consideration that TA (technical analysis) variables may be an asset in improving the Risk- and possibly the net results in an Investment strategy-
Also consider that a typical Investment portfolio usually has a certain % allocated to Bonds to stabilize the portfolio - But in a low bond return environment, having an exit and entry strategy based on trend with the stock components might realize a better Risk return with an exit strategy.
There are certainly a lot of potential variables that could be tested- Different moving average crossovers, Exit on one, reentry on another- adding in another TA component - Stochastic indicator- MACD , PPO ......Earlier entry on a faster signal with a partial position, adding more to the position as
price crosses another threshold.
I will copy this over to the investment Race thread
Edit -
I spent additional time today following some of Arthur Hills other backtesting models and variations-interesting reading and results did not just check The survivors- but also backtest against the actual stock components that existed at that time that are no longer with us- Either merged- or dropped from the Index... This is a members-only area, but if anyone is interested, a monthly access is not very expensive to get access to an expanded technical resource by professionals
The goal for a longer term Investment portfolio - is also largely similar to a shorter term strategy- the common theme being to avoid periods of decline and reenter when a period of trend favors the trade. An Investment position will allow greater price fluctuations- than a trade- but the goal in both is to have some measurement criteria that tells when the trend no longer favors the trade, and the ability to take action. Exiting and Being out of a position when the Trend has turned South -protects the trader's assets-Yes, it also means that you won't ride the trade to the bottom, nor will you re-enter at the bottom-
But, you miss the majority of a large downside move,because you are required to exit, and capture a good portion of an uptrending move- because you are required to reenter. That is -if you have the discipline to adhere to a Rules based approach....
Human emotions often interfere with following a systematic approach- and one or two whipsaws undermine the validity and benefit of such an approach-at least for the individual trader's belief in that system. There is no holy Grail, no system that will guarantee each trade decision will not be a losing whipsaw- However, having a systematic approach allows one to evaluate- over time- the benefits and the possible negatives over a longer period- and multiple trade signals....
My belief that TA can be a real asset in understanding and evaluating a trade decision - is often compromised by the human operator's emotion and discretionary interpretation. Yes, TA signals alone can give false indications- but should be included as one part in the evaluation; as one analyzes how a trade is entered, held, and exited.
|
|
|
|
Post by sd on Jan 7, 2017 22:17:34 GMT -5
Getting back to some basic TA as it may be applied in following one's swing trades with a daily chart.
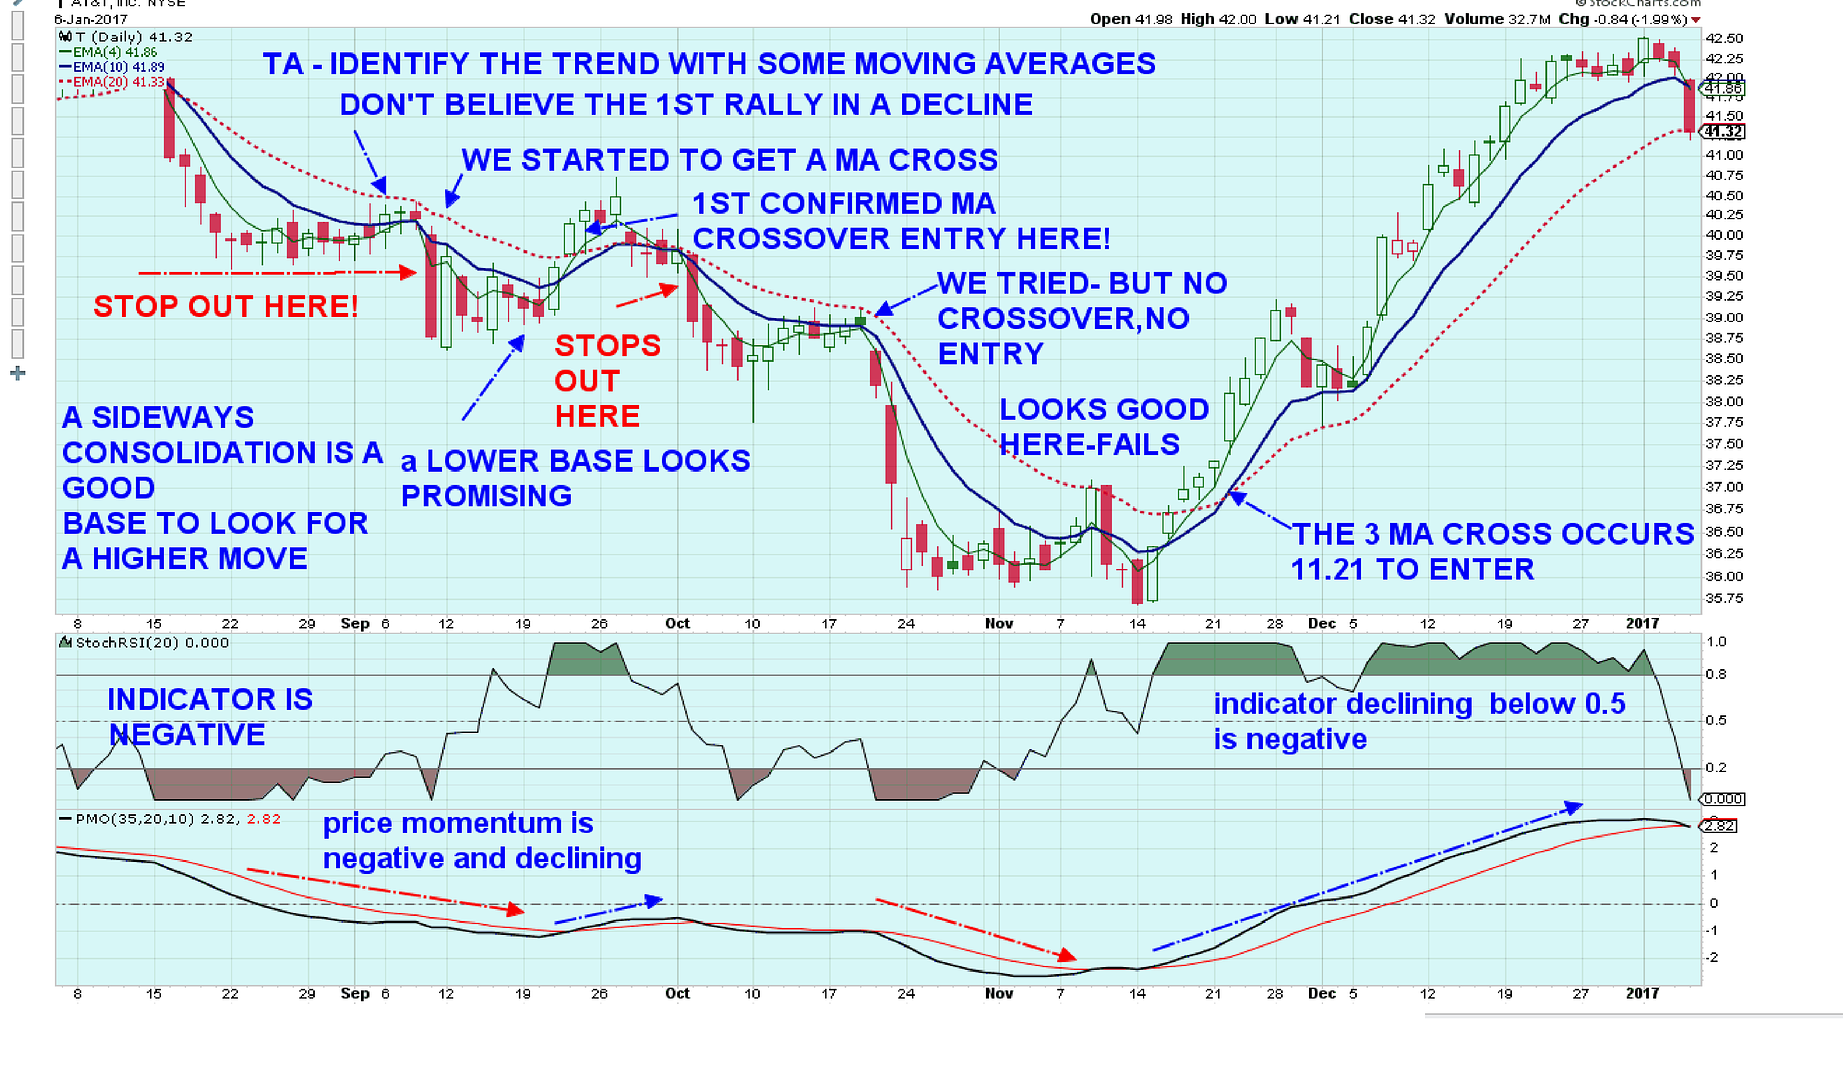
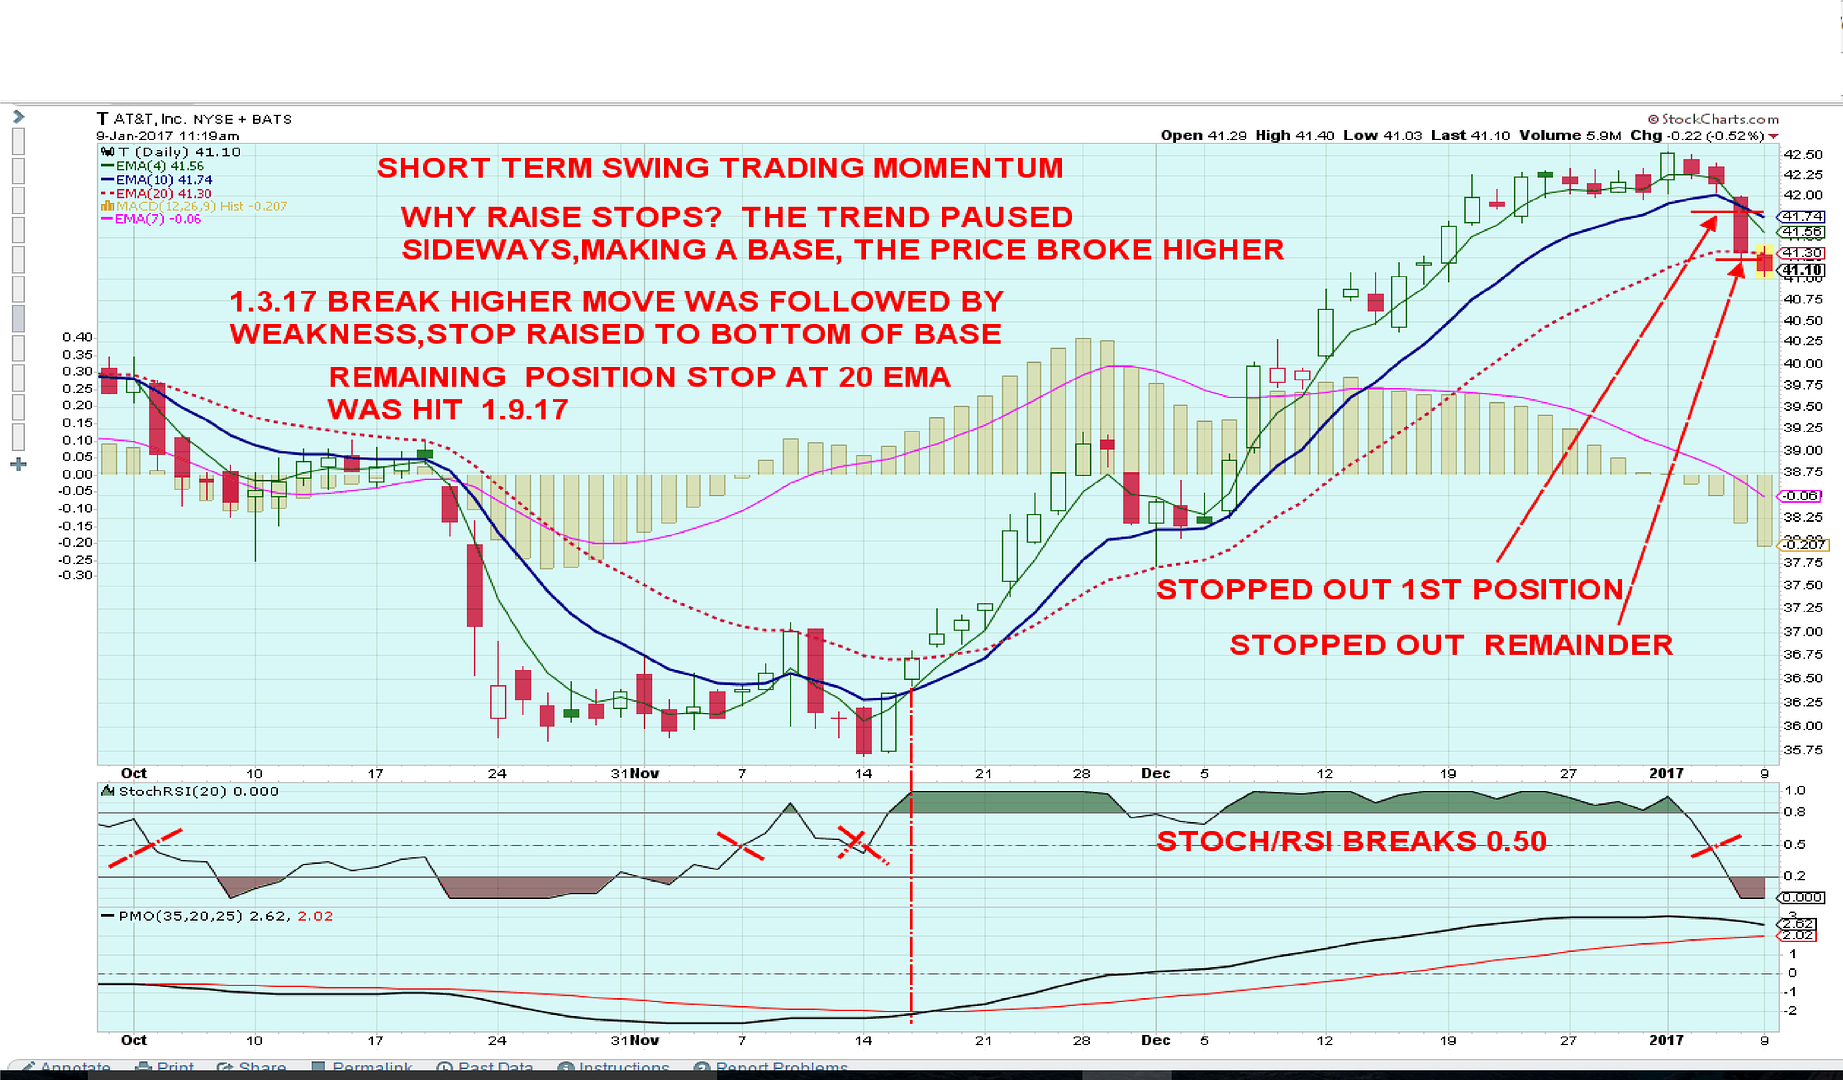
I'll use the example of T - along with some indicators- and the chart I have annotated gets somewhat cluttered with notes-
How can technical analysis (TA going forward) help us in our trading?
It can help define the trend- Is Price above the moving averages or below? If Below, and the moving averages are pointing Down, it is likely not an appropriate time to assume a long position- even though Price is cheaper.
In this daily chart, I use Fast ema time frames - If i was taking an Investment approach, I would consider slower time frames, or Weekly charts.
Note that I have 3 moving averages on the chart- a 4,10,20- all should be considered "Fast" - intending to note when relatively minor pauses in a trend are changing.
This approach of applying Faster ema's as a signal of price momentum is appropriate for swing traders- but perhaps not position traders- They would choose somewhat slower Ema's and not want to react to the minor fluctuations the faster ema settings give for a Swing trader-
A "Position trader" might use a 20, 50, 100 ema or sma - which would allow price to make wider moves before a reaction is called for.
in addition on this daily chart i have a couple of Indicators- A combined Stoch-RSI - essentially a reading above the .50 line is positive and in the "oversold' is desireable-
While a declining value below the .50 line indicates price weakness and a negative indicator means do not consider any long position entry at all.
This use of an indicator can be beneficial, because price can have a bullish day in a decline- and an anxious trader may want to assume this would be a good entry. Without the entry being confirmed by a break out of the lower Red oversold area, an entry is not to be considered.
This can be a cautionary "RULE" for one's trading considerations.....It won't allow you to make a momentary discretionary intraday -spur oif the moment- jump in here.... throw caution to the wind... trading decision.
This is particularly important in periods of decline when the psychology of the Trader realizes that they may be capturing a value- or so they think- because Price is now lower-and that propels them to jump in early-Not realizing that price may potentially decline much further to become the 'value' the market eventually assigns it.
The Stoch-RSI responds to price movement- as does the other indicator on this chart- the PMO- Price movement oscillator- They follow the price action-
and a bullish move of uptrending price will cause these to react positively- as can be seen on the T chart when price moves and closes above all 3 moving averages, the indicators are positive , yet price fails to gain momentum and price then downtrends further-
This is not a Flaw in the indicator- The TA indicator follows what the price action tells it- and displays it as such- It is up to the individual trader to realize that their responsibility is to not blindly follow an indicator- but to make the assessment of what the price action and indicator are suggesting- make an entry if called for- and Set an appropriate Stop loss in the event that price does not continue in the desired direction.
Traders need to understand that there is "persistence" in strong trends- that allow counter trend signals to happen- but the overwhelming trend direction often takes back control- This also suggests that one should review the longer time frame- Weekly charts- to define the predominant trend-
What is not shown on this shorter term Daily chart off T is that it is rebounding from a prior resistance level seen on a longer time frame.
Applying the shorter time frame chart , and entering late in this uptrend allowed me to capture some small % gain and exit - all in a few days-
T should become a future watchlist - where i could potentially make a reentry on any decline that turns back higher- referring to price closing above the upturning ema's.
|
|
|
|
Post by sd on Jan 9, 2017 13:31:12 GMT -5
The remaining T position stopped out on the lower stop- I had used the slower ema for that portion- smaller profit,-the intent was to give the Price a chance to go back higher- The question becomes- Where does T go from here? It has some downside perhaps to the $39 level, or it may turn back at any point.
price action will suggest what that is. While this chart illustrates my short term focus- using price and some TA- particularly where price is relative to the moving averages-
For anyone interested- my 2 bit take on TA's usefullness viewing this chart.
In Oct-1-19 price declined, made a saucer type base and looked ready to push-(breakout) back higher.Although price closed back above the fast green ema, and came close to making a cross above the blue 10 ema, it never quite made it. On the 19th, it opened higher, closed lower, and anyone with a position would have been prudent to have a stop-loss near the $38-$38.50 range under the prior base.
On the following day it dropped -opened on a gap down, and closed even lower, followed by a second hard sell -off day. On sell day 3, it gapped open lower, but closed higher on the day, and this became the start of a sideways consolidation. Note that the drop was over 10% over 4 days.
Take a moment to glance at the Stoch/RSI indicator in the window below the chart, and the :PMO indicator below that- Both had gone negative with the 2nd day of drop October 2. Stoch-RSI never got back above the 0.5 line for over a month- Nov 7, when it made a move above that base line-just a day ahead of the large bullish move on Nov 9. That move was a 1st rally attempt out of the base, and they often fail to hold. Had i been tracking the stock at that time- I likely would have had a Buy-stop $36.80 in anticipation of a possible breakout, and would have been caught in the trade. My stop-loss would have been $35.75 -under the low . On the next day, Price opened at the low of the range, penetrated a bit lower - and closed at the open- lower DOJI-
As an after-hours Trader, I would have been caught in this trade decline, and -If not stopped out on the doji day, I would have been caught on the sell-off on 10-14.
I have mentioned this before- and this is a good example - When price pushes below support, the buyer there is getting the stock as stops are executed-
When it rallies higher the next day- it is likely the smart money going long- Note, on the following day, price closed above the $36.50 level, bringing the fast moving average above the 10 ema.This upside cross- and price going above the recent high was certainly bullish, The Stoch-RSI moved above the 0.80 level (desireable) and turned green. The PMO (Price momentum) indicator also confirmed the Stoch/RSI- (Note that the PMO is not as reactive as the Stoch-RSI is due to the settings)
Price moved higher the following 7 days, each day closing above the fast 4 ema-
Now, understand that this is a VERY fast ema, and will closely follow small price moves.
Notice how the gap between the 4 and the 10 ema get wider- the MACD histogram (gold bars behind price) gets taller, the Stoch/Rsi stays green above 0.80, and the PMO widens above the red line- ALL IS WELL- except that nothing goes straight up for long, and momentum takes a pause-
Note that I was not in T at this time- using it as an example.
11-29 price made a higher open, but a lower close- resulting in the 1st red bar in 10 days.
An aggressive trader would have the option of considering to ignore a single red bar- or to consider tightening a stop-loss. A very aggressive stop- would be at the low of that red bar- or - the low of the prior bullish bar- or set the stop-loss at the fast ema, or the fast ema under the prior bullish bar.
A less aggressive trader desiring to allow the position room to run might choose the slower 10 ema - or 20 ema- The tight stop- 4 emaq would have been taken out at the open the next day as price opened with a gap lower, and then declined. That stop would have likely executed below the open $38.60 or so,
The following day, price spiked down lower, would have taken out the stop at $36.00 at the 10 ema (losing $.60 or -1.6% less than the tighter stop)
Note that the stop at the 20 ema was almost hit-by a few pennies- Had it been hit @ $37.70 vs the higher $38.60 would be a difference of $.90 or 2.38%
Note that during the pullback , the indicators showed the weakness- MACD Histogram started to step down lower, Stoch-RSI declined below the 0.80 but stayed above 0.50, and pmo- longer time frame stayed sloping up.
Selecting where to put a stop- and how tight to price it needs to be, is a matter of one's Fear and Greed- and where they entered into the trade-
Assuming one get's stopped out of the trade on that pullback , price based Dec 3,4,5, a normal continuation pullback, and resets the moving averages.
Note that a reentry would be Dec 6 or Dec 7 as price exceeded the prior high. One should be prepared to take a reentry if they are interested in staying with the position - Just because price stops out- if the trend resumes, get back in the saddle
Over the course of the next 15 days- 3 weeks- price continues to close above the fast ema. As the trend starts to slow, price bases sideways, and this is displayed as the fast moving average starts to get closer -gap closing with the 10 ema, MACD Histogram has been getting steadily shorter bars-note the declining slope of the moving average on the bars- , The Stoch-RSI is still above 0.80, but sloping smaller towards the line, and the PMO starts to get tighter as well and flattens.
This is normal basing action- If it went sideways long enough, the moving averages would converge and overlap - but price is to be considered in a consolidation.
The potential Signal here is that Price tries to break out higher 1-3-17, closes above the base high range (breaksout) but fails to get any follow through-
Reason enough that i raised my stop to the bottom of the range for the tight stop- and the second stop at the 20 ema.
As the Stoch-RSI breaks down, MACD histogram went below the 0 line the day following the breakout, and it accurately signaled the underlying weakness, lack of momentum.
While i think this is a good momentum approach for Swing trading, I also tried to present some of the ways that TA could potentially stay a trader from taking a too early entry- TA does not always work -but it may prove to be a good method to give a check to see what one desires to do- in both entry and exits. individuals should adjust indicators to suit their own style of trading- I usually use faster settings than the typical programmed time periods.
And- in terms of getting "defensive" in case you think the markets are overbought and over priced- switching to a faster chart may allow you to stay longer in the game- with the potential for reduced losses and tighter stops-
|
|
|
|
Post by sd on Jan 9, 2017 17:56:00 GMT -5
Blygh mentioned that he had held a market leader- IBM since the days it was a market leader-What many of us fail to to realize, is that today's leaders will fall out of favor and will likely be replaced by a newer technology....Interestingly enough, As technology evolves, the rate of change also increases-
So, back in the tech bubble days when I was 1st learning to trade- I now can look back and realize that -towards the end- I made one smart losing trade-
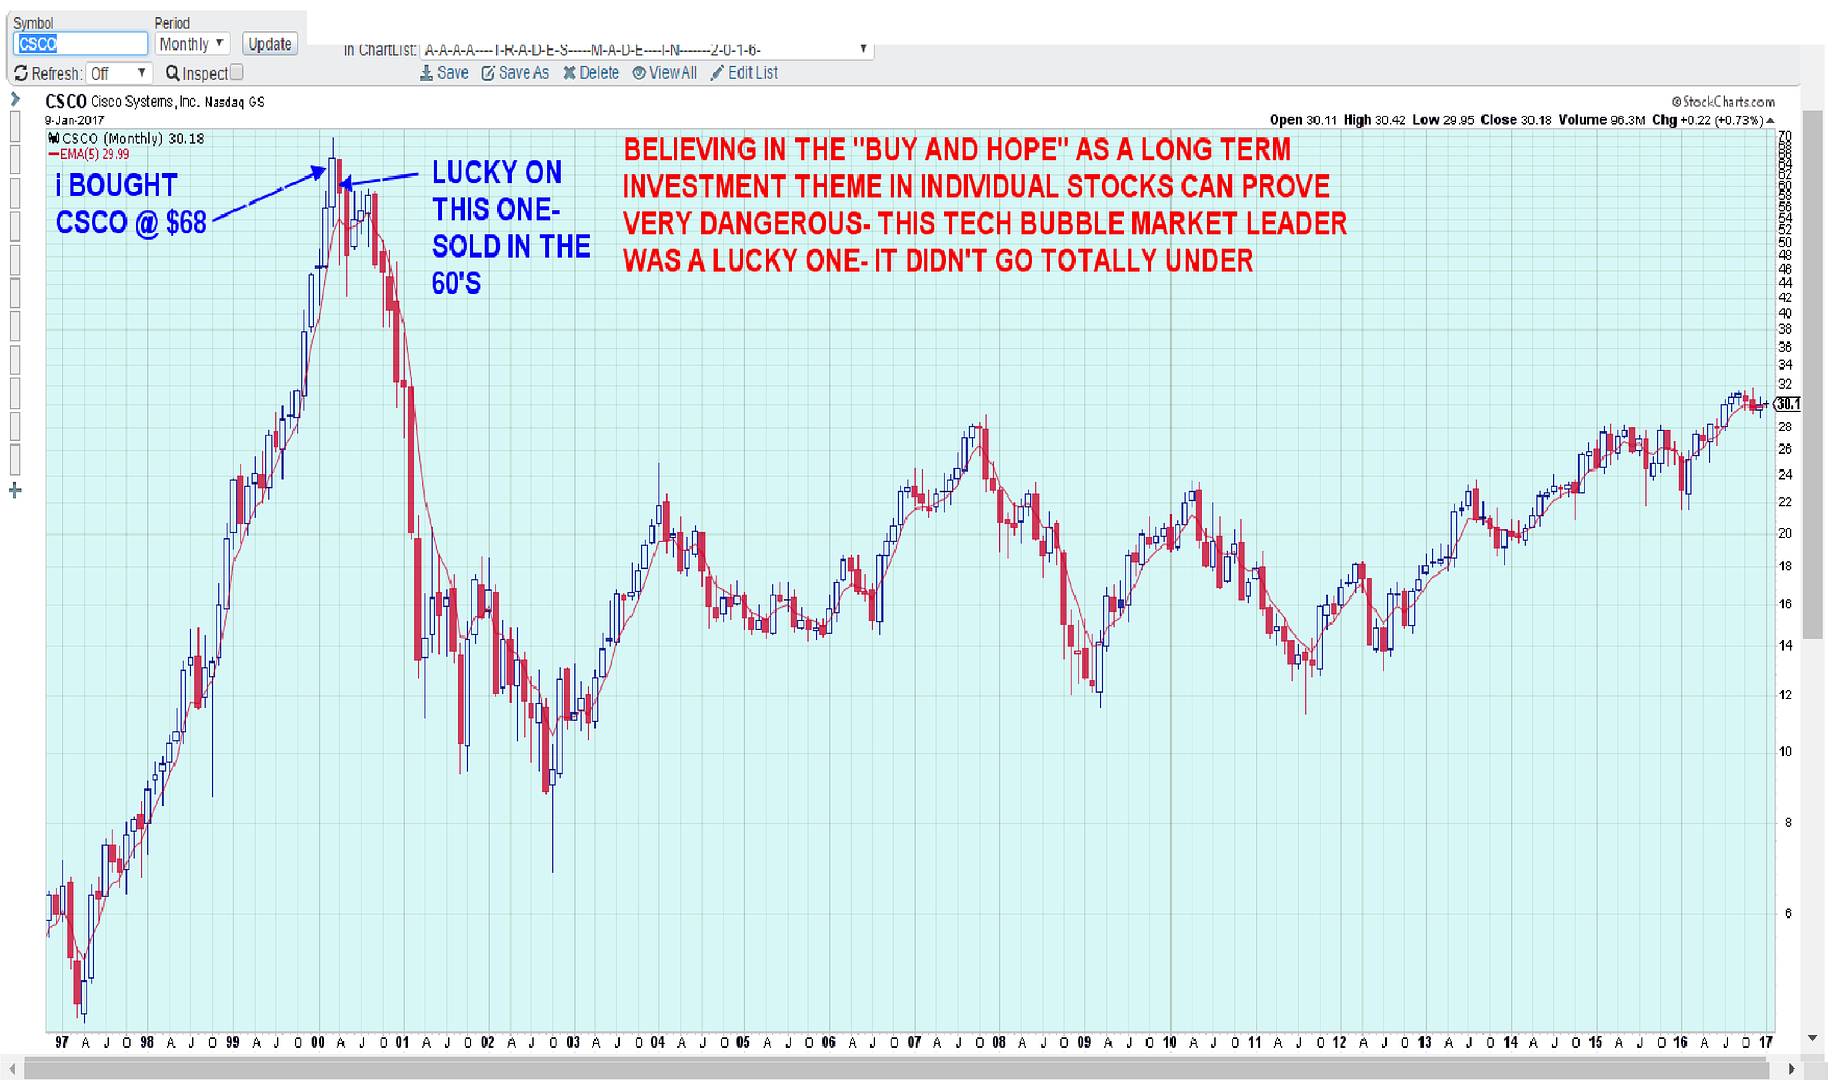
In CSCO- company leading the way with Internet hardware and connectivity- I think I bought it near $68- right near it's High, but sold it as it chopped around and then started to decline- I think I exited in the low to mid 60's- I recall that my boss continued to Hold it- and hold ,and hold....
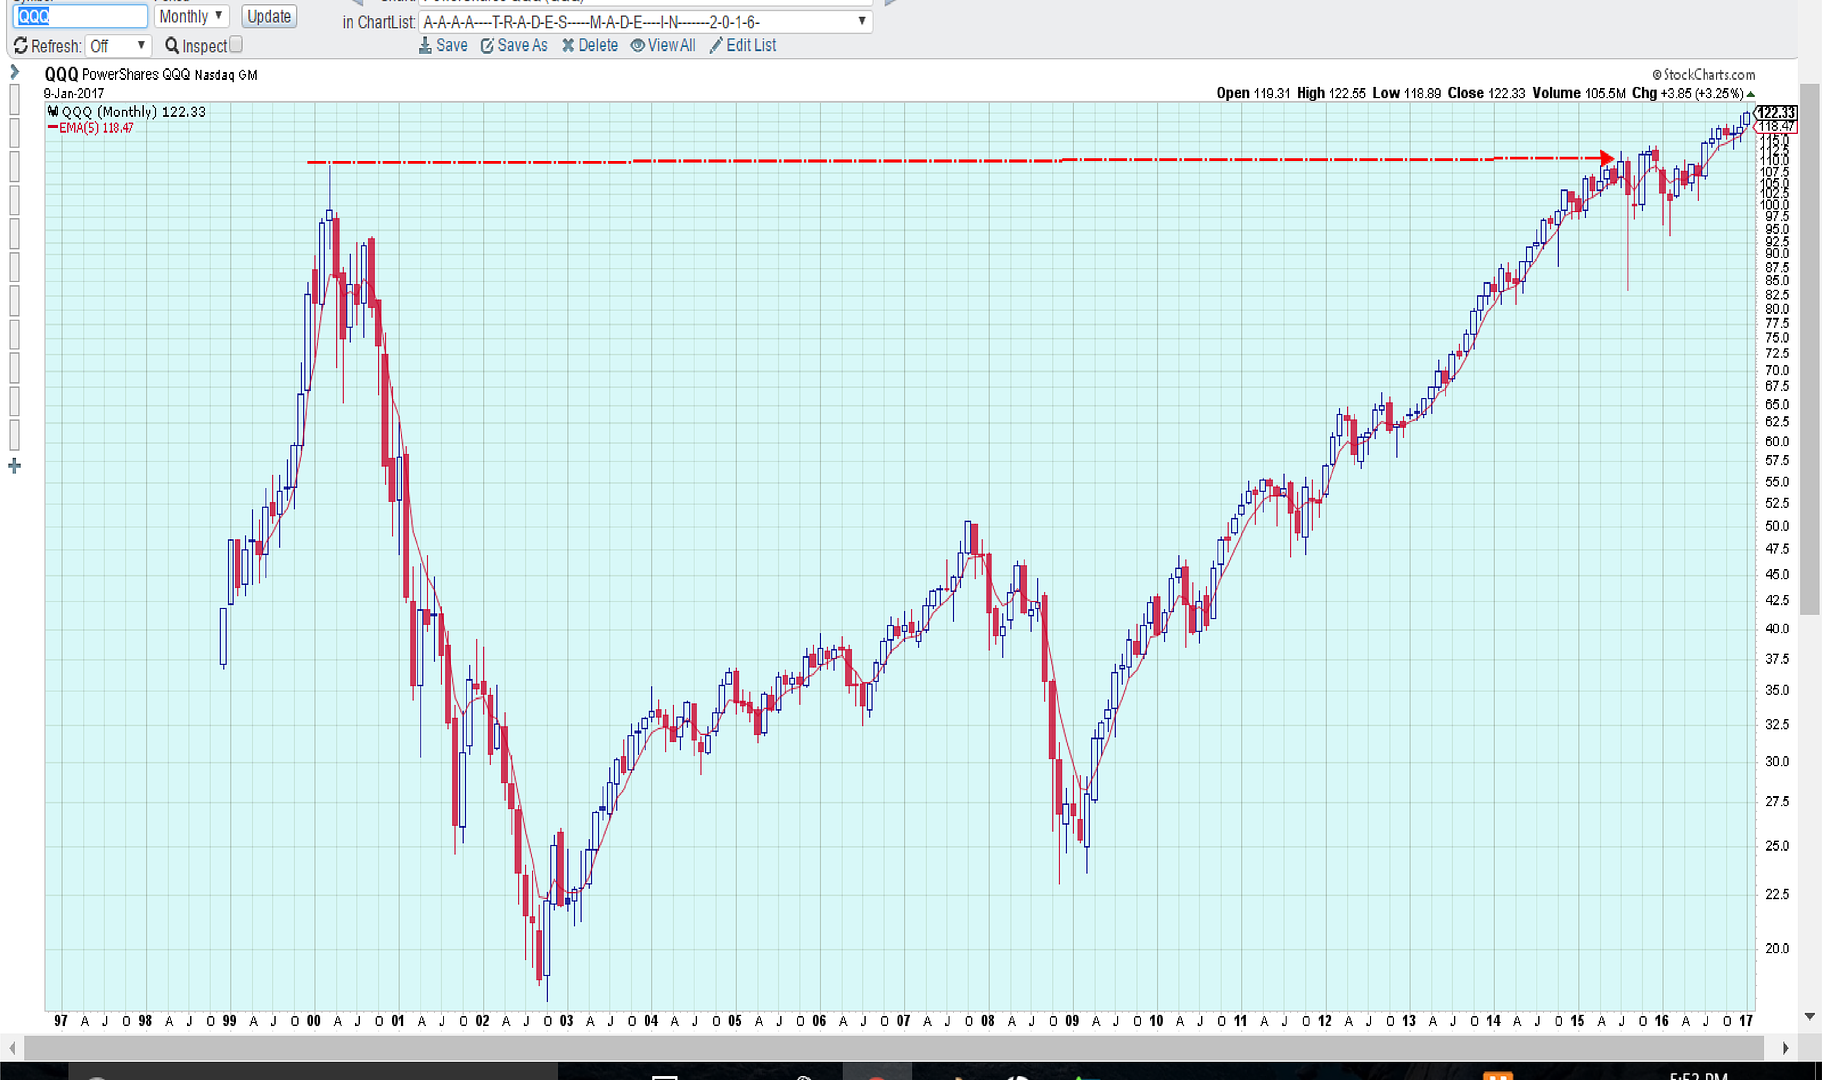
It took 15 years for the TECH sector to come back to where it was back in 2000.00 If you didn't have an exit plan when the Investment turned and started to decline- and believed that Buy and Hope was the best policy, that was dead money for that decade and a half.
This is an excellent example of sector rotation benefiting one area- Tech- and then tossing that out for years to come-
This also relates to an Investment portfolio, and how one intends to manage it over time- Owning a handful or two of individual stocks
would be extraordinarily risky, unless one has a stop-loss plan in effect. This subject belongs more on the Investment Board thread-but I'm intending to transfer my remaining company sponsored IRA investment assets to Vanguard and decide on an allocation model- and to determine a suitable plan to control losses- or to make entries. I will be using Vanguard commission free ETF's for most of that allocation where possible.
|
|
|
|
Post by sd on Jan 9, 2017 19:25:44 GMT -5
Repurchased NVDA today as it made a sharp turn higher- I had hoped to get it lower-
Looking at this one with a few charts- 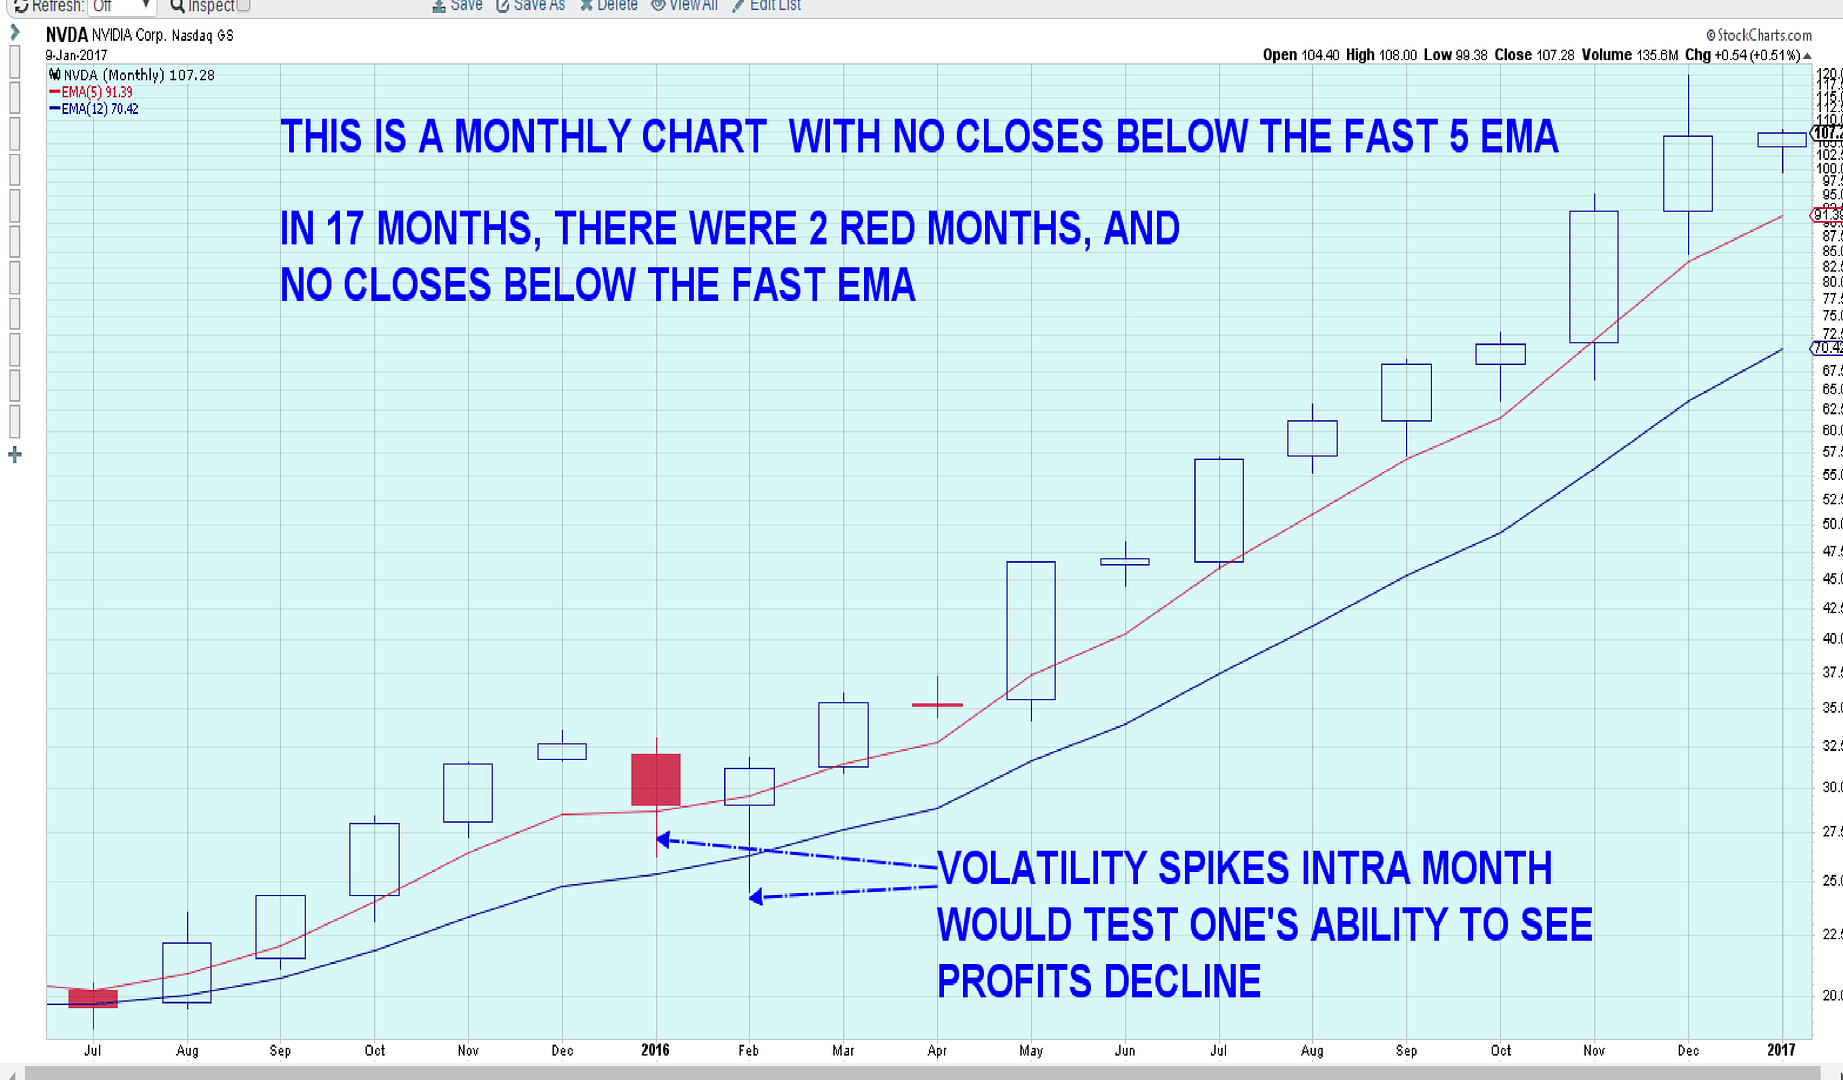 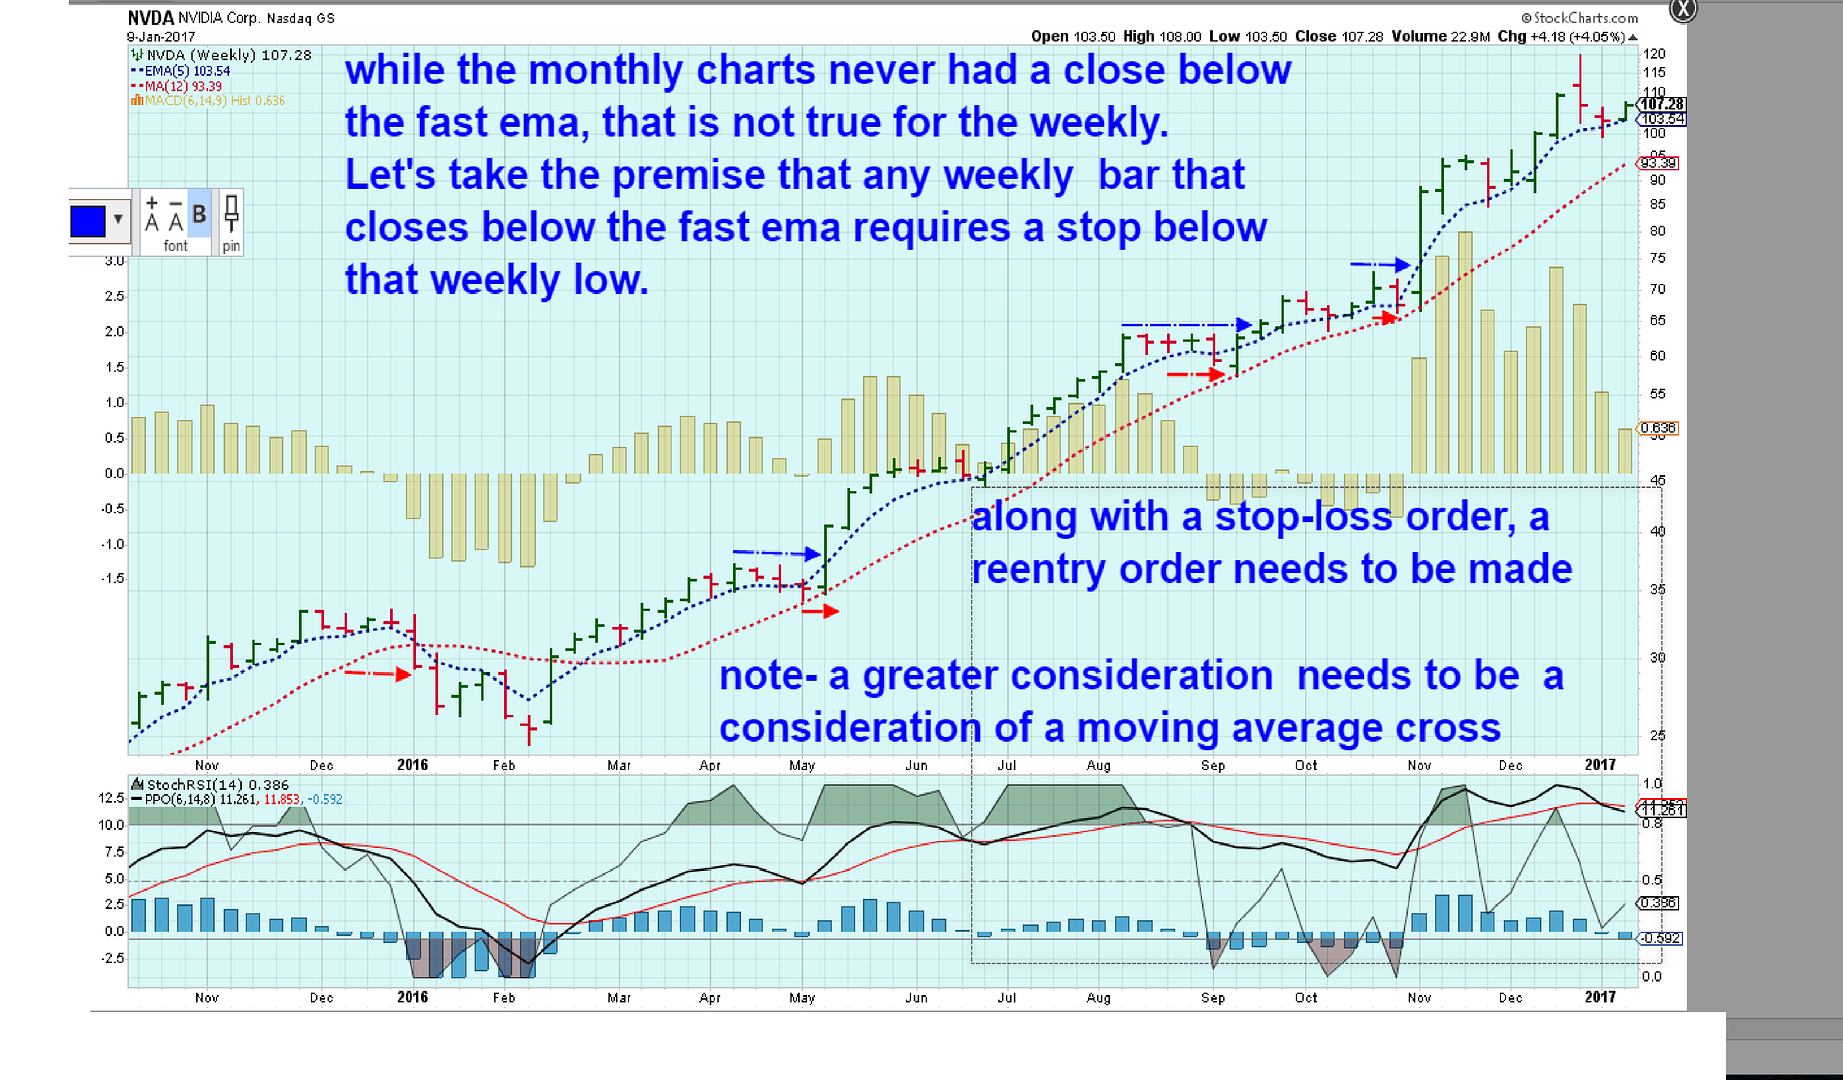 While the monthly appeared relatively behaved in relation to the moving averages, the Weekly not so much, with a few closes under the fast ema- The daily chart will be even less so accomodating- Note the numerical values of the 5 ema on the monthly, weekly, daily
|
|
|
|
Post by sd on Jan 11, 2017 21:47:11 GMT -5
NVDA stalled and did not follow through higher today- no time for that chart- but i have a full position in place and waiting to see if it breaks lower- I have another chart of T- up through today- and i am watching this as it declines- and planning a reentry-
Stepping out a bit wider on the time frame - to get a sense of where the price should meet some support from previous buyers- $36 should be strong support- but i would think it might pause higher and turn prior to that -simply because of the higher buying levels that had occurred-
I'm stuck with NVDA - got a bit anxious to pull the trigger intraday as it appeared to rally- but as one can see by the Stoch-Rsi- the indicator was still in the red oversold zone-almost breaking out- but just not quite there....The "safer" entry is when the indicator crosses the median line 0.50 and is moving higher- A side note- I have altered the indicator values from the typical values to be more or less responsive in a manner that i want to follow. Stoch-RSI instead of 14 , I set for 20 , and one can see that it captures the price turns nicely, and does not overreact by breaking the 0.50 line lower on minor weakness, but it clearly drops below the upper range. I also altered the PMO indicator- to be more responsive and closer to coinciding with the 20 period stoch-rsi- There's some overlap in these indicators- but when both are in agreement- it's likely that what is being suggested will be reflected by price- The more subjective indicator would be the PMO- possibly leading the stoch-rsi in terms of recognizing when the buying momentum is weakening-
By the time the stoch-RSI breaks the mid 0.50 line lower, price has usually broken below the faster moving average and is in a decline- How much of a decline is the question- How far will price drop? This is where it pays to be cautious- and not jump in early intraday on a bullish day-
The safer bet is to see that turn and close above the fast ema, preferably after a bit of a rounding base, and look to the left to see if this works with prior support levels. The chart of T tries to illustrate - indicators are in sell zones, price is declining and all 3 moving averages are pointing down- and price is leading the way lower. At the very least- this is still a NO-Buy zone- Now there is a RSI2 strategy that tries to identify the extreme oversold level and buy there- but that doesn't fit in my EOD time frame.
I have identified some of the prior possible supports preceding the Cup and handle breakout- Let's follow this trade as it progresses from here to see whether this thing reverses sharply higher in a day or two, or was the selling somewhat more intentional? Will a 1st upside reversal- take this thing into a V recovery? Or will it base and hold sideways for a bit? 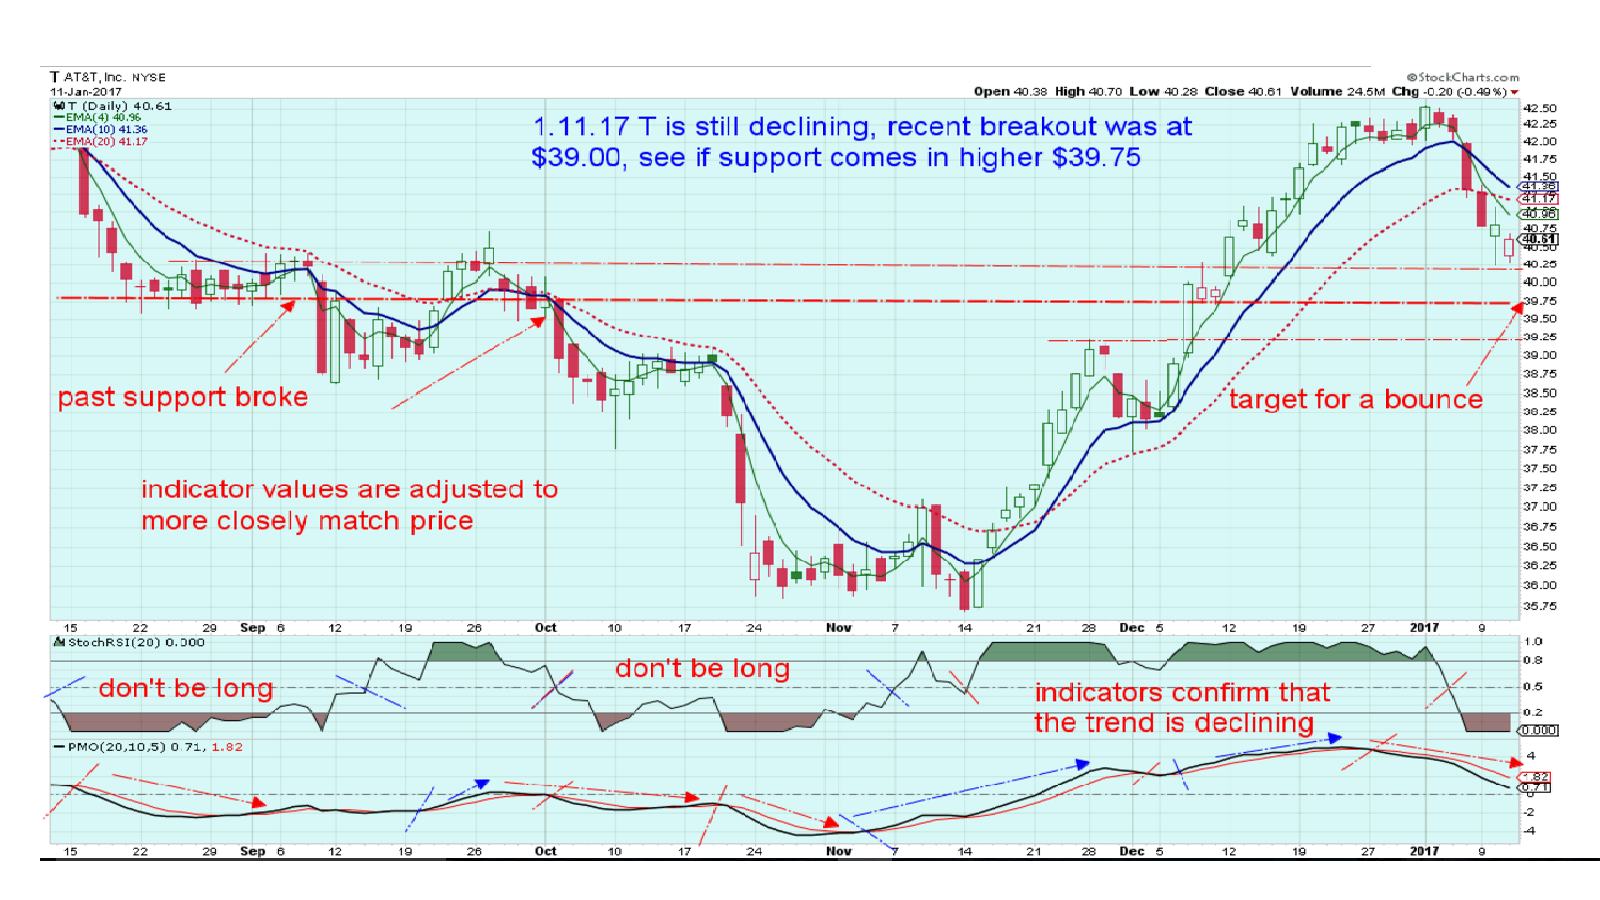 |
|
|
|
Post by sd on Jan 21, 2017 20:09:50 GMT -5
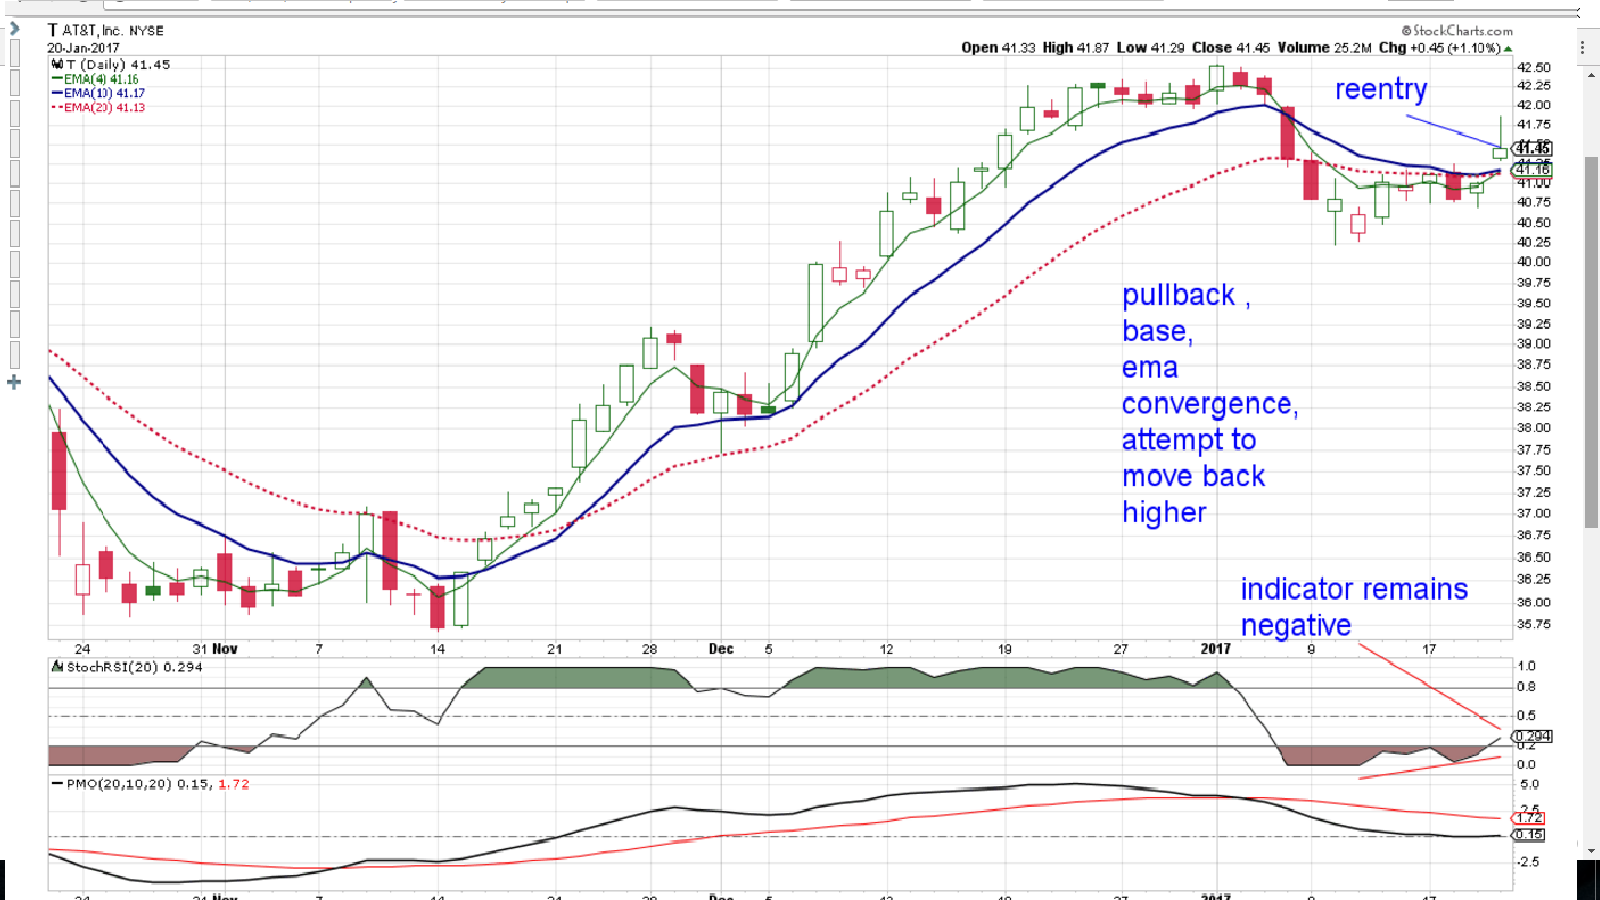
 In the previous post, T was at the 1st line of earlier possible prior support. I thought it would likely drop lower and penetrate into that prior support range-but $40.25 held the low, it turned , moved slightly higher -and made a short term base base. A note about trying to draw an exact line to represent "support" - "support" is just the confluence of past buyers and sellers exchanging shares at a perceived range in value- In the previous post, T was at the 1st line of earlier possible prior support. I thought it would likely drop lower and penetrate into that prior support range-but $40.25 held the low, it turned , moved slightly higher -and made a short term base base. A note about trying to draw an exact line to represent "support" - "support" is just the confluence of past buyers and sellers exchanging shares at a perceived range in value-
I normally would not expect the top line of perceived support to necessarily be a firm point from where price will bounce- expecting some penetration into the area of consolidation. -
There was value- and a bit of a larger profit- gained in taking the earlier sells-
without knowing how far price might decline, it offered the opportunity to "lock-in" profits, and a measure of protection to not be exposed to a large drop- This short term momentum trading approach -realizes that some amount of pullback is normal and necessary in trends- from where they can consolidate, and potentially resume the uptrend- Also realize that "Trending" is not the average condition- consolidation- or channel swings occur as the more common condition- so taking the momentum approach tries to capture those lesser trending moments-
With price action now making a pause , and a possible turn higher- I made a reentry Friday at the close.
Note that Friday had a tall upper tail, and closed back close to the opening price- i felt it was worth taking a position despite the price weakness-
It offers a relatively close stop-loss - below the swing low $40.25 - Risk is $1.25 or 3% .
Note that this is an Early entry- it has several "go" signals- price declines, turns and bases, and a move higher above the basing-
EMAs have converged,and price is leading- above all ema's-
The indicators I use- are still in negative territory- as they lag the price action.
There is a bit of a positive divergence in the Stoch-RSI- and note i am using a slower 20 period vs a 14-
Had price not made the higher open- lower close red bar 1.18.17, The stoch-RSI likely would have cleared the 0.50 line moving higher- as it is- it is barely above the 0.20 "Oversold" line- and the PMO is still bearish- Meaning there is not a lot of momentum supporting the upside attempt.
It remains to be seen if this swing low and this recent attempt to move higher- will find additional support.
 |
|
|
|
Post by sd on Jan 23, 2017 20:47:04 GMT -5
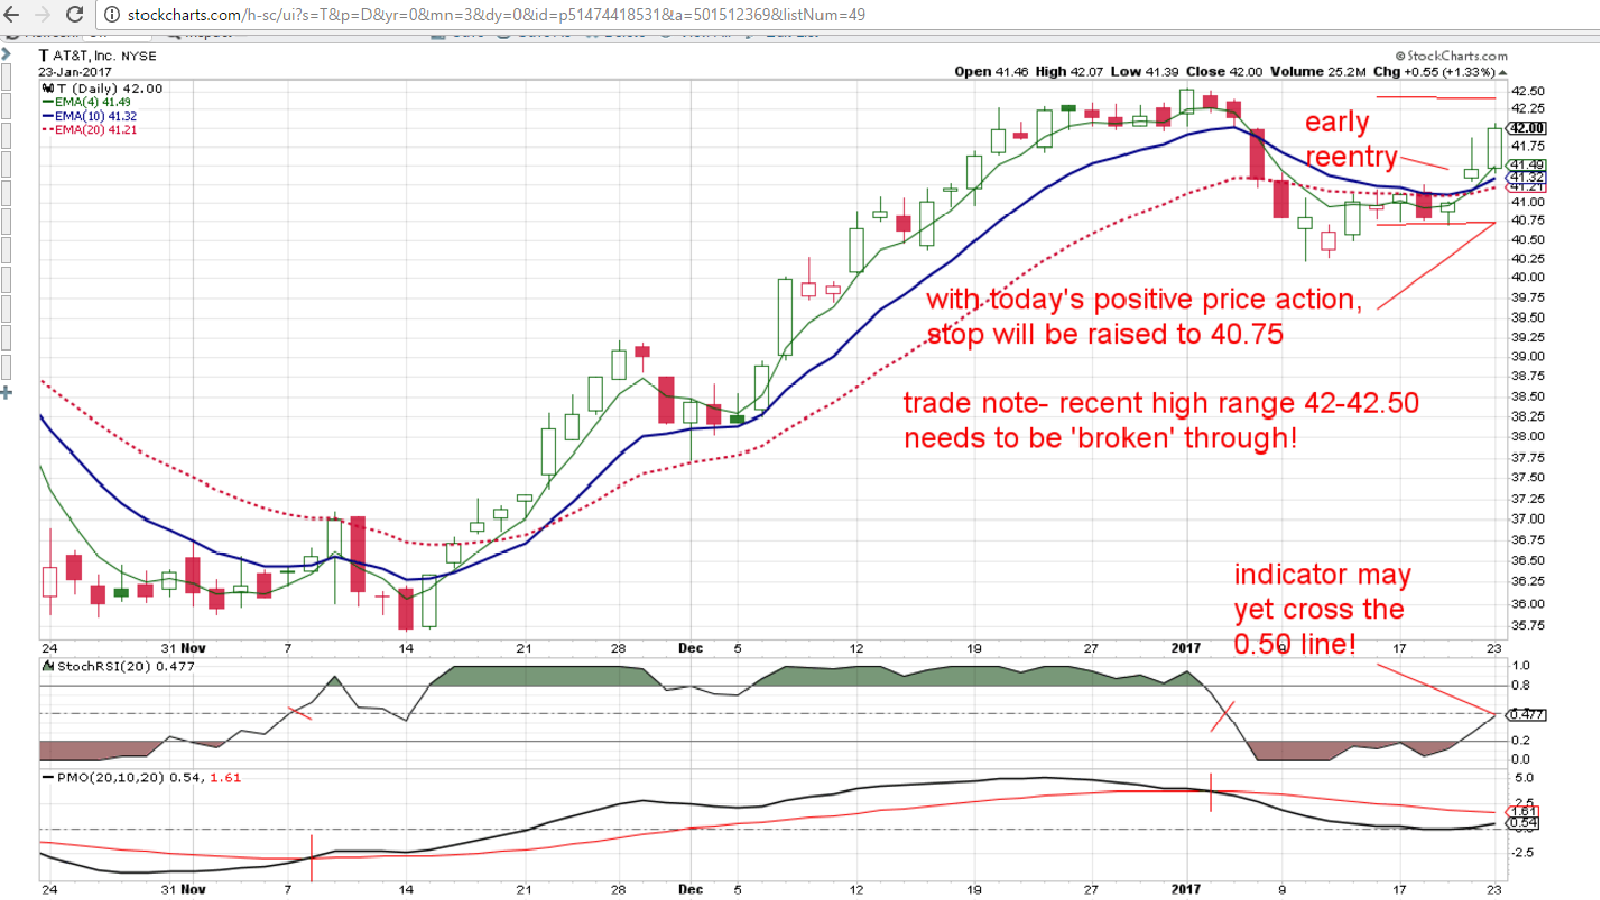
RE: T - Got a positive follow through today to a tepid break out higher Friday-
Note the indicators- lag price- and i have slowed these just a bit to reduce false signals.
Note that the pullback was not substantial % wise- and the recent high is just slightly above this recent attempt to turn back higher- That becomes a potential resistance level .
By taking the initial reentry - price had at least indicated it had moved higher above the recent price action - where i did-
effectively reduced the potential loss had the trade turned South and gone against me- Potentially, it also increases the potential gain ....
Borrowing from Alan Farley- i think he was likely heavy into Reversion to the mean- and oversold entries- The best entry is the one closest to the Point of Failure- WHY? because it presents the least amount of RISK! A simple concept- but I expect difficult to execute .
Let's now assume that this new entry moves up to resistance above- and stalls-My stop is raised to the low of the pre breakout levelabove the ema's-
This becomes a relatively Low Risk % trade. I think in choppy undecided markets, you have to Adapt to a more aggressive approach with stops- at the same time, allow some leeway- All a balancing act......
I tightened the TSLA stop, trailing GLD, but took a painful early reentry in NVDA that ultimately took me out for $7 loss-
Sometimes this works- sometimes Not.
 |
|
|
|
Post by sd on Jan 24, 2017 21:06:24 GMT -5
Life is full of lessons-
This past week i had to participate in giving a presentation (along with other members of our company) to some prospective clients for an upcoming project-We were Competing against some very large competition.
Public speaking has been a life-long source of fear/anxiety etc, and something to be avoided. Fear is our imagination, magnifying our weaknesses.
Out of the blue, I'm notified that in 2 days I must give a 2-3 minute segment to this group of prospective professional clients-
I prepared, On day 1- I reviewed, went home, wrote 5 pages of a presentation-Went into the office and was told i could not 'read" 5 pages -
Bullet points only on index cards- But i was the one sweating bullets!
On the drive to the presentation, i had notations filled on 3 index cards-
i started off on Card 1, Line 1, maybe 2- and then just forgot to look at the cards after that, and spoke honestly about what i bring to the project, and what our company would bring, All to the success of the project. As we left the conference room, the next group of presenters were waiting in the lobby, and i told them that that there was no need for them to stay any longer, that they were no longer needed, and could go home- I don't think they took my bait.....
reportedly, our presentation was well received- we shall see....
What does this have to do with trading? Or Investing?
FEAR- Fear holds us back- Fear - it keeps us alive- but in modern society, a sabre toothed tiger is not around the corner.
Yet - as traders- we allow fear - of loss - to cause us to react emotionally, not logically- Similarly to my gut reaction to be presented with public speaking ------
We hopefully have a plan- lined out on index cards perhaps- but at least an outline we will follow-
But fear steps in on occasion, and clouds our reactions- perhaps we are too close to the situation- and need to get some better perspective.
My recent focus on T- I was pleased with my staggered stops as price declined and got profits on both sells. i recognize that tight stops can get whipsawed, and having one stop for a part of the position slightly wider may not get hit- In the case of T, both stops were hit, and price declined a bit lower, but not as much as i would have hoped for-
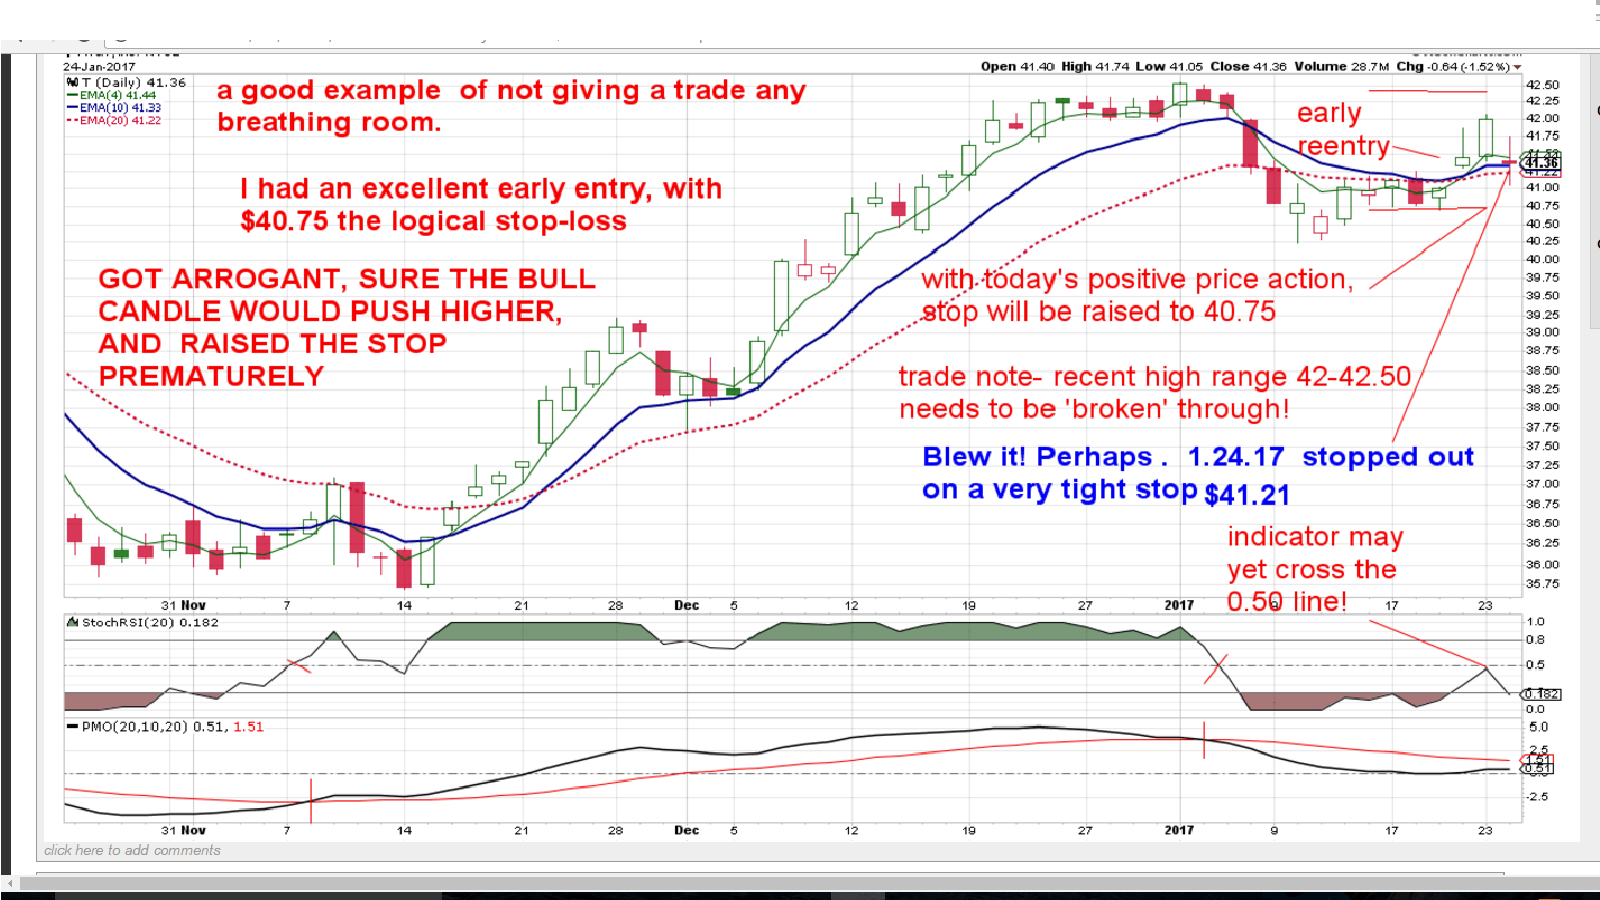
As T made an initial base, and then a move a step higher- i took the early tenative entry at the close. This provided a closer % entry to the possible breakdown of the underlying base- This was a relatively early entry- and had a logical TA based stop-loss . The next day was a tall bullish continuation bar, and seeing that, i tightened my stop to within $.20 of my already low entry price.
That stop was hit today- yet my initial stop-loss was not touched- my original stop loss was based on logic and sound TA, My raised stop-loss was based on emotion- and bottom-line- the desire(fear) to reduce loss if the trade goes against me. The opposite of this, is having a stop-loss so wide that price is in a big decline before the stop is hit.
I've generally allowed entry stops to hold, until the position either goes higher or shows closing weakness- In today's chart of T, WITH WEAKNESS IN PRICE being the order of the day, i would have raised my stop for tomorrow to the low of today's bar at least.
As i've mentioned on numerous charts in the past, the 1st rally attempt is often rebuffed, where the 2nd rally succeeds. i did not give T the chance to prove it's direction with that tight a stop- until price is actually trending- multiple closes above an uptrending ema, it is still caught in the base/consolidation .
Edit add- i NEED TO REMIND MYSELF-and it's worth noting here- It's often best to wait for the bar to close in the time frame - My approach is supposed to be to allow the momentum to continue, not react prematurely, if the desire is to hold for a longer term gain. React on weakness with a tighter stop- or- as in the case with TSLA, if the velocity of the momentum is increasing, it will eventually be unsustainable, and -a normal pause will be in order-and profit taking by the momentum players.
 |
|
|
|
Post by sd on Jan 25, 2017 19:28:19 GMT -5
DOW 20K! 1.25.17 Trump is now president, and taking action-
This is definitely a TRUMP rally- and ride it while it lasts is my belief....
|
|
|
|
Post by sd on Jan 28, 2017 10:51:06 GMT -5
Following up on T Not as a position- but the chart is interesting- The recent pullback needs to hold the swing low for the trend to be considered as still UP. I took some new positions Friday, EW, EXAS, MU, added to NFLX. Holding GOOG 820, 822 had a nice pop above, but pulling back on earnings concerns-Will see if the optimism outweighs I will see if the recent 800-810 will hold as support- will stop out below that level.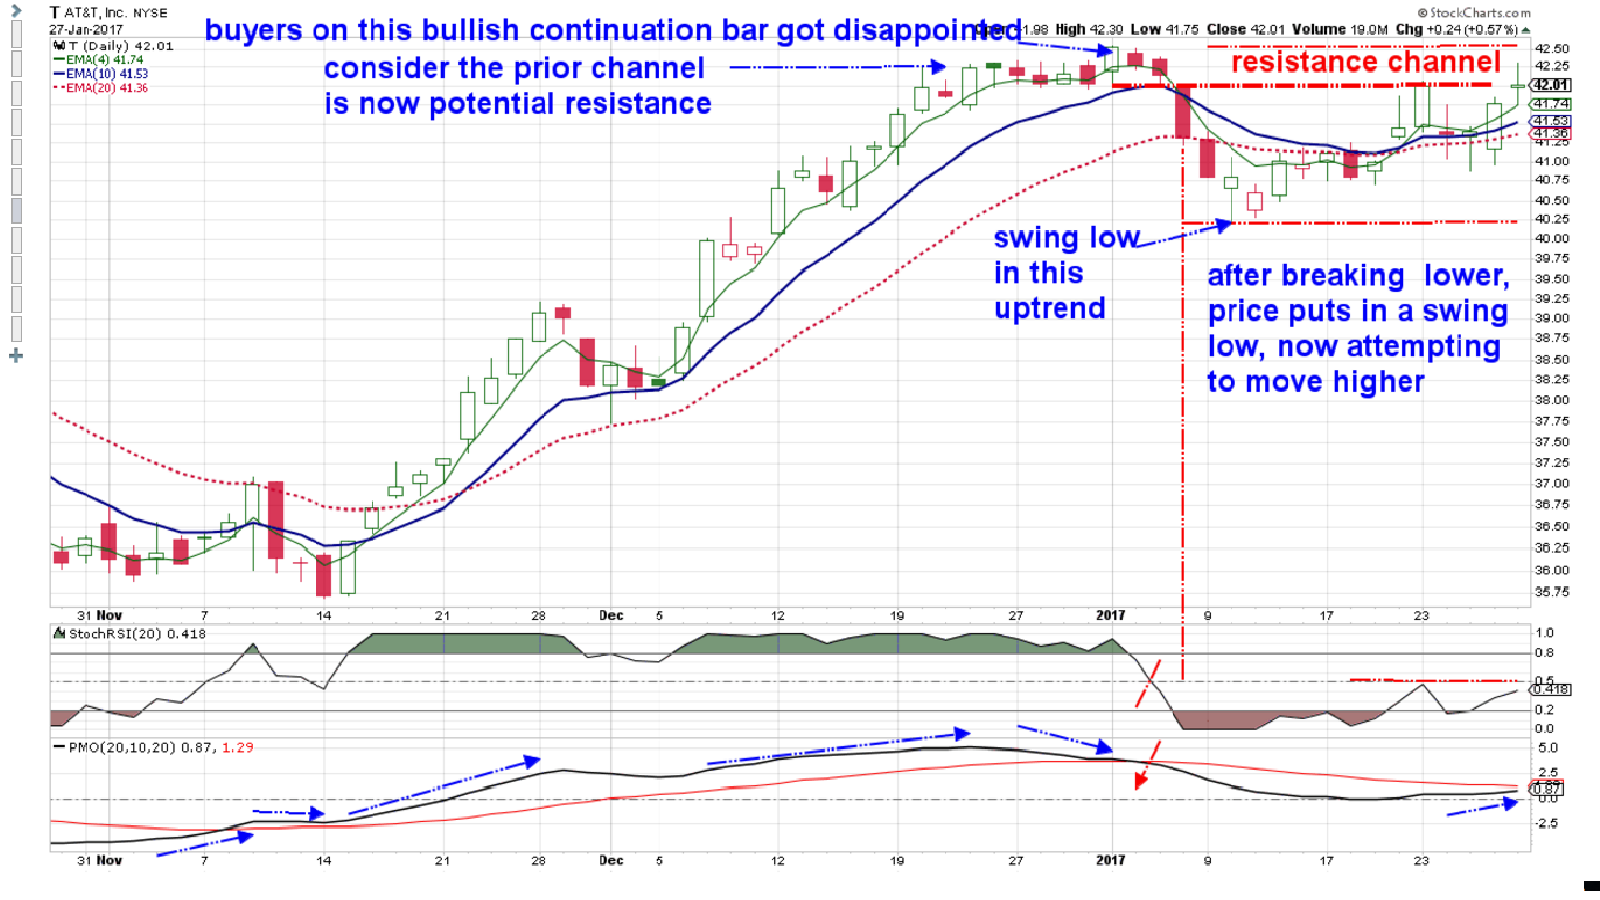 |
|


