|
|
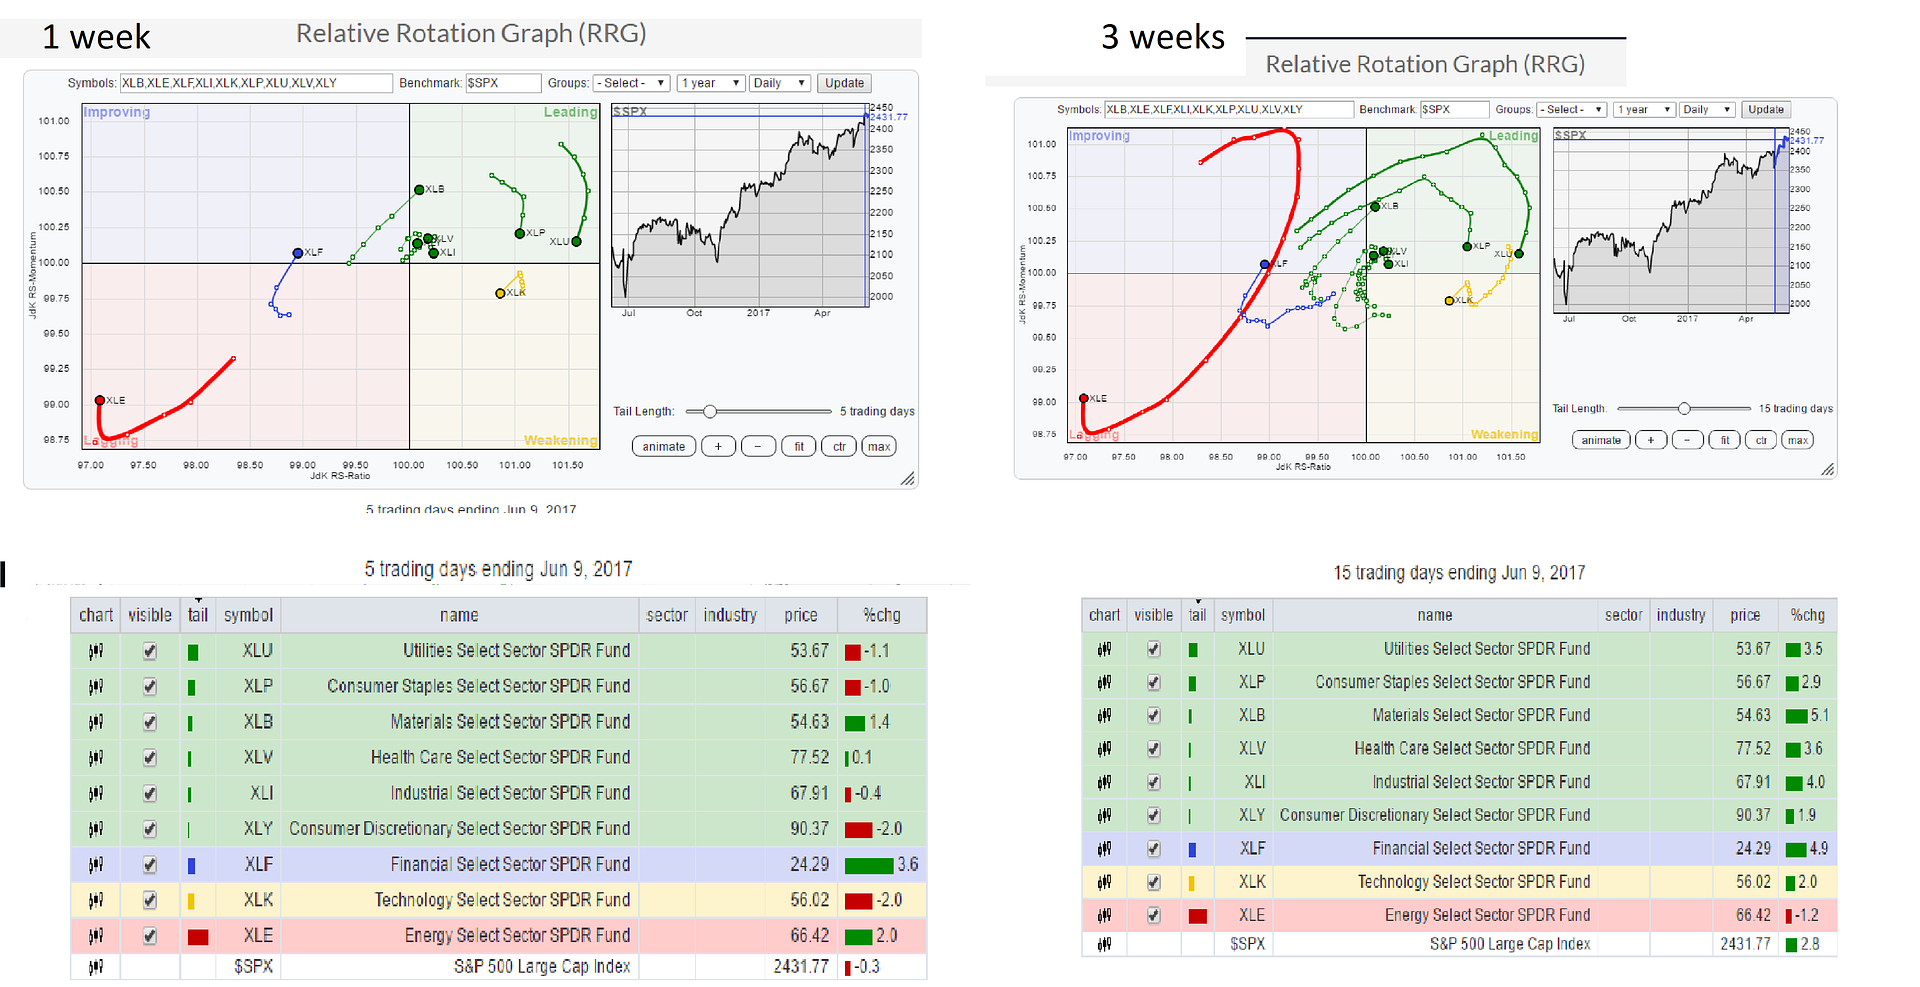
Post by sd on Jun 11, 2017 8:36:29 GMT -5
|
|
|
|
Post by sd on Jun 16, 2017 9:29:57 GMT -5
sector rotatation 6.16.17 over a 2 week period- note the XLF gained 4.1% over this time, but is still in the lower left lagging quadrant. xli possibly looking to trend higher- 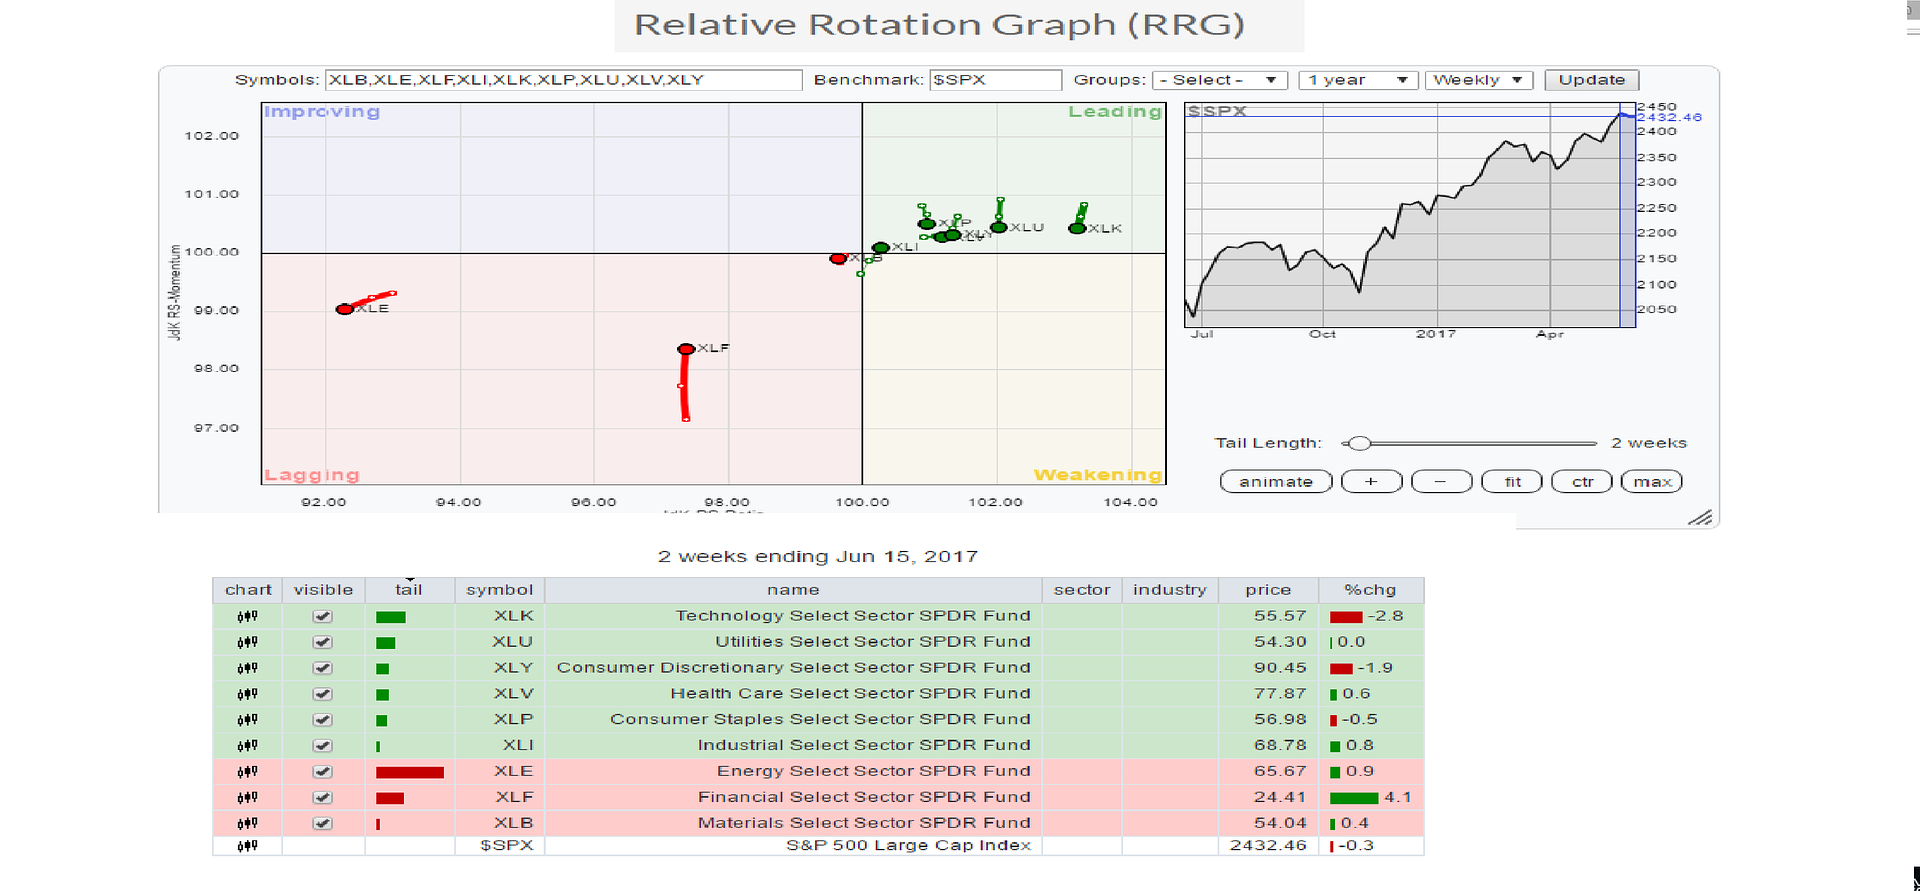
|
|
|
|
Post by sd on Jun 16, 2017 12:50:25 GMT -5
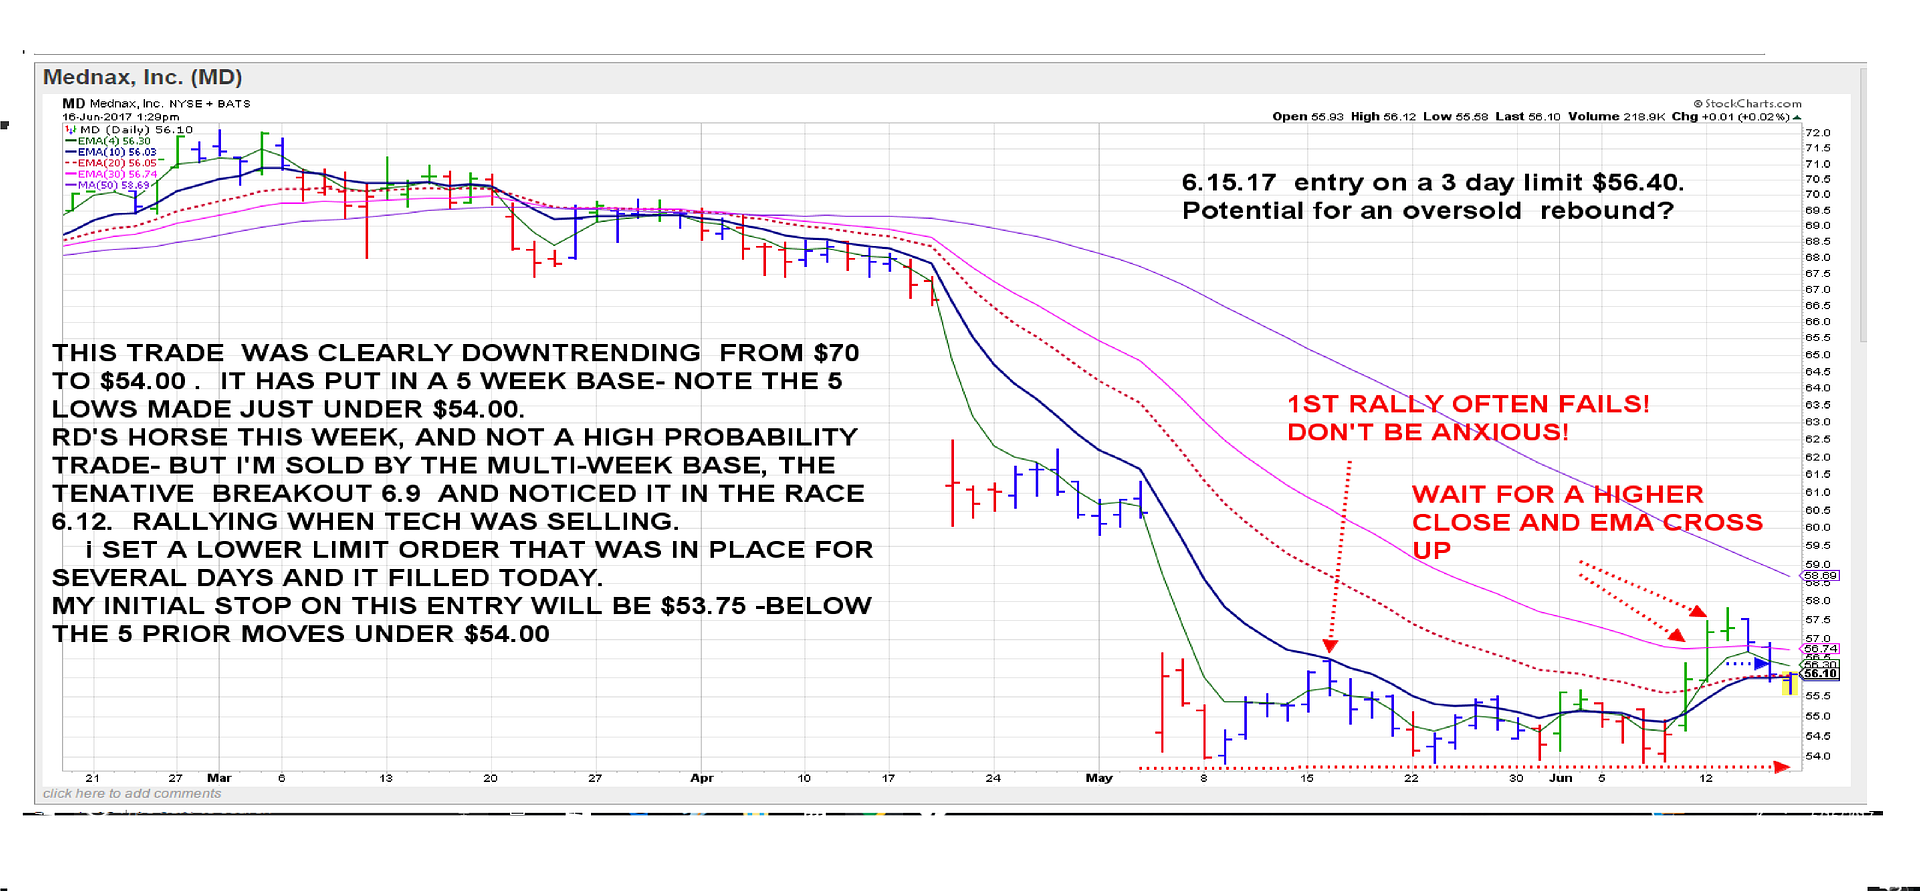
Looking at an alternative type of entry- as Tech takes a hit....MD has downtrended but has been in a multiweek base-just bounced up this week-I set a limit order, filled after 3 days as price pulled back. We'll see how this works- Not trying to keep a tight stop- Stop will be below the low off the base for the time being- Taking this initial pop higher out off the base as apositive sign ....
 |
|
|
|
Post by sd on Jun 19, 2017 20:06:18 GMT -5
Monday 6.19.17
Had some computer time today....Saw a lot of green in the world indexes, and the US as well. I decided i would jump on board-with some additional trades, taken gradually over the course of the day- with duty calling intermittently....I forgot I had an open order buy-stop - VRTX that filled, and the healthcare/biotech looked strong- I also bought GLYC- did nothing- but was green intraday... I put in a limit on XBI- it finally pulled back and filled in the pm. Also bought ROBO, MU, MRAM,TQQQ.
I was -am-skeptical of tech- but letting the market lead the way- Looked at the individual sector strength and the industrial s and healthcare were both leading market areas at that time- by day's end- Tech led followed by healthcare,financials- Energy and Utilities saw some sell-off....
I hadn't planned to participate today- Had some free time- and then more free time- Only took trades within the IB account- lower commissions allow me to take smaller positions- and $1 commission costs are not a factor in making a trade decision...
Is the market ignoring the political drama? The Fed ? Summer is a seasonally weak period- and I think September is the "worst" month- historically.....But again- one knows the market does not always follow the "go Away in May" advice...As this market manages to grind on-
Interesting- Spy opened 2017 around 223, closed today on a breakout $244- a gain of $21/223= 9.4%
The S&P Low Volatility SPLV- opened 2017 approx @ $ 41.20, closed today $45.69 ...a gain of 10.8%
The S&P High dividend, low volatility SPHD $38.72-40.94 = 5.7%
HMMM does SPLV offer more dividends than the SPY average?
|
|
|
|
Post by sd on Jun 21, 2017 20:12:46 GMT -5
I was pleasantly surprised this pm as i got some free time just prior to the market close-to view the market action....
Most of the positions were in the green-gaining from Tuesday, 2 slightly lower...
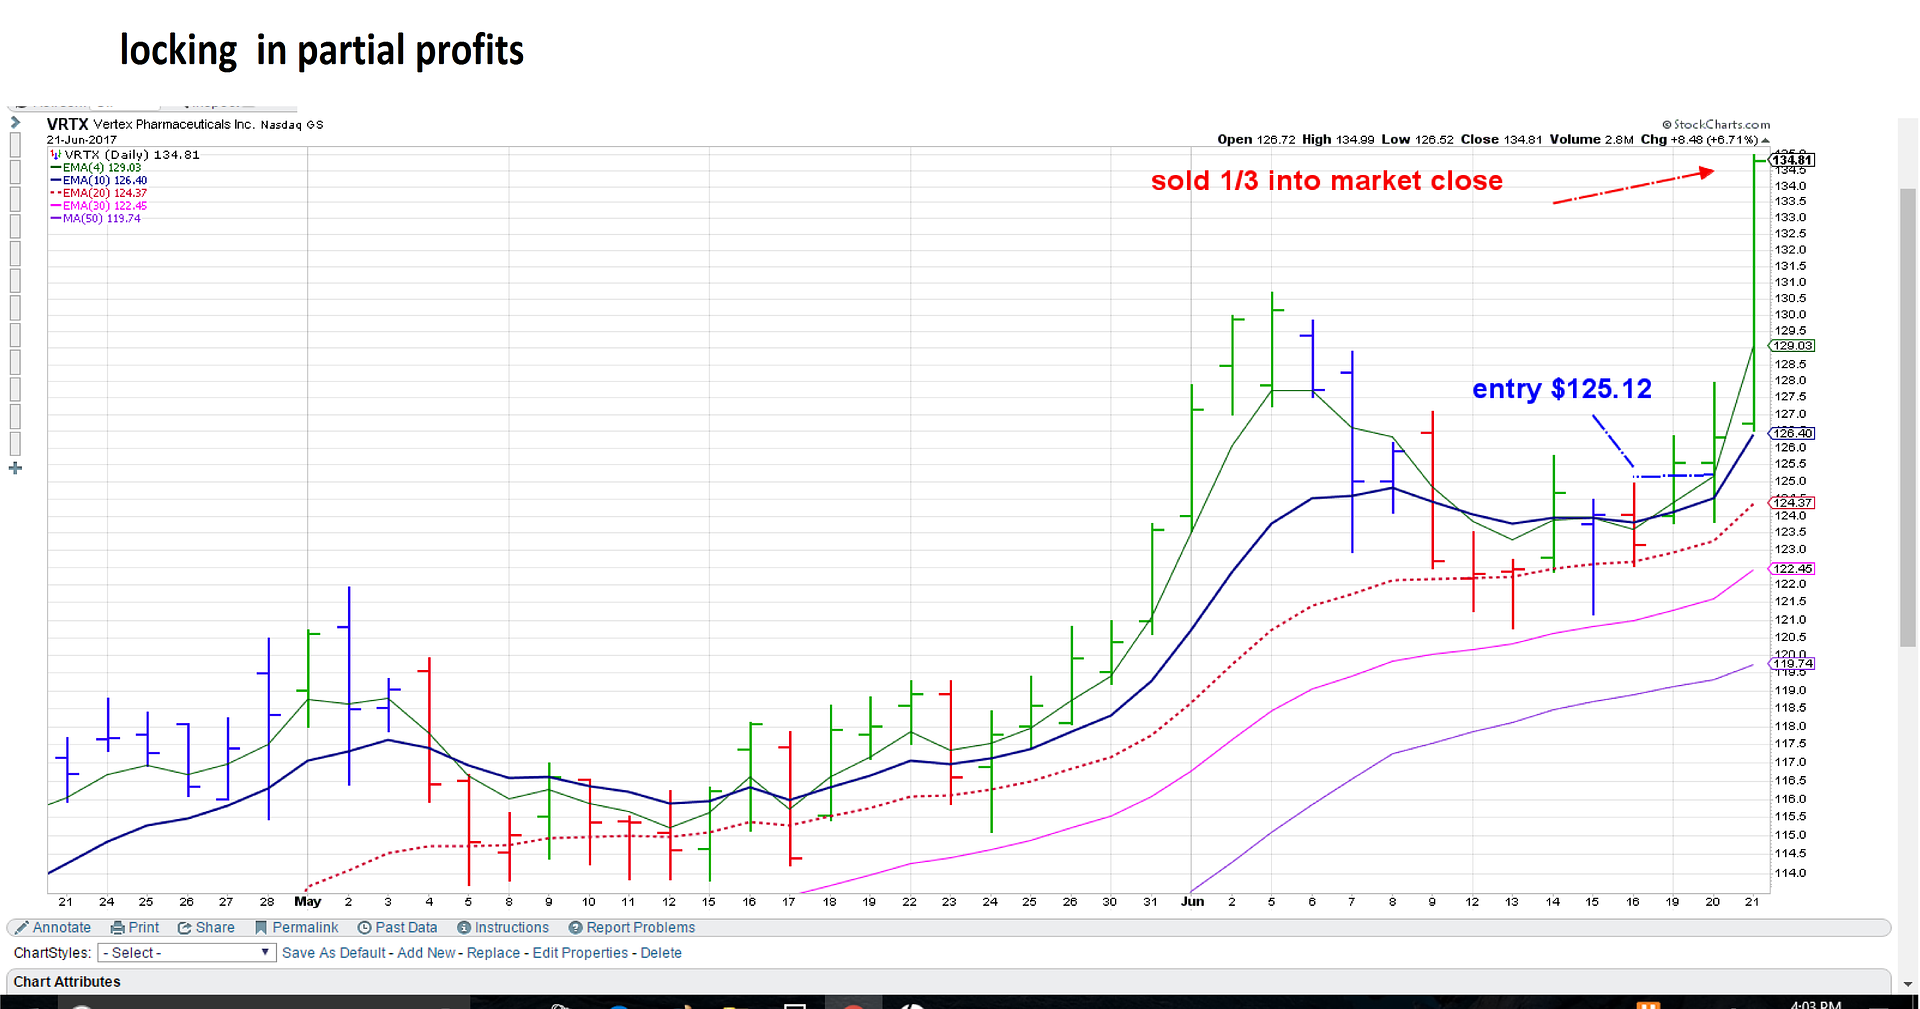
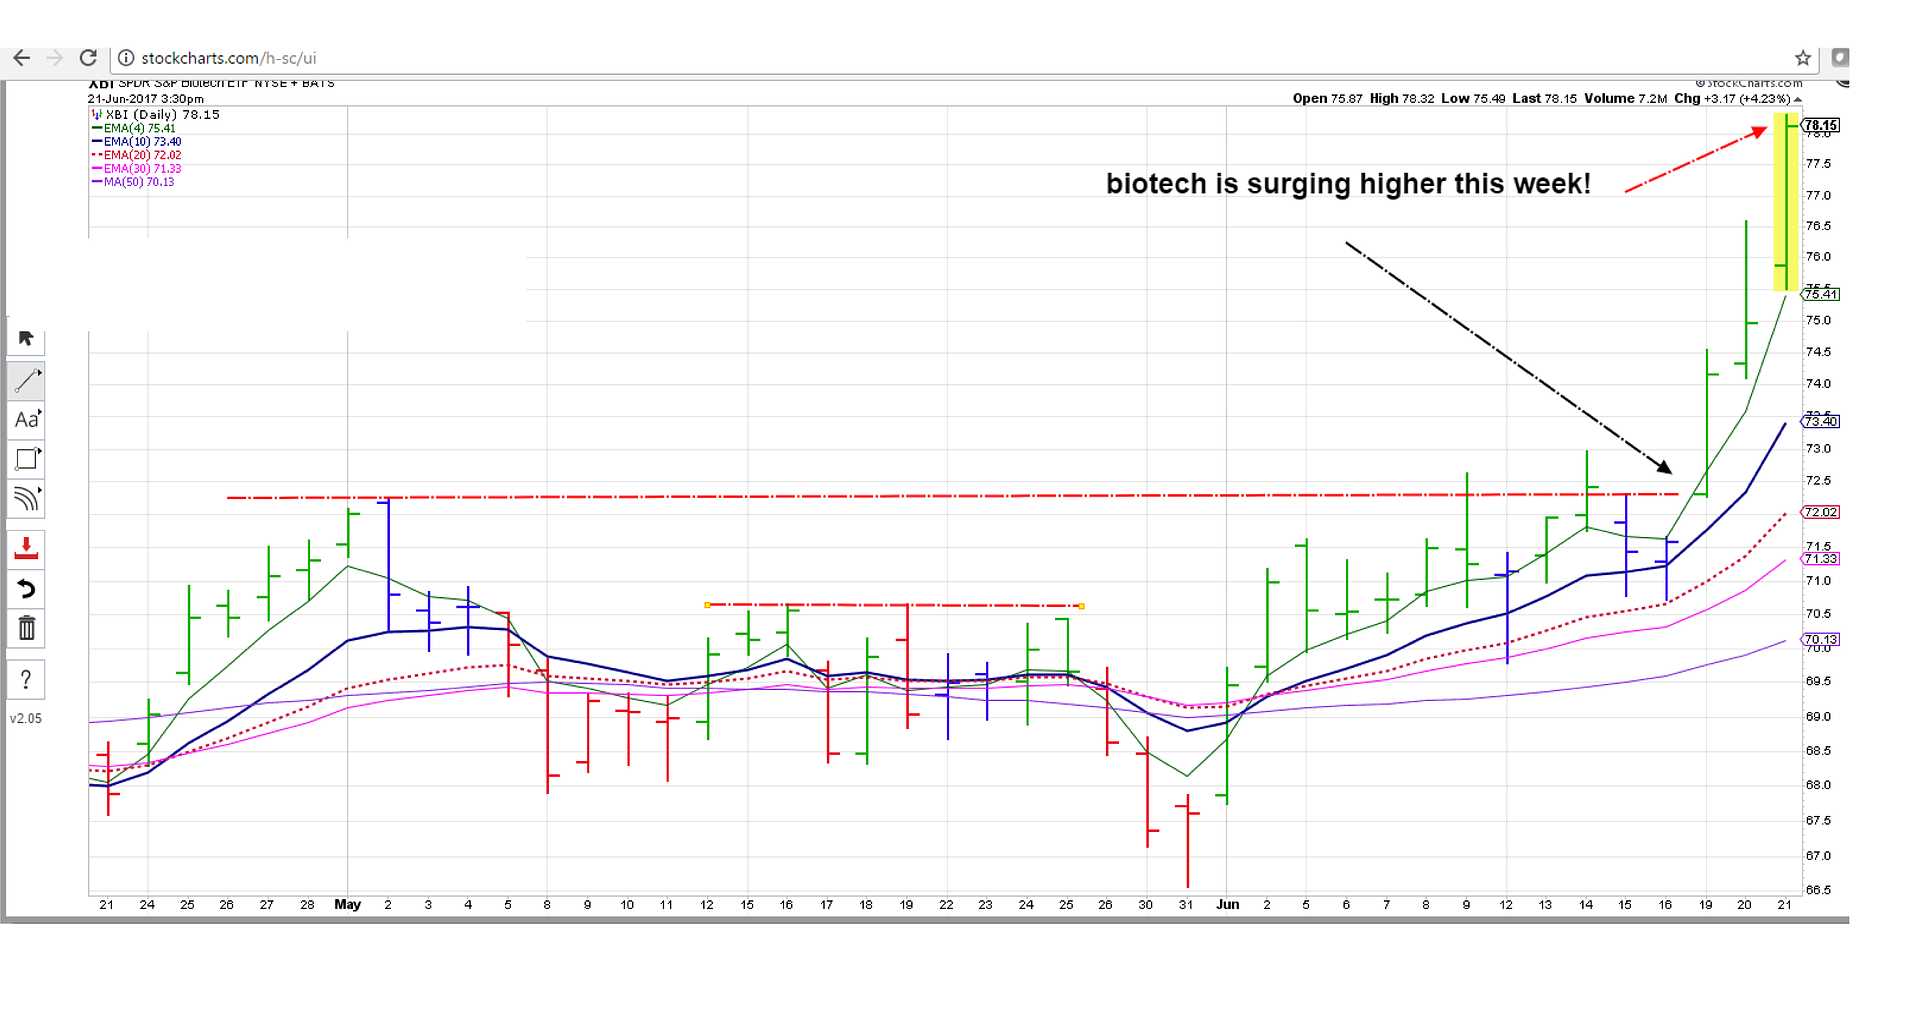
VRTX had a sharp higher move today, and the biotech Index was up nicely- TQQQ also up from yesterday, closing up slightly higher than my 104.01 entry
VRTX was a standing order- Buy-stop i had forgotten from last week.
MD has moved up slightly- chart and entry decision posted previously- still looks potentially bullish, but trend reversals -when price is below all the primary emas and declining- something prompted the sell-off- and what goes down does not always bounce back- It's something of a contrarian trade - vs Taking trades With the Trend-
I actually had a limit to short Tech last week with QID- limit didn't fill and i cancelled the short tech trade after 2 days-- Don't jump the gun and get in early on a possible trend reversal I tell myself...
GLYC hasn't joined in -but hasn't declined.
HDB- Financial ADR may be rolling over today after an extended uptrend all year...Time to raise the stop-loss on that one-HMMMM.
MU is up today on a nice higher uptrend move following a week of pullback under the ema, recovery, and potentially will challenge the recent high.
I've come to believe the Adage "Let Your Winners Run " should also include- " And be patient and allow them to rest sideways"-
However, that's great when all sectors are humming along and up-trend is the predominant direction for most sectors-
My mindset is that we are experiencing a sector rotation- obviously some areas are out of favor-and instead of chasing after "value" oversold-out of favor....
try to discern where the money is flowing- Since i don't have a lot of time to listen or watch the financial channels, Charts and the market /sector summary - are 1st steps for me.
And our horse Race candidates are good starting points to consider- i have made nice gains in AAOI on 3 trips in and out...Thanks Ira!
Spiderman also shoots for the volatility- and he certainly called it this week- It met my chart criteria, and i locked in some profits today on a partial sell.
The other racers have had some good picks before this week- and Blygh has the best average of grinding out winning picks! The horse Race is a good resource - to start to drill down deeper using Finviz screener- and i think that is a smart and easy step to confirm ....or compare with others in the same group.
I like that Blygh posts his market /industry group picks- This week it was the cruise lines - i pointed out the one I felt had the best chart performance- CCL- and it closed at a new high today (Not a position) Stop on CCL should be $65.28 if anyone is holding IMO- follow the 10 ema until a big red bar closes below the fast 5 ema -IMO...
In making a decision to take a trade- I bought both MRAM and MU- because of the chart formation- Both were in uptrends based on the slower emas- The SMH sector has pulled back and is in a critical sideways base- It is still in an uptrend-based on the 50 ema, but took a big hit in the Tech sell-off ....but i took the individual trades as they may lead the sector segment higher- but it also helps form my thinking that I need to be trading with more caution- as the trading areas of new highs lessens, and the other sectors come under more pressure- it is not a balanced market with everyone benefit ting. And , it is summer time - historically not strong....
I have also gradually widened my initial stops- on stocks within uptrends- and that has been beneficial to not get that early whipsaw before some better moves higher-Based more on a wider moving average, a price swing low pullback etc. I used to start with stop-losses less than 2% on average- I finally realized that the majority-not all- of declining stock prices will close higher usually than the push down intraday, and to ignore most intraday price action- Can't usually view it anyways except at lunch .....
I feel i have had a measure of higher trading success this year that had eluded me in prior years- perhaps just lucky and not having a lot of time to dwell on the markets-caused this to be. Perhaps it is because I have gradually tried to consider managing my larger retirement assets and don't want to be reacting to a one, two, three day sell-off and panic down 3% and sell out of panic. Reinforce my good behaviors:
Getting back to today's price action- I sold partial positions MRAM,VRTX,XBI right near the highs ,right near the close today-
The key word here is "Partial" - But, i wanted to lock in some gain that exceeded 5 or 10% on a partial sell-
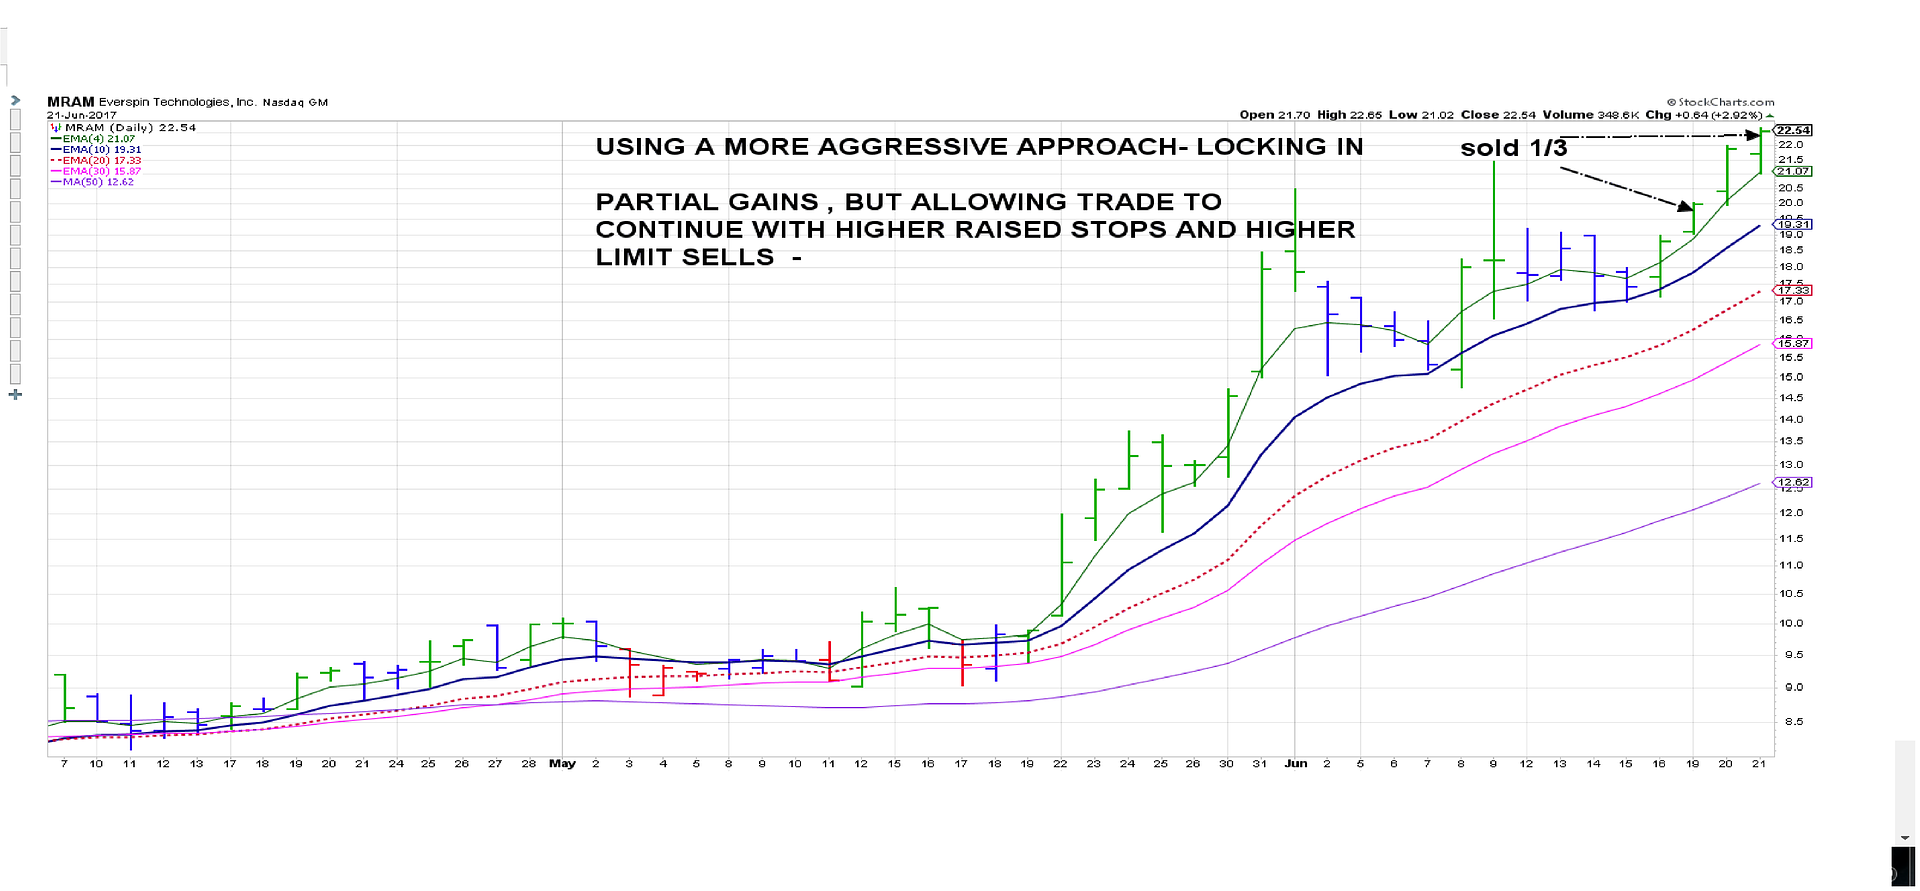
Psychologically, selling a 1/3 position at a high point extended beyond the ema is smart- because it locks in the gain and satisfies a desire to take an early quick profit- I didn't sell everything that has a gain of over 5%- MRAM is solidly close to the Fast 4 ema and shows no signs of excess. I think it is important to not to pull the trigger too quickly- allow the trade to develop and not be too anxious- but i also no longer think i will wait for the price to show significant weakness (close under the fast 4 or 5 ema) before i take something off the table- Understanding when price is extended beyond the fast ema- is reason to realize that it has to come back with that rubber band pull to the typical trajectory-
Those excess momentum moves may be climatic- but should also be responded to by adjusting stops higher or taking advantage of the excessive momentum higher.
XBI is up vertical/parabolic and is unsustainable- This is the price action speaking- I will sell another 1/3 at the open with a higher limit ...That was today's gamble... and the final 1/3 at a 15% move higher -order Hoping to capture what is known as a Climax spike . This is trying to capture gluttony in the marketplace- and so i have some Risk that the market place realizes it's excess overnight and opens substantially lower-
VRTX could go anywheres- I will try the similar approach of having set higher limit sells and hope Momentum will open the price much higher, my order will execute for a larger profit, and then i always have the opportunity to wait for it to come back -reversion to the mean- and purchase more shares for less monies.
i will copy the charts i posted earlier in the horserace here.
|
|
|
|
Post by sd on Jun 22, 2017 21:03:57 GMT -5
Busy day today, and i left my laptop at the jobsite-plugged in to charge the battery, using the wife's lenovo small book/
I think today was a good day- GLYC stopped out on a raised stop for a $17 loss. I can take that on the losers everytime!
I entered PBYI at the open - Thanks for the Chart RD- I was concerned that it might not go any higher- It had that huge gap and now a long base--
but it sets up as an excellent entry with a very narrow P.O.F (point of failure) to the bottom of that weeks long base.
Sector strength in the healthcare is led by biotechs- and so I took only a small entry -limited by the free cash available.
MD is making the move higher! Popped up closing up 3% higher on the day- This was a reversal of trend play i don't normally consider-
Might be lucky here, it had an extended basing period- so there may be more pizazz - left to challenge the prior 60-61, $62 level- that was a failed support...Lots of unhappy value buyers there i expect...Just wanting to get their money back near breakeven!
We'll see what Friday brings for the market- Indexes aren't showing strength - Might be a good time to get more cautious- keep a few toes in the water, but perhaps more aggressive on stops on weakness?
I have a larger position OEUH- exposure to Europe in a different account- - that does not appear to be doing well- I haven't cared for it's fluctuations- but it appears to be challenging the trend -
So, while it's gratifying to identify the winning trades, and the methods that worked to get in on them, That's positive Reinforcement....
I also should reflect the potential larger loser - larger position trade- I can't appreciate taking a $7 trade in TDAmeritrade or Scottrade ,
and doing the same in IB for $1. Vanguard is free btw with Vanguard funded ETf's...
While i'm penning , I think being willing to position one's self in some more aggressive and potentially volatile stocks is a leap of faith on the one hand.... one has to be aware of the downside risk- Too much exposure to these home run swingers could be a disaster if the trend changes -I was holding 10 positions this week in the IB account- 9 now with the GLYC stopping out.
So, to anyone reading this thread, understand the potential Risk of taking just a 1 or 2 position in your account and finding out you take a 30% loss on a drop in 1 day-
That said, One needs to have some pizazz exposure to liven things up..... but willing to control the Risk and the position size appropriately for their account. No broker leverage......
|
|
|
|
Post by sd on Jun 23, 2017 7:29:36 GMT -5
tRYING TO POST A COUPLE OF CHARTS this am.
PBYI - after such a huge runup- you would think it had "peaked" and all the buyers were in that were willing to pay up higher- The entire sector is showing buying interest- at least through yesterday..... I set my initial stop-loss a couple of % below the bottom o the base- coincides with the 20 ema- just to give it some room in case intraday volatility spikes it down. Nice that it appears to have closed at a new base high yesterday- a close back inside the base would be a cause for concern-
MD- THE REVERSAL OF TREND TRADE... 6-16 pullback swing low on 6-16 about $55.58 should be a level not retested- So, a stop at $55.00 gives it plenty off room for intraday volatility- and - price weakness on a close- or a climax push higher- would give time to make an adjustment. 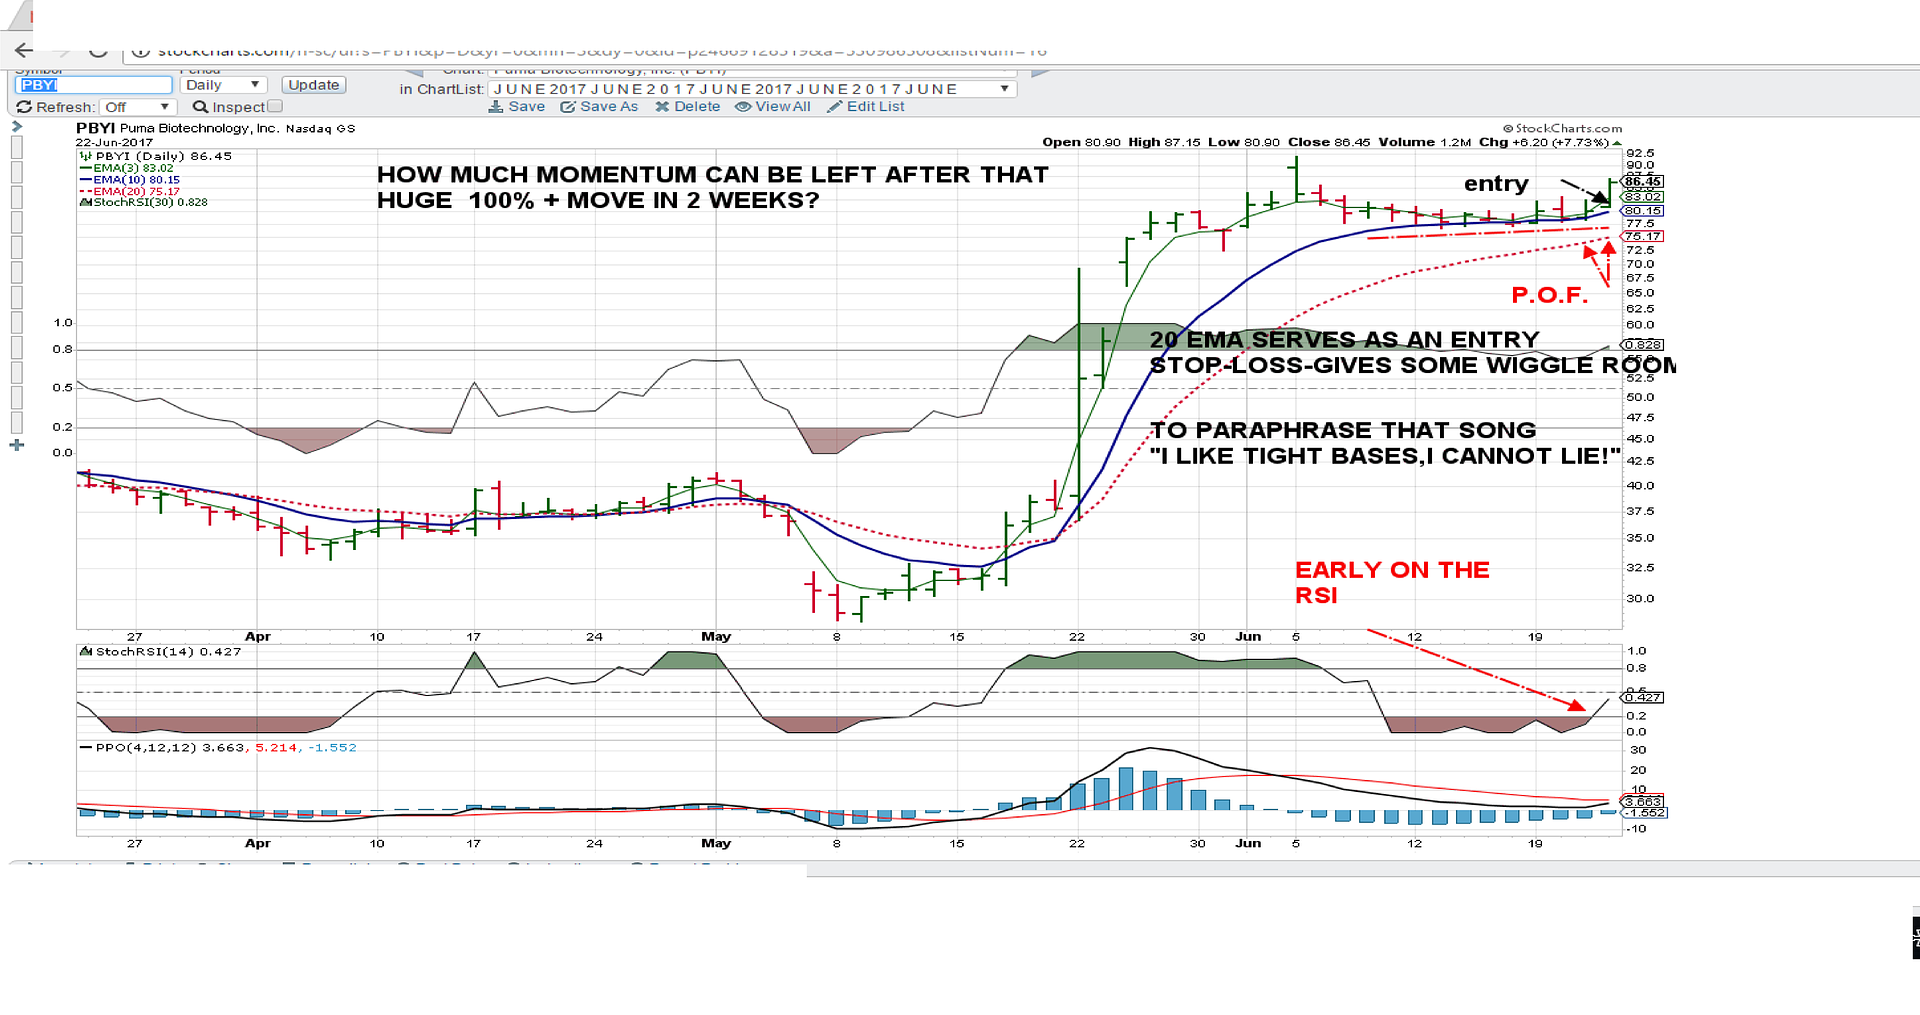 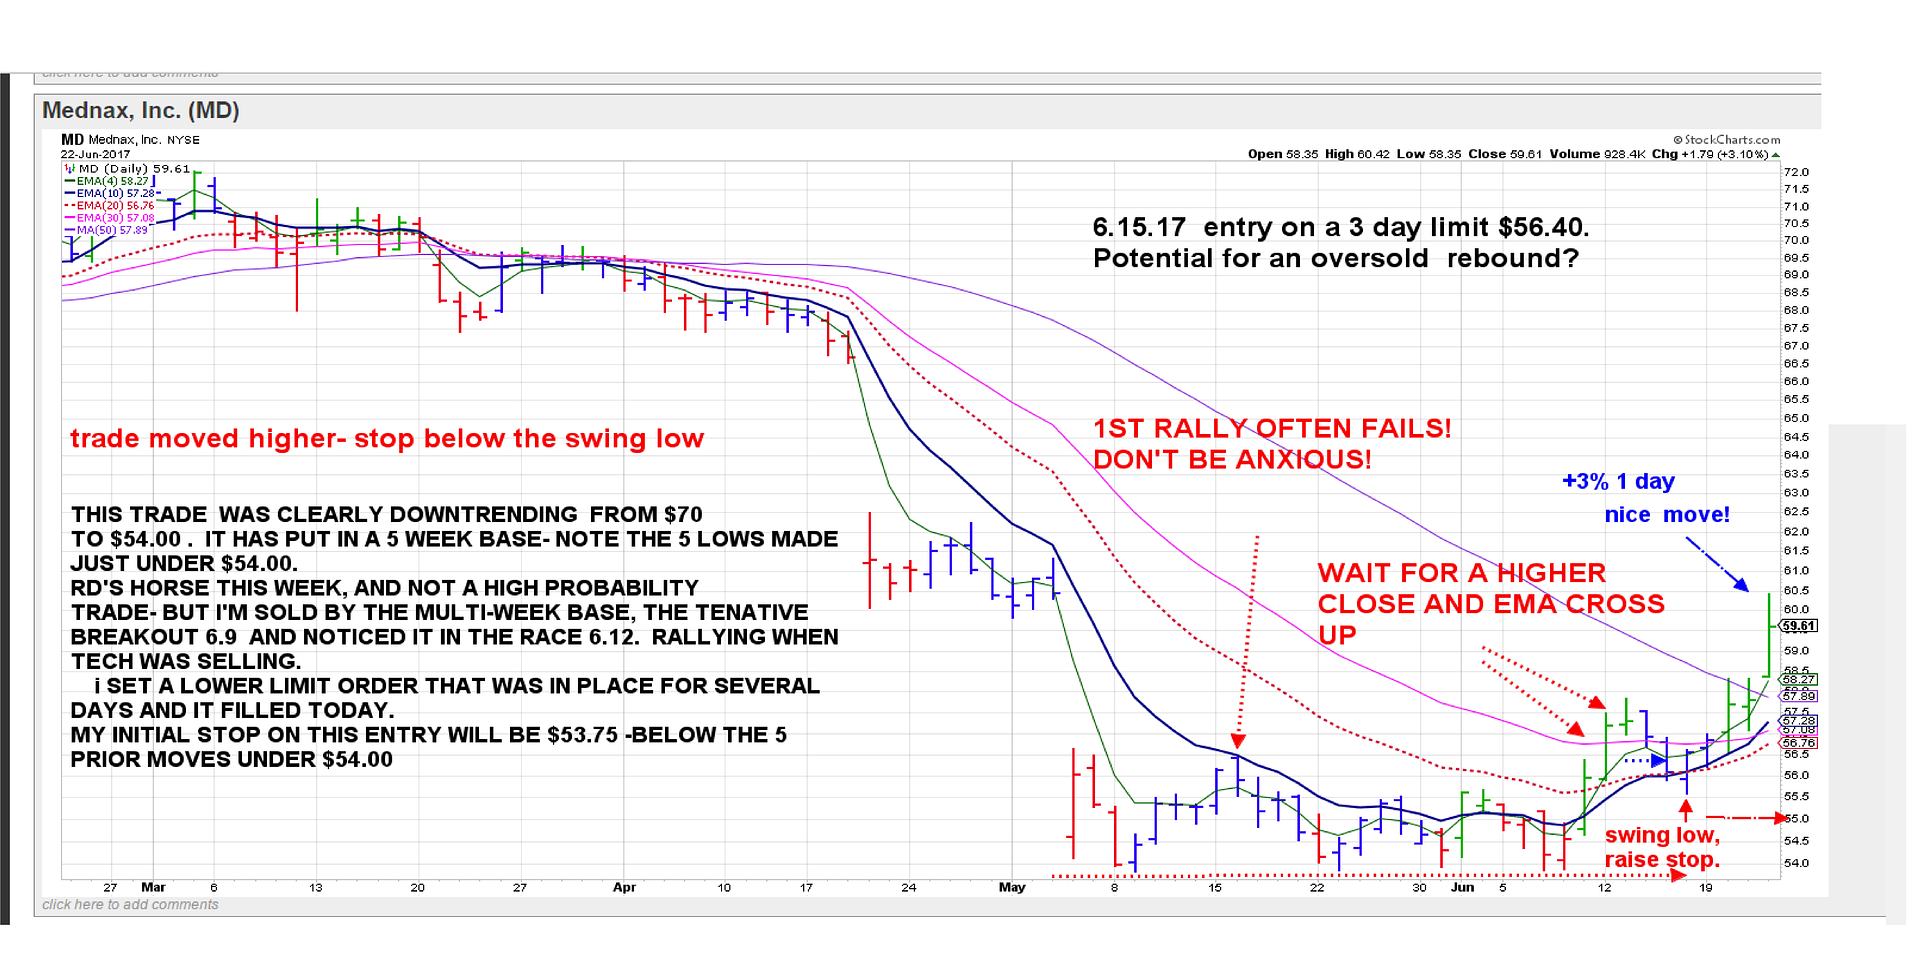
|
|
|
|
Post by sd on Jun 23, 2017 7:53:52 GMT -5
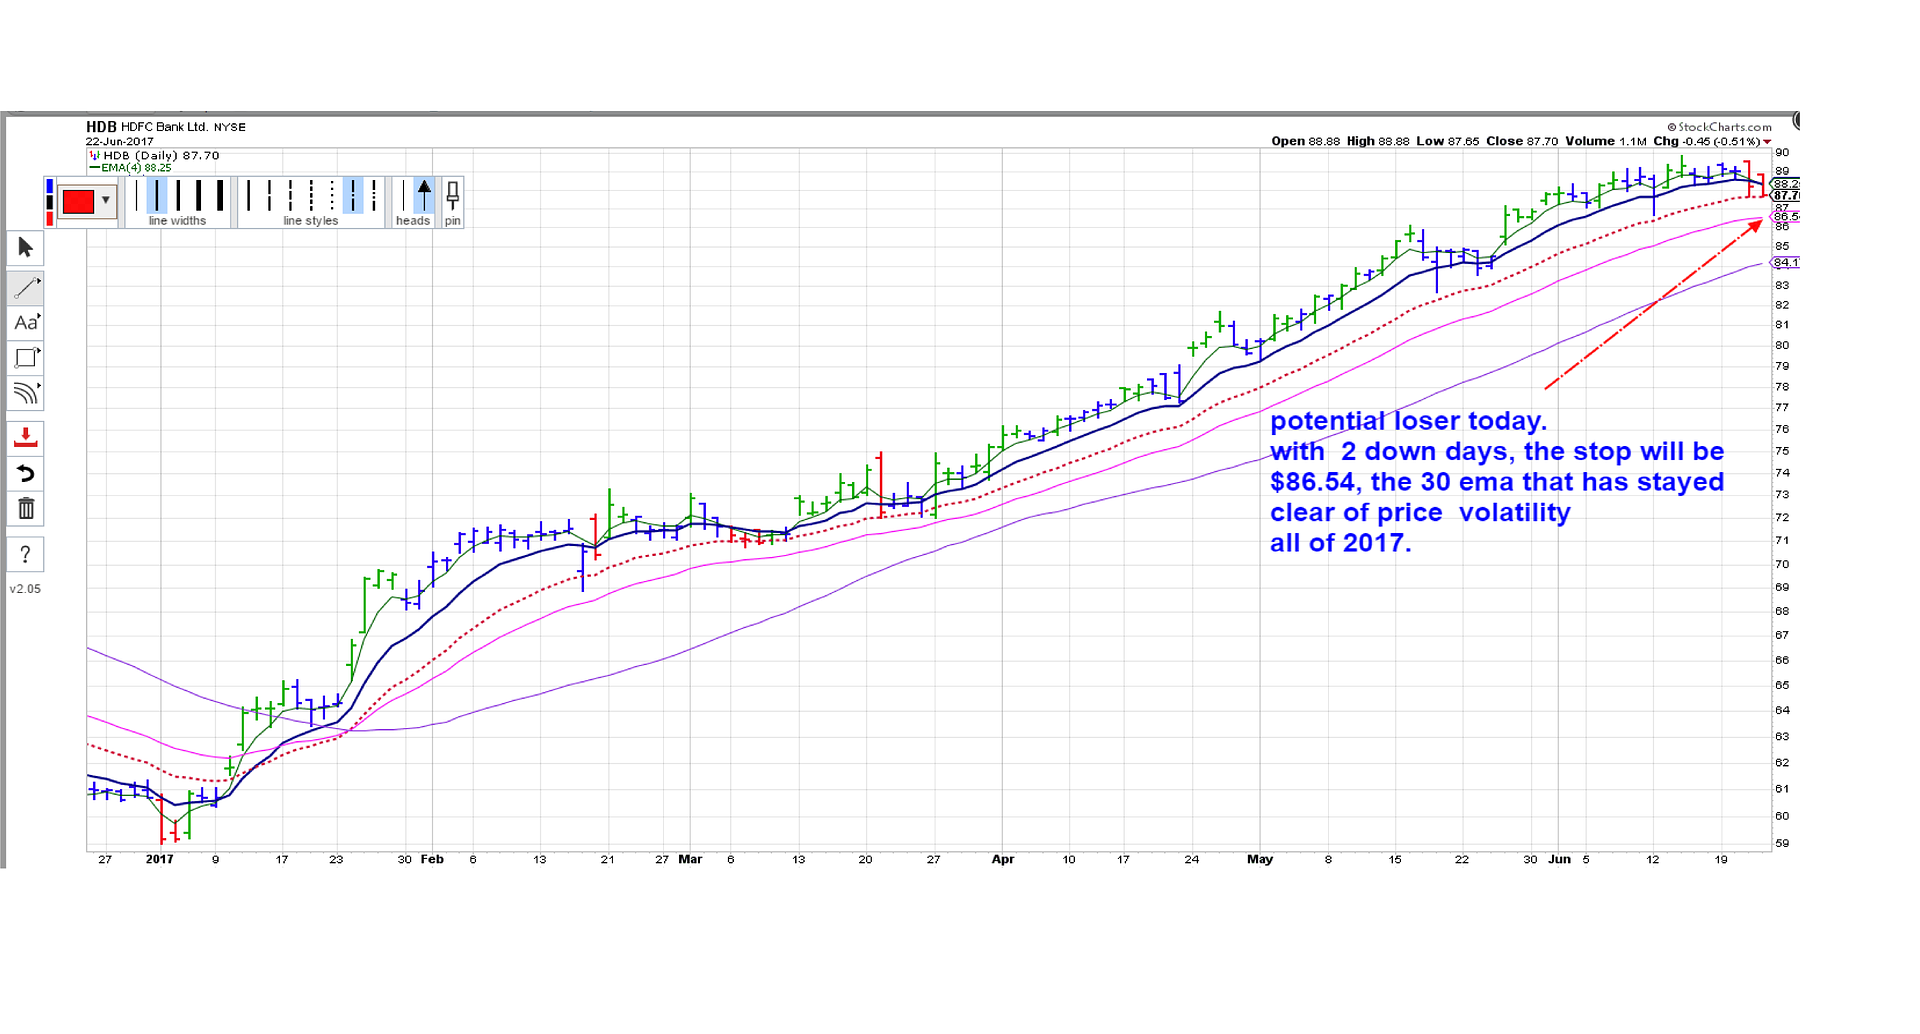
HDB A TRENDING FINANCIAL -ADR
Solid uptrend in 2017- Putting in 2 consecutive red bar days, pressuring the ema's- setting my stop-loss at the wider 30 ema - hadn't been touched the past 6 months.
have to see if the momentum fades out and price dips lower...
|
|
|
|
Post by sd on Jun 23, 2017 14:35:35 GMT -5
Pre-close trade notes-
Bought some individual stocks- ALGN, NFLX, AKAM, and NVCR- cancer treatment saw on CNBC this pm.
In one longer term account- added TQQQ, TLT, SPLV, XLU- The TQQQ is the sizzle... This is targeted to be a longer term partial portfolio- ideally .
|
|
|
|
Post by sd on Jun 24, 2017 10:06:53 GMT -5
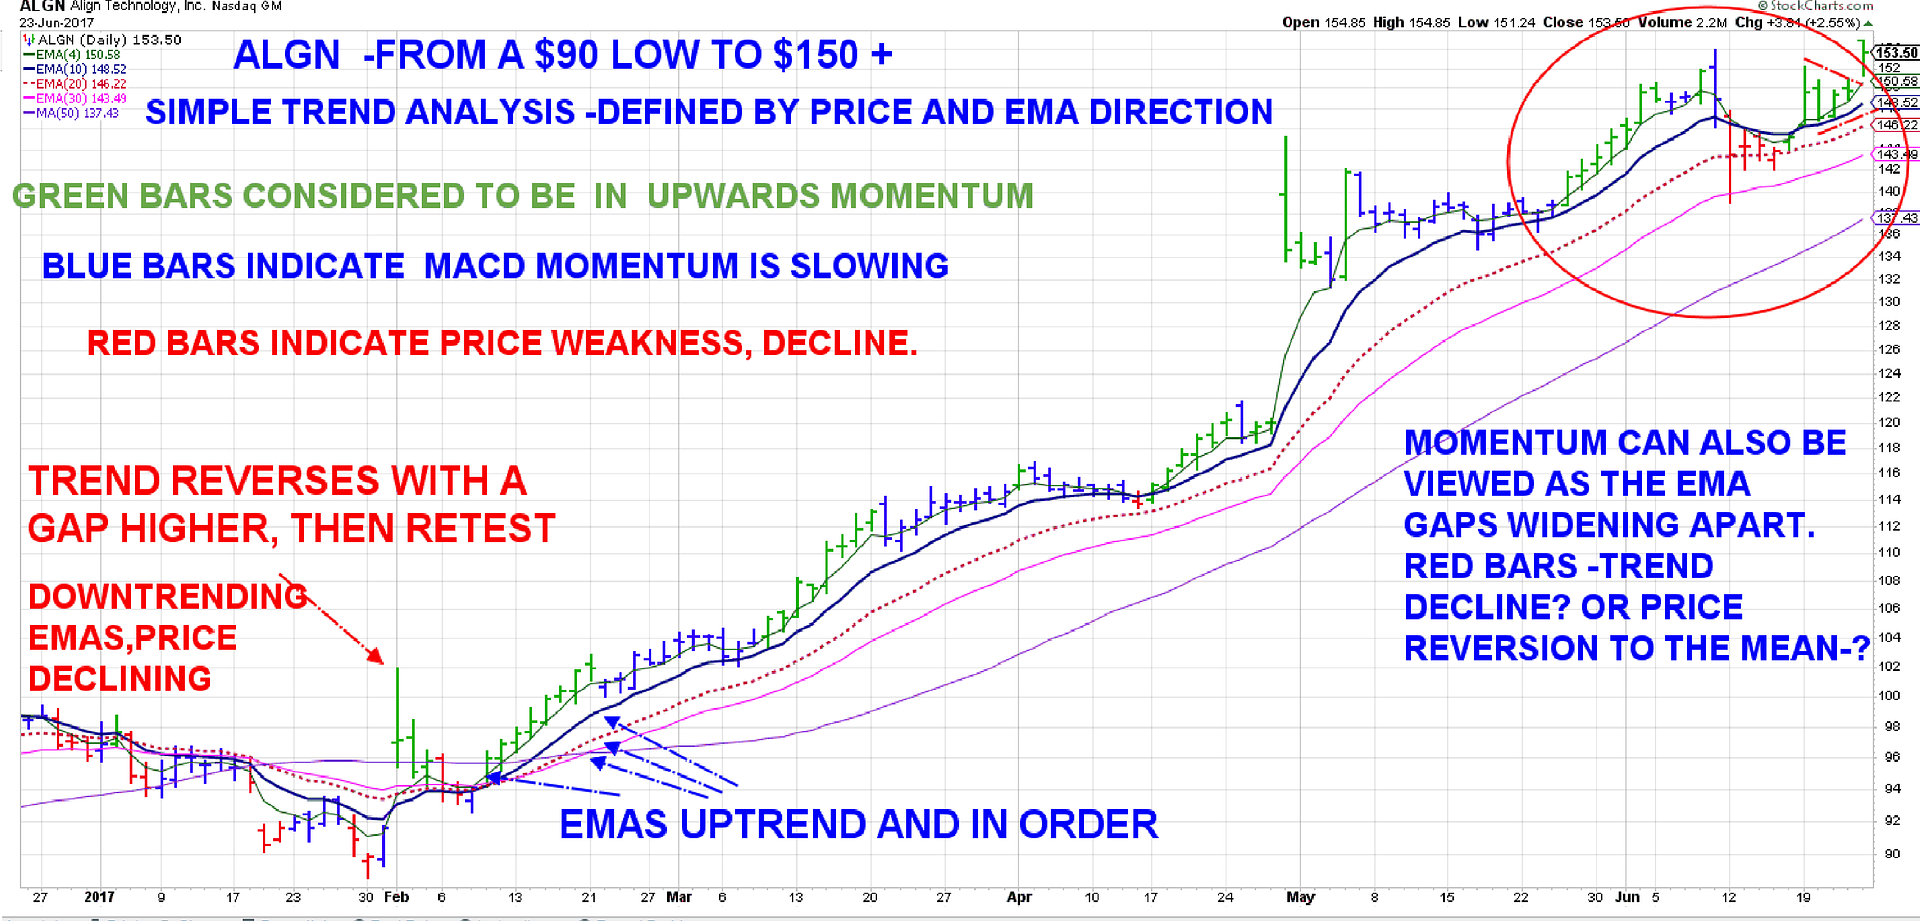
took a new position in ALGN Friday 6.23.17 .
I'm bothered somewhat by the stop out in GLYC as i must have raised the stop for no valid reason- I also stopped out for a gain in MRAM on a tightened stop- and perhaps that was not a bad trade due to the drop down penetration of price----on a 2nd red bar with a volatile stock.... but, that's another discussion for another day...
When I review a chart like this, it's as much an exercise in chart study and a study of what I would have likely done -if I had taken a position early on ? - would i have held as the momentum went from green to blue bars? bailed out on the red? wait for a price close under the fast ema to set the stop? where would I have taken partial profits?
Focusing on each individual daily bar - Is that necessary as long as the trend is still intact and moving higher? When the momentum pauses -as it usually does- is it beneficial to exit and goi onto another trade- or in this chart- some of those pauses break out quickly higher.
If price is trending, it's pretty much holding and usually closing above the fast ema-
In the chart example here, it employs a MACD momentum evaluation to color code the bars-Green trending with momentum, blue to slowing momentum, and red for declining/drop below the 0 line .
Note that green bars usually close above the fast ema, blue bars can still move higher, but often penetrate the fast ema, and red bars indicate a decline in price and possibly a stall in upwards momentum. This chart is from Stockcharts -Elder Impulse...http://stockcharts.com/school/doku.php?st=elder+impulse&id=chart_school:chart_analysis:elder_impulse_system
Other than the price bars and their color coding- worth noting is the emas also widening as momentum increases, and narrowing and coming closer as momentum slows-
A good study is to consider- backtesting the approach - and the stop-loss rules and reentry rules in something that trended so well, and then comparing the similar rules on a more volatile
stock-
1.Very Aggressive stop-loss - based on individual price action
2. trailing stop-loss on price to trend using a closing price below the fast ema
3. trailing stop-loss on price to trend using a slower ema as the trailing stop
3. trailing a stop-loss gradually wider-as the trade gets moe profitable, goal being to get the stop beyond break-even
4. use a combination of more than 1 method together- with the position taking partial profits, faster and slower stop-...
|
|
|
|
Post by sd on Jun 28, 2017 8:46:26 GMT -5
My approach with holding wider stop-losses is getting tested this week- Tech rotation from the sell-oof previously has not recovered- this could be the sign of a top is already in place for tech as the q's are approaching the lows made 2 weeks ago. I'm not reacting yet- will see how the market does later in the day, and perhaps how it closes.
I will reevaluate today, but I only have a few positions still in the green , the remainder will be losers if sold at today's prices-
|
|
|
|
Post by sd on Jun 30, 2017 9:38:50 GMT -5
6.30. am note- MU stops out $30.57 on a sell-of after what at first appeared to be an earnings beat...
|
|
|
|
Post by sd on Jun 30, 2017 18:22:59 GMT -5
Added a few positions going into the close-
AAOI - sold off with Tech, but has bounced from a dbl base- Using the dbl base as the line in the sand and stop-loss directly below-
I like this set-up - Price is relatively close to the POF- Point of Failure-where you can assume the trade fails if it goes below the perceived support level- in this example 58.00
I also added to the MD trade- it has performed well, and was a Reversal of Trend trade with a good base period- Believe it was RD's horse weeks ago ...
Edit note-MD Has gained 7% - and is holding at a prior support during the decline in May. Instead of selling some for partial profits here, I added to the position thinking that it can potentially move through this resistance level- target upper 60's . Split stops, above the entry to net some gain should price decline and reduce the loss of today's entry the stop is perhaps tighter- and i may set the position At a $58 stop and allow price some initial leeway...
I was searching for another trade, somewhat rushed- selected TVTY .
TVTY HAS BEEN TRENDING for several months- I don't know how this or MD will be affected by the political indecision around healthcare reform/obamacare.
I highlighted the chart with those basing levels that price uses to consolidate before making a move higher in the trend.
the prior week's base area- with the yellow highlight- should provide a support area- if the trend is to continue higher.
If price stalls , volatility may push it down through the most recent range into the yellow prior range-
As i view the chart, price has been penetrating the 10 ema periodically, but closing above. The fast 4 ema is uptrending and in parallel- and not extended away rom the 10.
Note that wide moves such as in May pulls the emas apart- and price always comes back -eventually -The ema cross lower in May made a new swing low as it retested the strength of the May breakout with a relatively modest pullback to the 20 ema. I selected this trade based on the chart and using the Finviz sector after viewing MD - and clicking on the industry group, sorting by the % Change, in order of better performers. liked the chart, and the Uptrend-
The MU Trade stopped out for a minor gain just above my entry- Haven't tallied the damage done this week.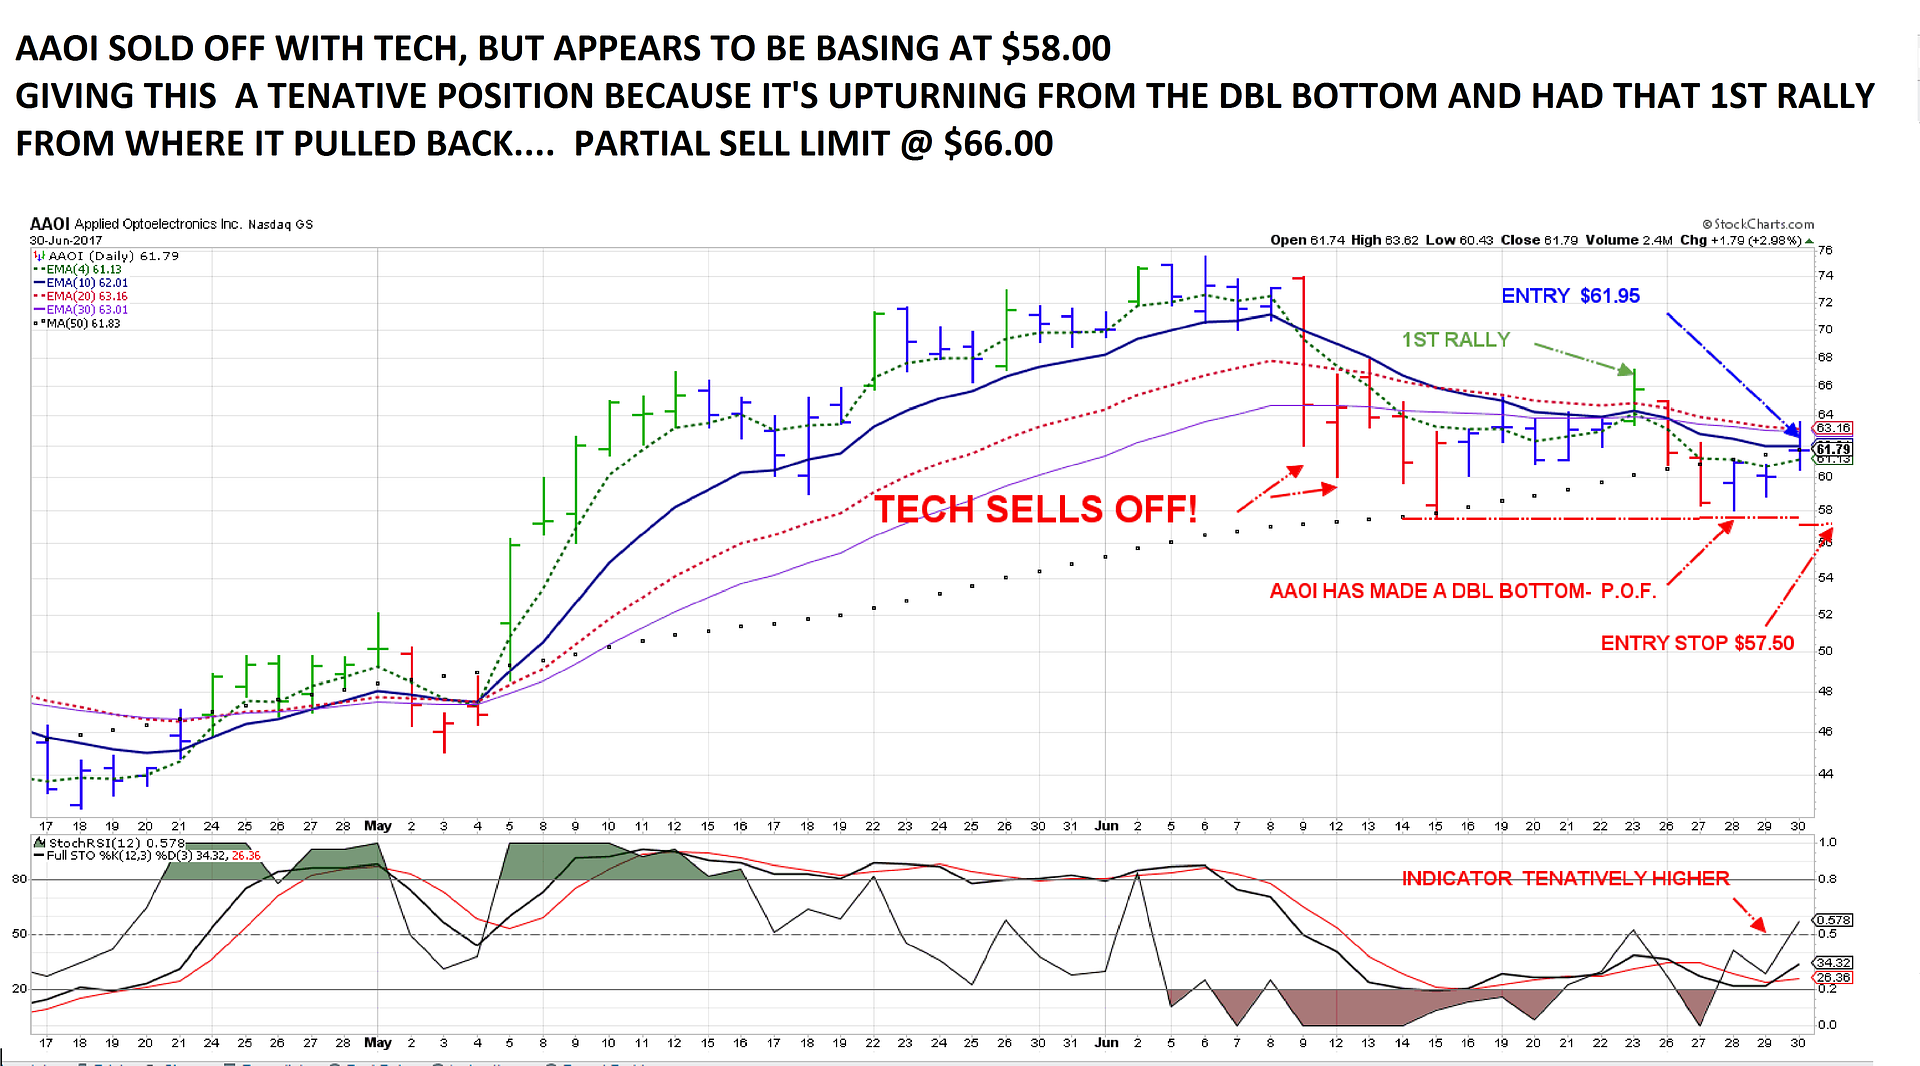 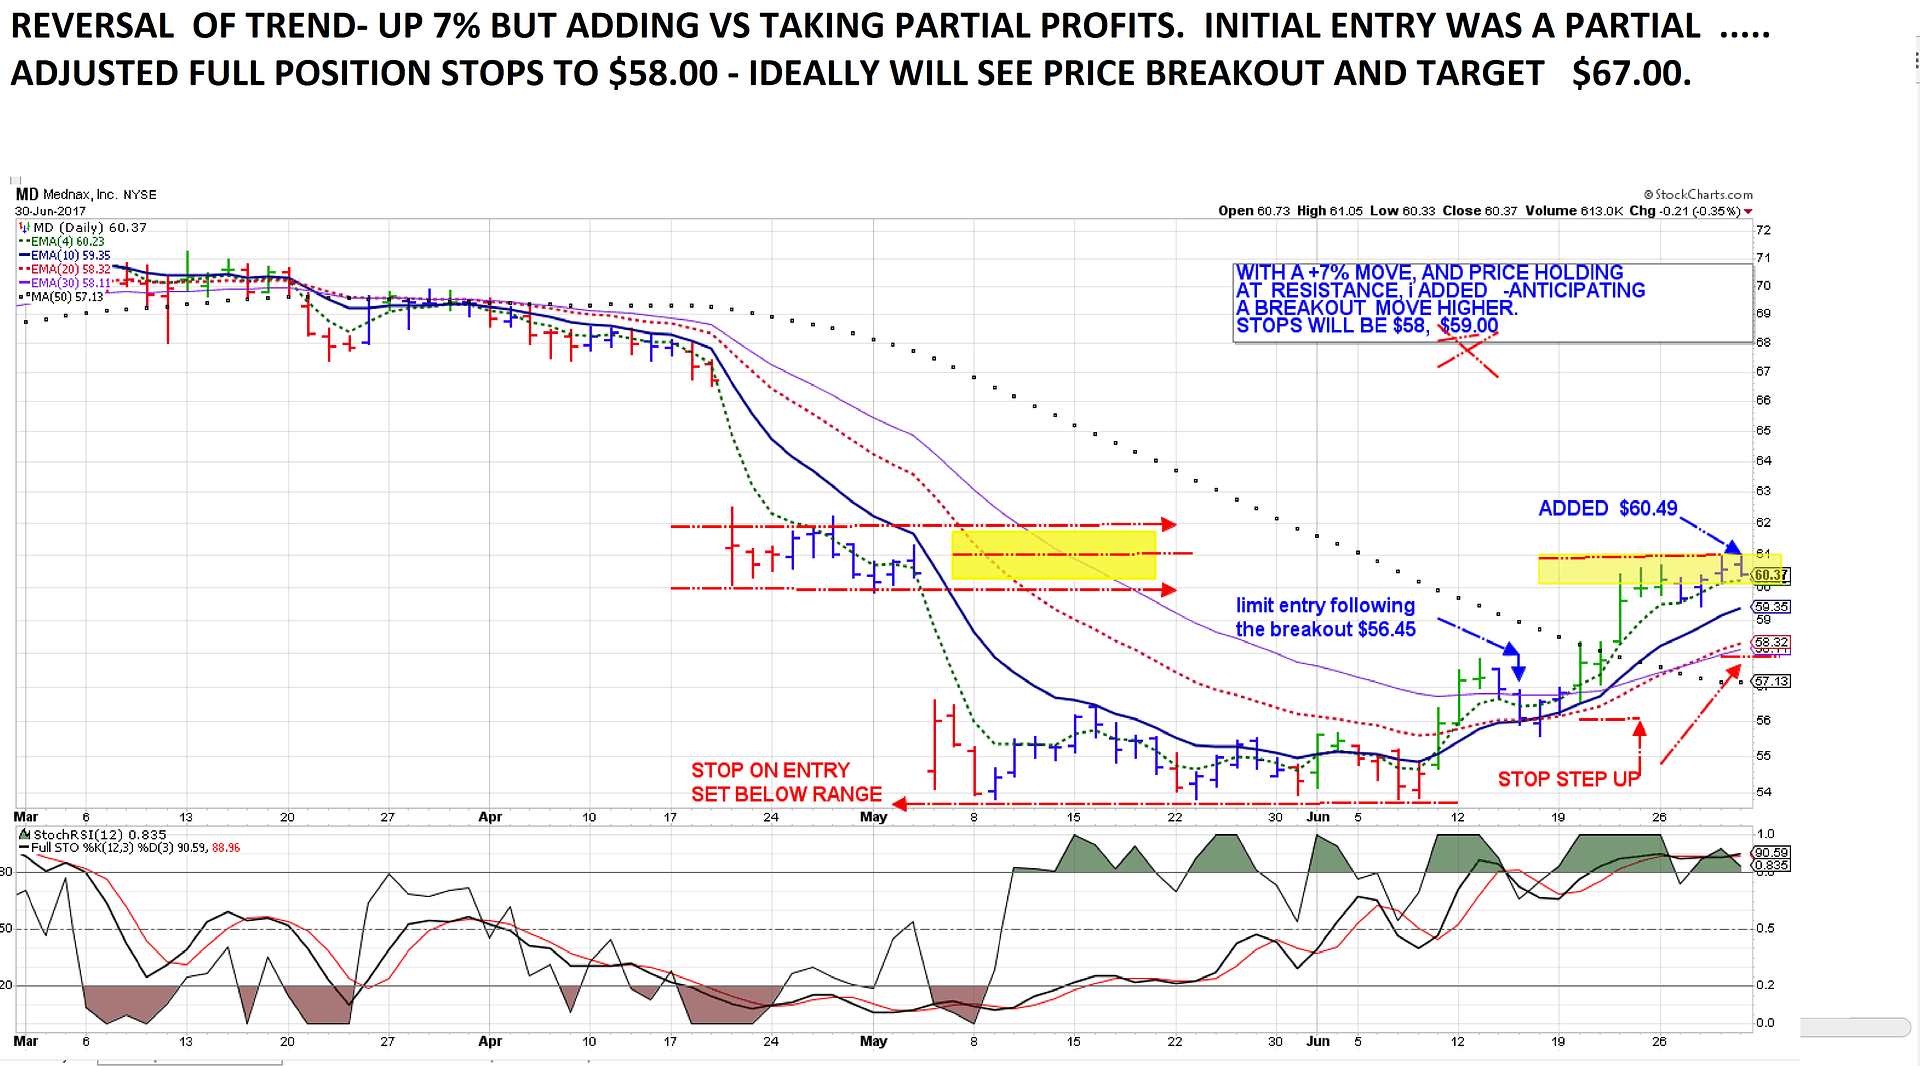 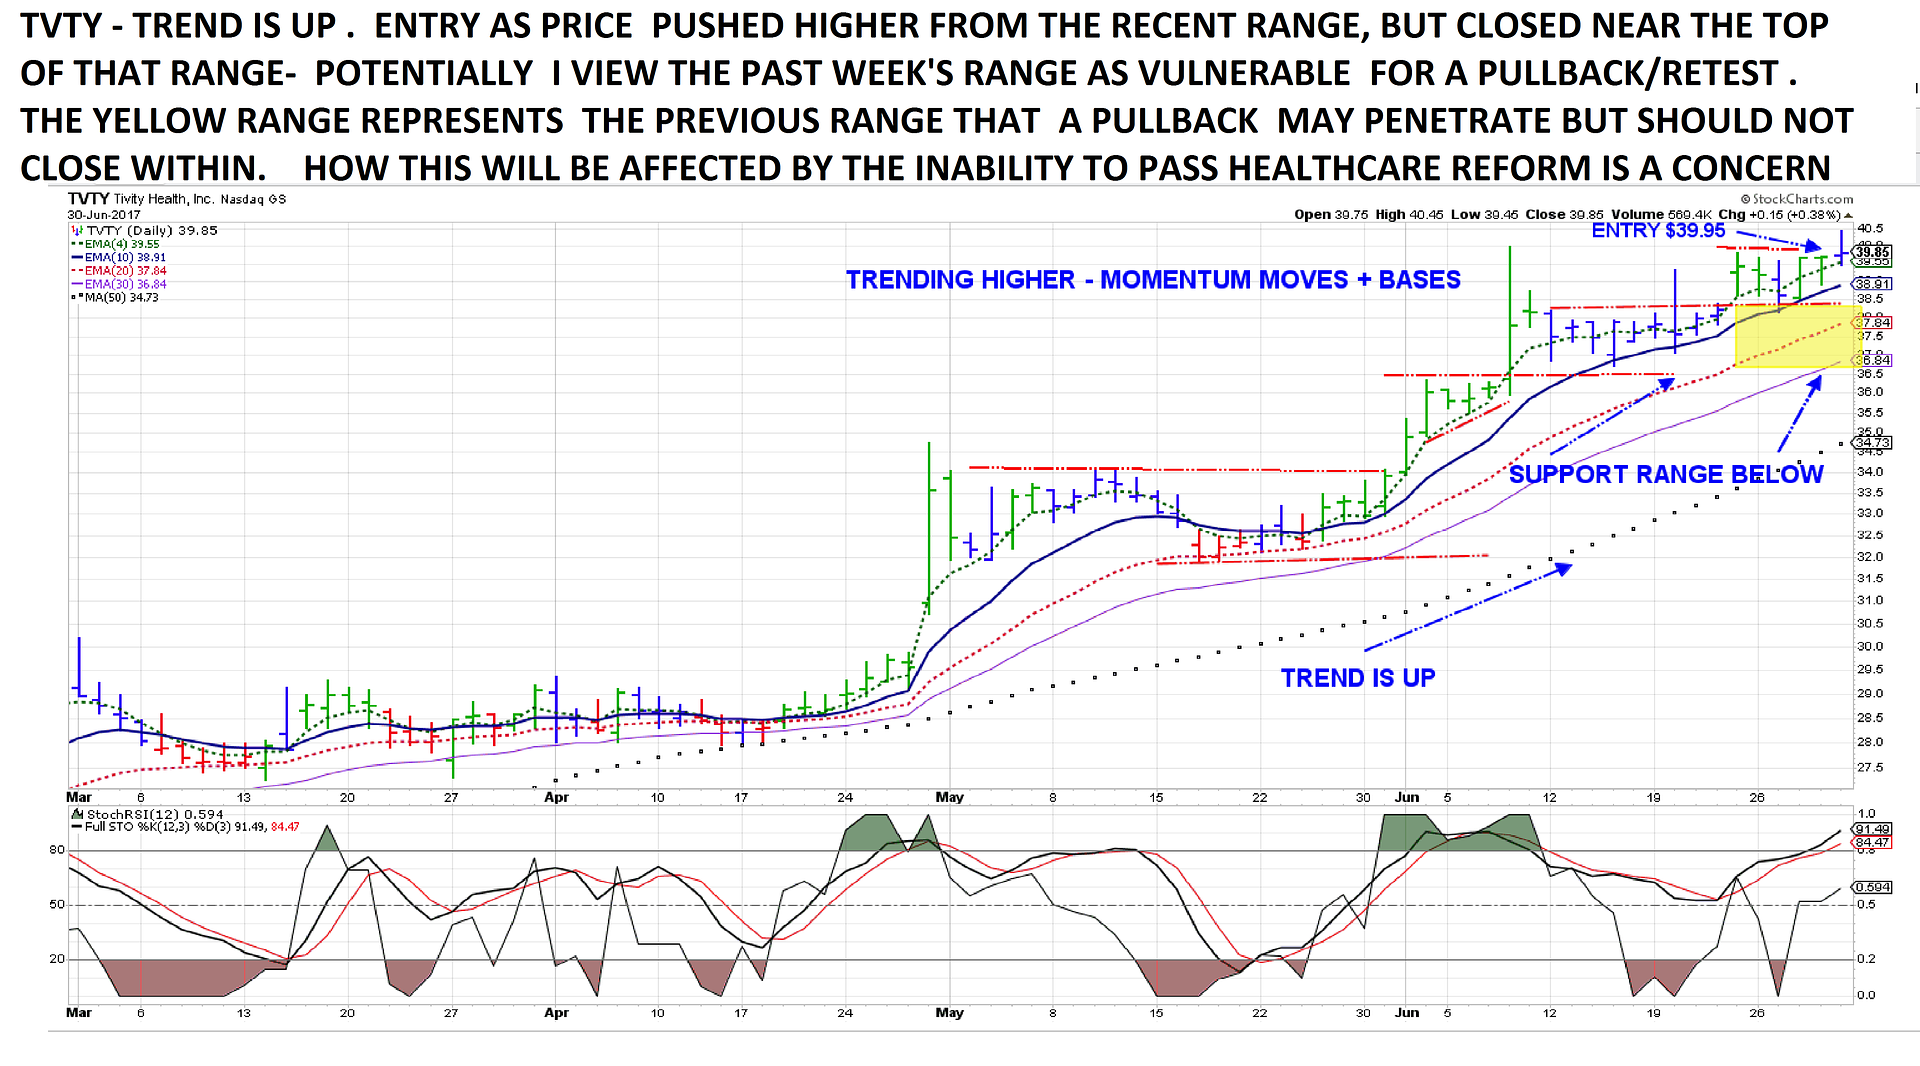
|
|
|
|
Post by sd on Jul 5, 2017 11:24:43 GMT -5
Historical mention- From Tom Bowley artice on Stockcharts
"
July is a strange month for NASDAQ performance. Since 1971, the first ten days of July have produced annualized returns of -1.89%. However, July 11th through the 17th have produced annualized gains of 58.91%, most likely due to earnings expectations. We'll see if this past seasonal trend holds true again this year."
mid day 7.5.17 note....Seeing NVR breaking out today- I entered after seeing the CEO on Cramer last week...Nice uptrend- XBI higher slightly from it's pullback...PBYI still holding it's higher base. VRTX has been holding with a base at 126.50-127.00
Getting a bit impatient- q's are trying to make an upside move after putting in a recent low today in this decline-MD weak, and TVTY weak today- Saw that MRAM (no longer a position) is up today.
|
|
|
|
Post by sd on Jul 6, 2017 9:10:47 GMT -5
wHILE TECH HAD a good day yesterday, MRAM breaking higher- AMD reversing- In spite of that- prices are still technically trending in both of these despite the consolidation and pullback swings in AMD- I set limit orders for a fill on a price pullback on both- LMT intended to use $12.68 lmt-price hit a low of 12.67 this aqm- My actual fill cost is $12.83- I must have tweaked the order lsst minute- or that includes commission charges- MRAM -like most tech pulling back...SMH having an inside day - biotech weak-
|
|


