|
|
Post by sd on Dec 18, 2016 15:37:39 GMT -5
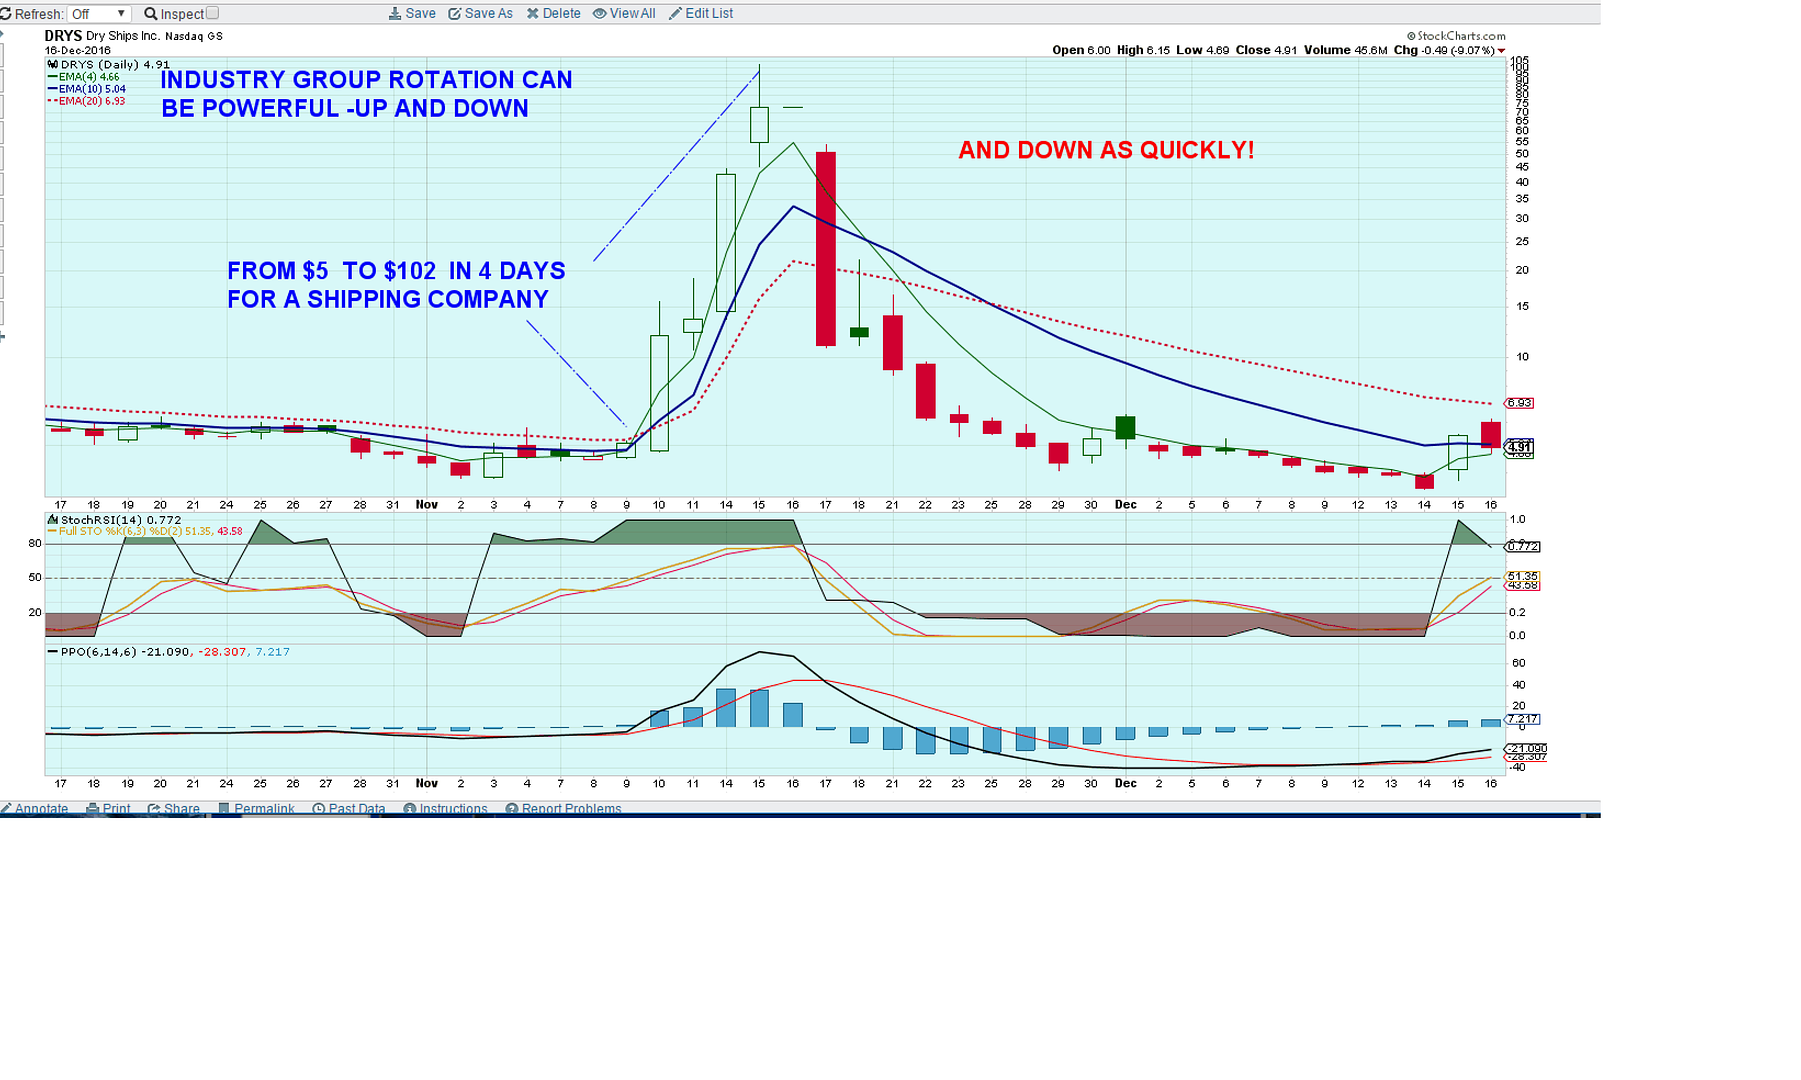
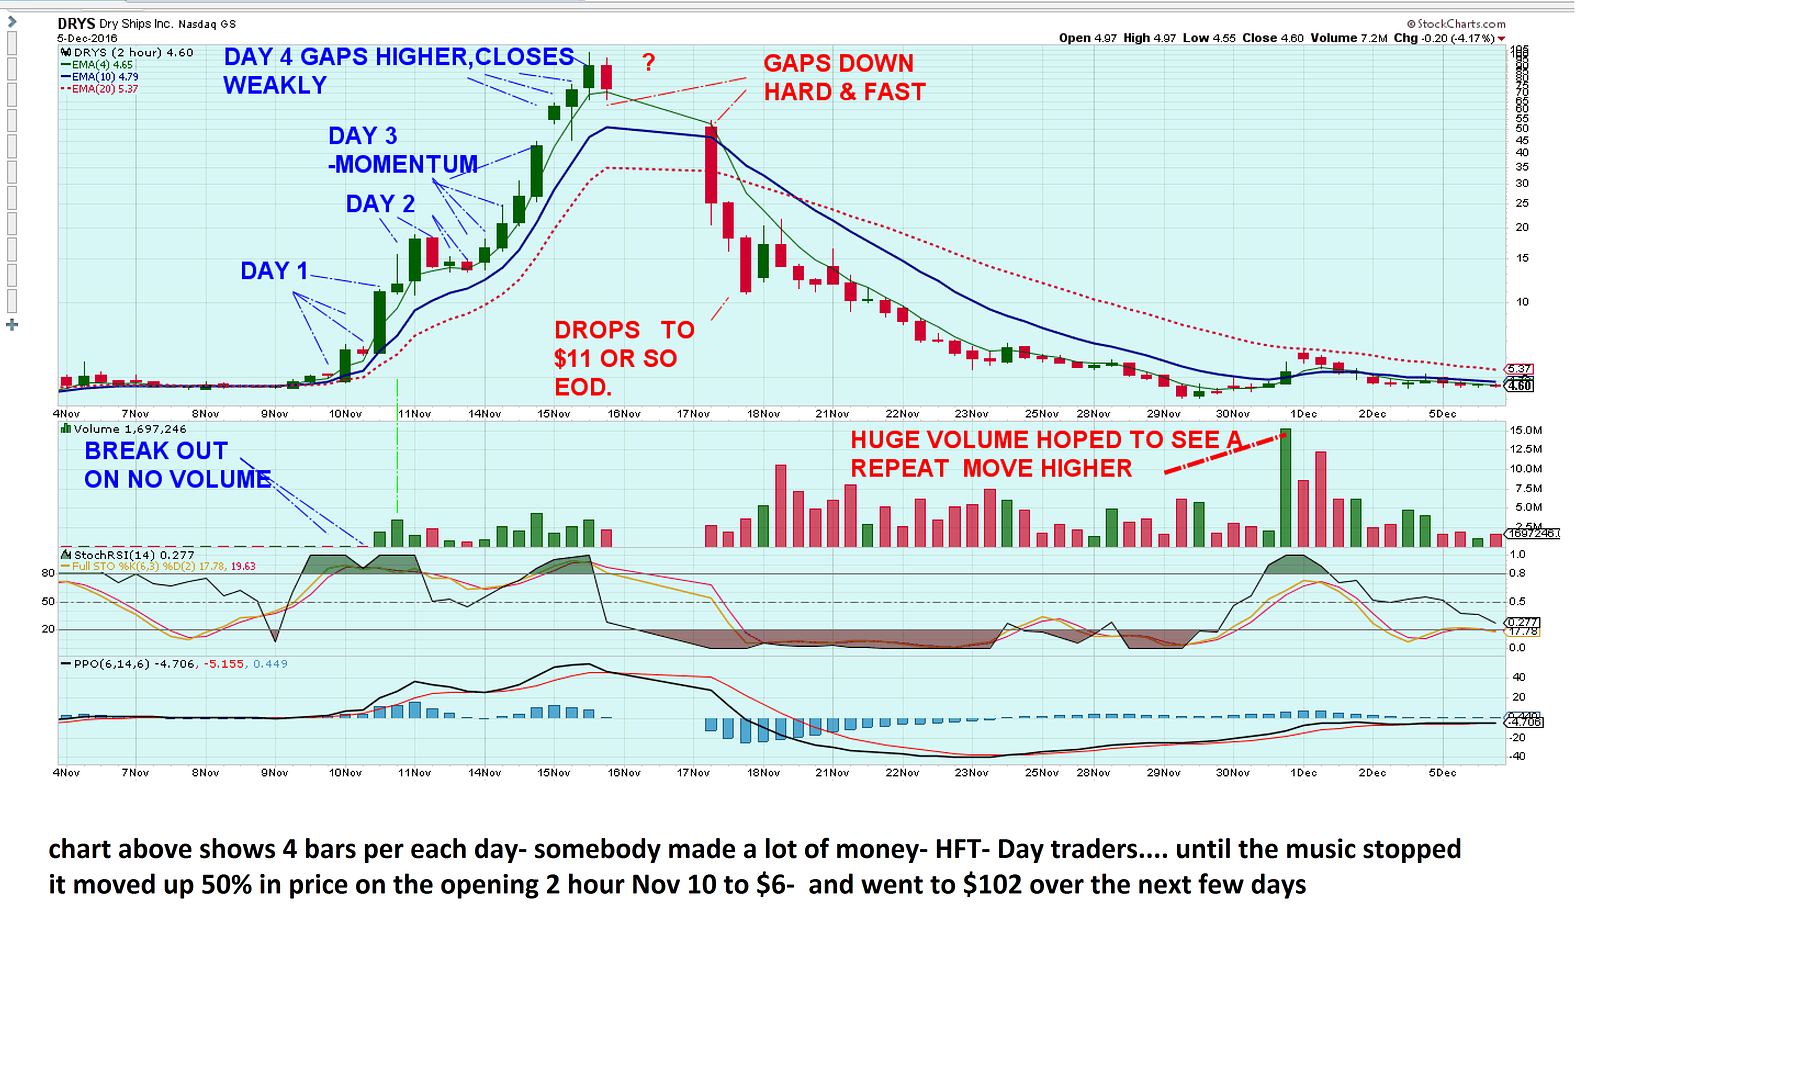
I have to add in a chart of a global shipper- DRYS- back in November- Some 18 shipping stocks moved parabolically over a few days- out of 58 in the industry group. how about a move from $5 to over $100 on a tanker company? and back again. Some obviously shipped different products and got no attention....
It illustrates how a market rotation can bring in all the momentum players- Daytraders, HFT etc, and push things beyond anyone's expectations- or valuations. This multiple chart comparison of stocks in an Industry group is another aspect of Finviz I am really appreciating.
a daily chart and then a closer look at a 2 hour chart.Reminds me of the Tech bubble!
  |
|
|
|
Post by sd on Dec 18, 2016 19:43:39 GMT -5
WOW! Christmas is next week- THE YEAR IS ALMOST GONE! it's occasionally frustrating to not be in touch with what occurs in the markets on a daily basis- but-one has to be careful what they wish for - I'll be transferred to a different new project starting 2017 , likely with a longer day and a 6 day workweek as the new "Normal ". Luckier than many my age ....
Spending what "free" time i have more efficiently is a good goal- and making profits- and to that end I have been seeking some ways to accomplish both of those goals. I decided i would sample Vector Vest- for $9.95 for 1 month- to see if it would be worth the $60/month basic .
It's essentially a screener that also combines fundamentals with Technicals, and provides some recommendations - including Buy, Sell, Hold.
Using Friday's screen of better performing Industry groups, includes mining, healthcare, retail, business, personal....and each 9 top performers are listed in each group .
In the Healthcare- facilities group, KND, CSU, NHC, GEN looked to be the best from a chart standpoint. NHC looks strong and trending, Gen potentially a breakout higher- CSU in a slight consolidation, but looks weak, KND looks ready to toe step higher- would be my #3 pick in the group. Only 2 stocks in the group meet VV's "BUY" rating ENSG, and FVE. neither of which i was impressed with.,but i found the narrowed field of 9 in the industry group useful as a real time saver .
They have multiple types of screens , that would organize the data and perhaps return other stocks altogether- But for a start,
3 decent prospects to select from- i'm inclined to choose the leader-
As part of the selection process, I step out to check the weekly charts, and find that NHC is ripping higher, GEN, multi weeks higher, KND just higher in the past 2 weeks, ENSG-higher but choppy the past 5 weeks.The others still downtrending-
So, my 1st assessment is that the Buy rating perhaps should not be blindly followed.
|
|
|
|
Post by sd on Dec 19, 2016 20:49:45 GMT -5
Had some fills today- Added to NVDA position, filled on my partial on EW limit, small tracking positions in NHC,KND, GEN, Kelya.
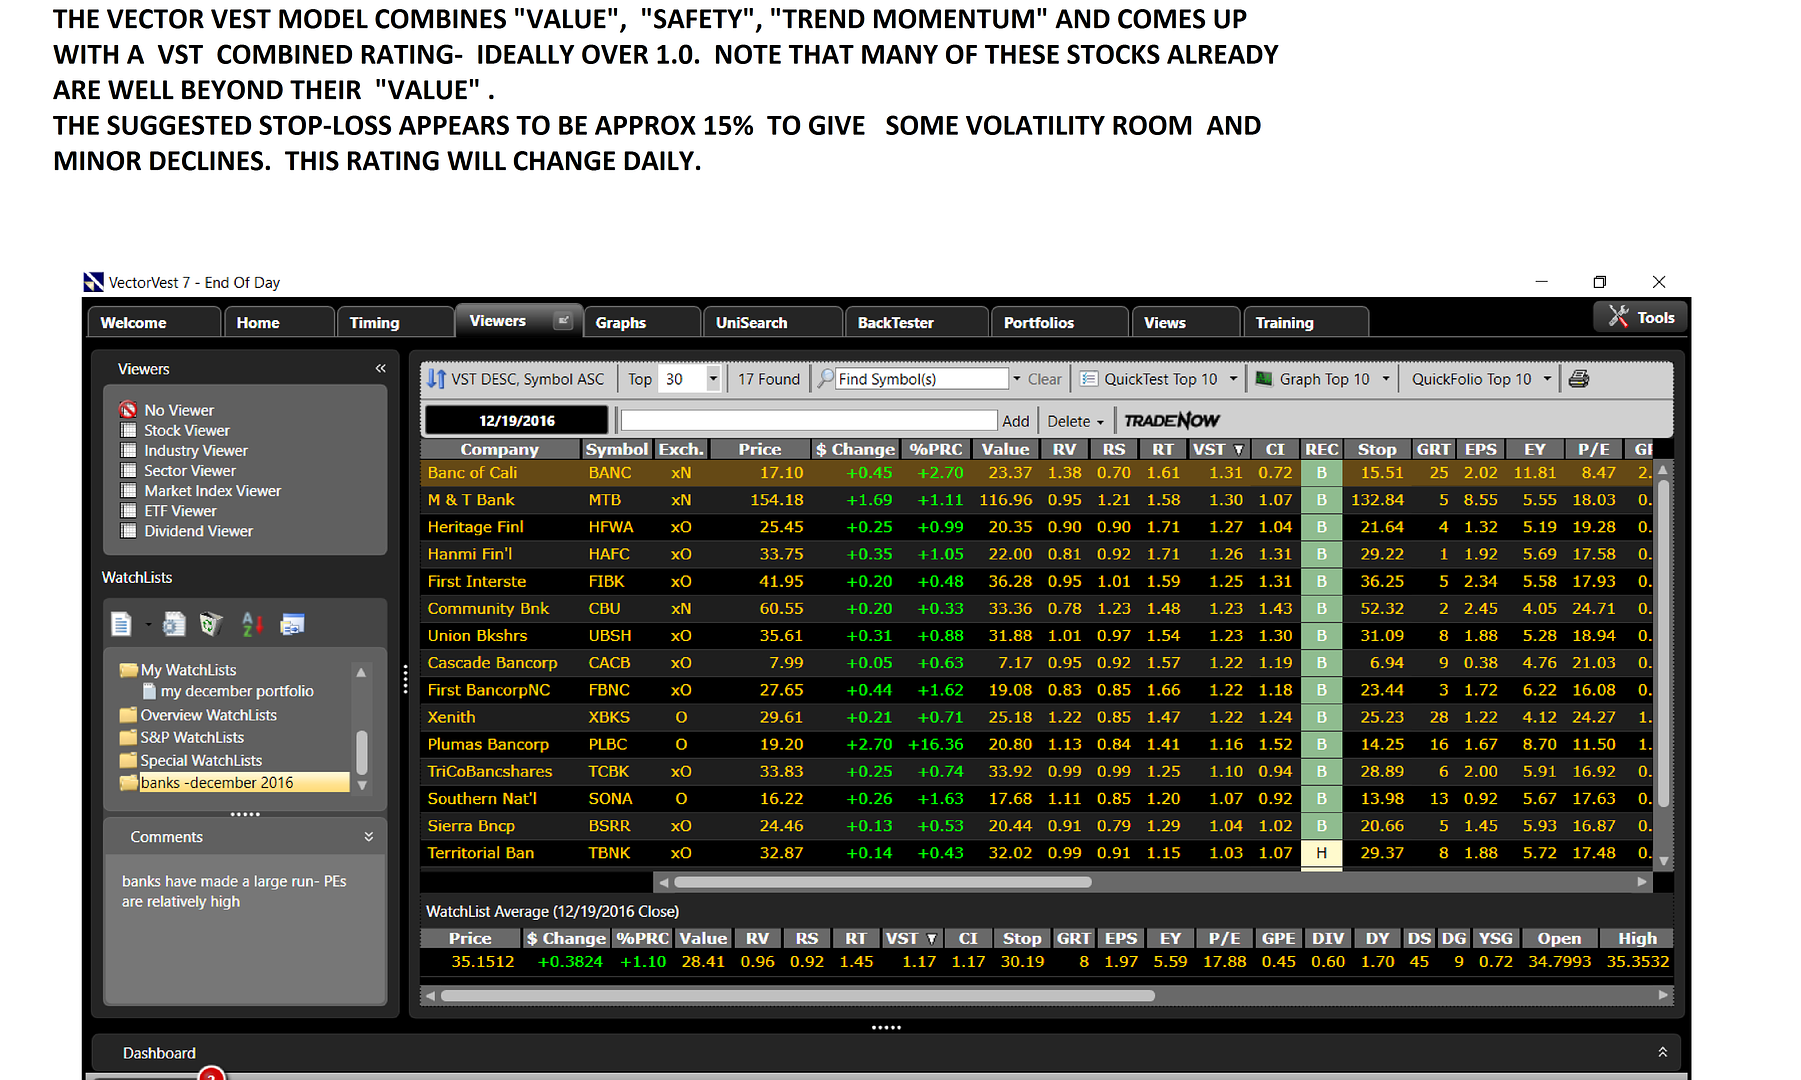
I noticed -Finally! - through the Finviz screener- the Huge run up in regional banks- I went through and made a quick list of those who were basing in uptrends- preferring a tighter consolidation .
I put the list in Vector Vest- as part of a learning the VV software- and although few of these banks are undervalued, and some richly so- Many on the list still hold Buy ratings- but with wide 15% or thereabouts stops-
For a non-tech guy like myself, I'm having to go through the lessons-one by one- and i thought this list would be interesting to track how VV performs in the real world. It will change daily, as prices change- What it promotes on it's website is that it takes intrinsic value, momentum and direction, and "safety" to give a combined VST rating- ideally over 1.00. A number of these runners still are well above the 1.00 level- but note that for the majority- the ;present price is still considerably over the "value" price.
I think -as with any screening tool- the precise numbers may not translate into trading success, but it appears to be a robust screener with a value assessment. The lessons are well done, short, and easy to follow.
The 5 week trial is $9.95 for anyone interested in giving it a look. After that the monthly rate goes up starting at $60- and higher depending on intraday or EOD/realtime etc. I may try some breakouts (small positions) in a few of these to see if there is any fuel left.
|
|
|
|
Post by sd on Dec 20, 2016 10:43:05 GMT -5
Bought a small group of the Bank stocks this am 12.20.16,- I had added to the NVDA position, and it gapped higher on today's open- much better than gapping down. i decided to look at other chip stocks, passed on MU and bought AMD-since it's trending higher. I went ahead and bought some CLH-talk about an extended up trend- using funds I had set for adding to EW-Out of cash in the IB account- T is doing well- trending smoothly higher- Owned it for 2 weeks now. Will the Santa Claus rally hold this week? Hope so.
|
|
|
|
Post by sd on Dec 21, 2016 17:39:08 GMT -5
12.21 - quick note- I passed on MU and chose to go with AMD- MU popped up 10% after hours tonight! Luck of the draw!
|
|
|
|
Post by sd on Dec 22, 2016 19:47:41 GMT -5
This is interesting-
With the advent and rising impact of automated investing and rebalancing challenging the higher fees of active management-
there are a number of automated investment strategies out there- A key component is the rebalancing aspect periodically in a portfolio to capture some profits in those areas that have higher gains, and take some of those profits to make value purchases in the unfavored sectors- As the market cycle persists over the long term , this approach is designed to take the emotion out of the hands of the individual investor. Not a bad idea. Similar to Target Date Funds
I have a small account with TDAmeritrade, and Scottrade- and they are merging- With the new Fiduciary standard, my company IRA has to also be changed- and a new brokerage compliant account will accept new monies in 2017- This essentially tells me that the existing arrangement is not compliant with the Fiduciary requirements- meaning it favors the broker rather than me. Not a surprise -
So, this link is not promoting the TD Ameritrade offering at a .30 basis for management- but if it incorporates very low cost funds- and does the rebalancing- that does not seem too onerous . Active management will charge over 1% - and up to 2% .
If your positions are simply dumped in mutual funds, and the fees are eating your profits, you might want to consider some of the low cost- Vanguard- Betterment-Wealthfront - TDAmeritrade type of automated portfolio management. tickertape.tdameritrade.com/investing/2016/10/professional-management-at-lower-cost-25374
|
|
|
|
Post by sd on Dec 24, 2016 14:23:02 GMT -5
Copying a post in the Horse Race 12.24.16 regarding the Investment Race- I truly like the idea as it reflects a different type of mindset- looking forward for something to be in for a year can be a challenge- yet most of us do that one way or another in our company portfolios /IRAs that may be managed by a fund manager etc. Some may invest in individual stocks in theirs, but that had not been an Option -in my company's fund. Blygh will track the invest Race, with quarterly updates- I will supply charts using the weekly format every quarter- possibly more often if i have the time. This is a good opportunity for anyone that wants to throw their hat in the Ring-.It should prove interesting if you think you can make 5 picks that will outperform the market over the next year!
"Proposed rules for the long term investment competition.
During the nest week players should pick 5 stocks (no leveraged ETFs) long or short with the idea of holding them for one year. I will record the opening price for Jan 2 2017, the prices at the end of each quarter and the price on the last day of trading 2017. Stops and limits including buy limits are acceptable. In the case of a buy limit below where a stock is trading, the player only gets that security in his portfolio when it hits the buy stop. The same rule applies with a short limit. "
I'm good with that Blygh- and Congratulations on your overall gains- Looks like you are sitting strong to Win the year! -and Ira did well also!
How about opening another separate thread dedicated just to this longer term Race?
I look forward to the members best ideas for a 5 position investment portfolio- What happens if a position OR TWO gets stopped out in -say- the 1st quarter by a stop-loss? Not to make it more complicated than necessary,and keeping the original 5 picks for better or worse-
instead of making the position stay in cash for the rest of the year, what if - only at the end of each quarter- the stopped out cash was allowed to be put back into the game by a reentry into the same position? Or, a cash position that never filled in the 1st quarter could be adjusted at the end of the quarter? Perhaps the rentry could be changed from a long position to a short position in the original stock only?
By making adjustments available to the portfolio only once a quarter, would indeed be some extra work on your end, but would give some flexibility to manage the portfolio 3 times in the coming year.
Your Thoughts?
I'll keep up with supplying the charts- Perhaps posting them Monthly if time allows....- and I'll be using the Weekly chart to track performance, rather than the daily.
Tracking Ira's prior default pick LMT over the course of the horse race- and it's Up and down swings- prompts me to suggest that I will
test how a moving average crossover exit and entry performs in the various portfolios- and compare the results of that approach with the longer term investment choice approach.
I know everyone is busy this time of year, but I hope we can get good participation for the Investment Race-Guests as well-
Just 5 picks and a post gets you skin in the game! Join in, the more the Merrier!
|
|
|
|
Post by sd on Dec 24, 2016 16:05:53 GMT -5
Some thoughts on the Investment Race-
I want to have a diversified portfolio- and include some international exposure- a year is a long time .
What is up today , could be down next month, so some diversification in the 5 positions makes sense.
I also don't want exposure only to the US markets.
My 1st portfolio considerations would be using ETF's - spreads the risk and adds greater diversity within each group.
QQQ- Tech sector- Up for the year, but not in favor. There has been a lot of selling in Tech-
IJJ -US Mid cap value-
FNDA- US SMALL CAP
HEDJ - I want exposure to Europe and hedge the currency differential.
TDIV- GLOBAL Technology- If global growth improves, this should benefit.
I was going to consider exposure to emerging markets- such a sharp decline- that I would have bracketed this entry with a lower limit entry and then a buy-stop if it reversed and moved higher without hitting my limit. But I'll pass.
www.etf.com/channels/smart-beta-etfs
|
|
|
|
Post by sd on Dec 26, 2016 10:59:24 GMT -5
AS I am going over the trades made in 2016- Starting with the A's ....I'm listing both the Daily and then the Weekly charts in stockcharts.
A-loser, AAPL loser , AKAM- ahh - a winner- a better Textbook short term TA based trade i executed in 2016-
I had not been following AKAM in the prior weeks - and as the chart shows, it had had a decline until August, a move higher to $55, a pullback to $51- making a higher swing low from the August low. It then moved back up and pushed higher- to $56 , shallow retrace to $54,53, -
O'Neil would call this a Cup & Handle- and it then gapped up to the resistance at $56.00 I noticed AKAM the day prior- felt it was a lower Risk trade entering before the breakout level, closer to the prior swing low.
I had a Buy order filled as it gapped higher- The prior higher swing low made a well defined area for a stop-loss, and a second attempt at a breakout would be expected . Typically, I would have used a breakout above the $56 for an entry.
It worked out better than anticipated, moving sharply up -never retracing the breakout, never closing below the fast ema- all positive momentum signs.
on 10-26 it gapped higher,moved up higher the following 2 days, then gave a red topping tail candle. meaning it had opened higher- pushed up even higher, but closed the day lower- Not enough buying momentum to keep buyers willing to pay more. Realizing that this was a parabolic up move ,and unsustainable over the longer term, (note the widening gap between the 2 emas) , I set a stop loss just at the bottom of the prior bullish candle-
just in case there could be room to run higher yet- In this case, price pulled back and I was stopped out for +21% gain over a 10 day hold.
This proved to be timely, as price declined -10% over the next month, and is now in a sideways range-
Later, I will get around to posting some of my poor trades- I have many i could share-
Posting this is a positive reinforcement for myself that "Good Trades" are both winning trades as well as Losing trades when they are well executed to a planned entry, stop- and exit.
Weekly 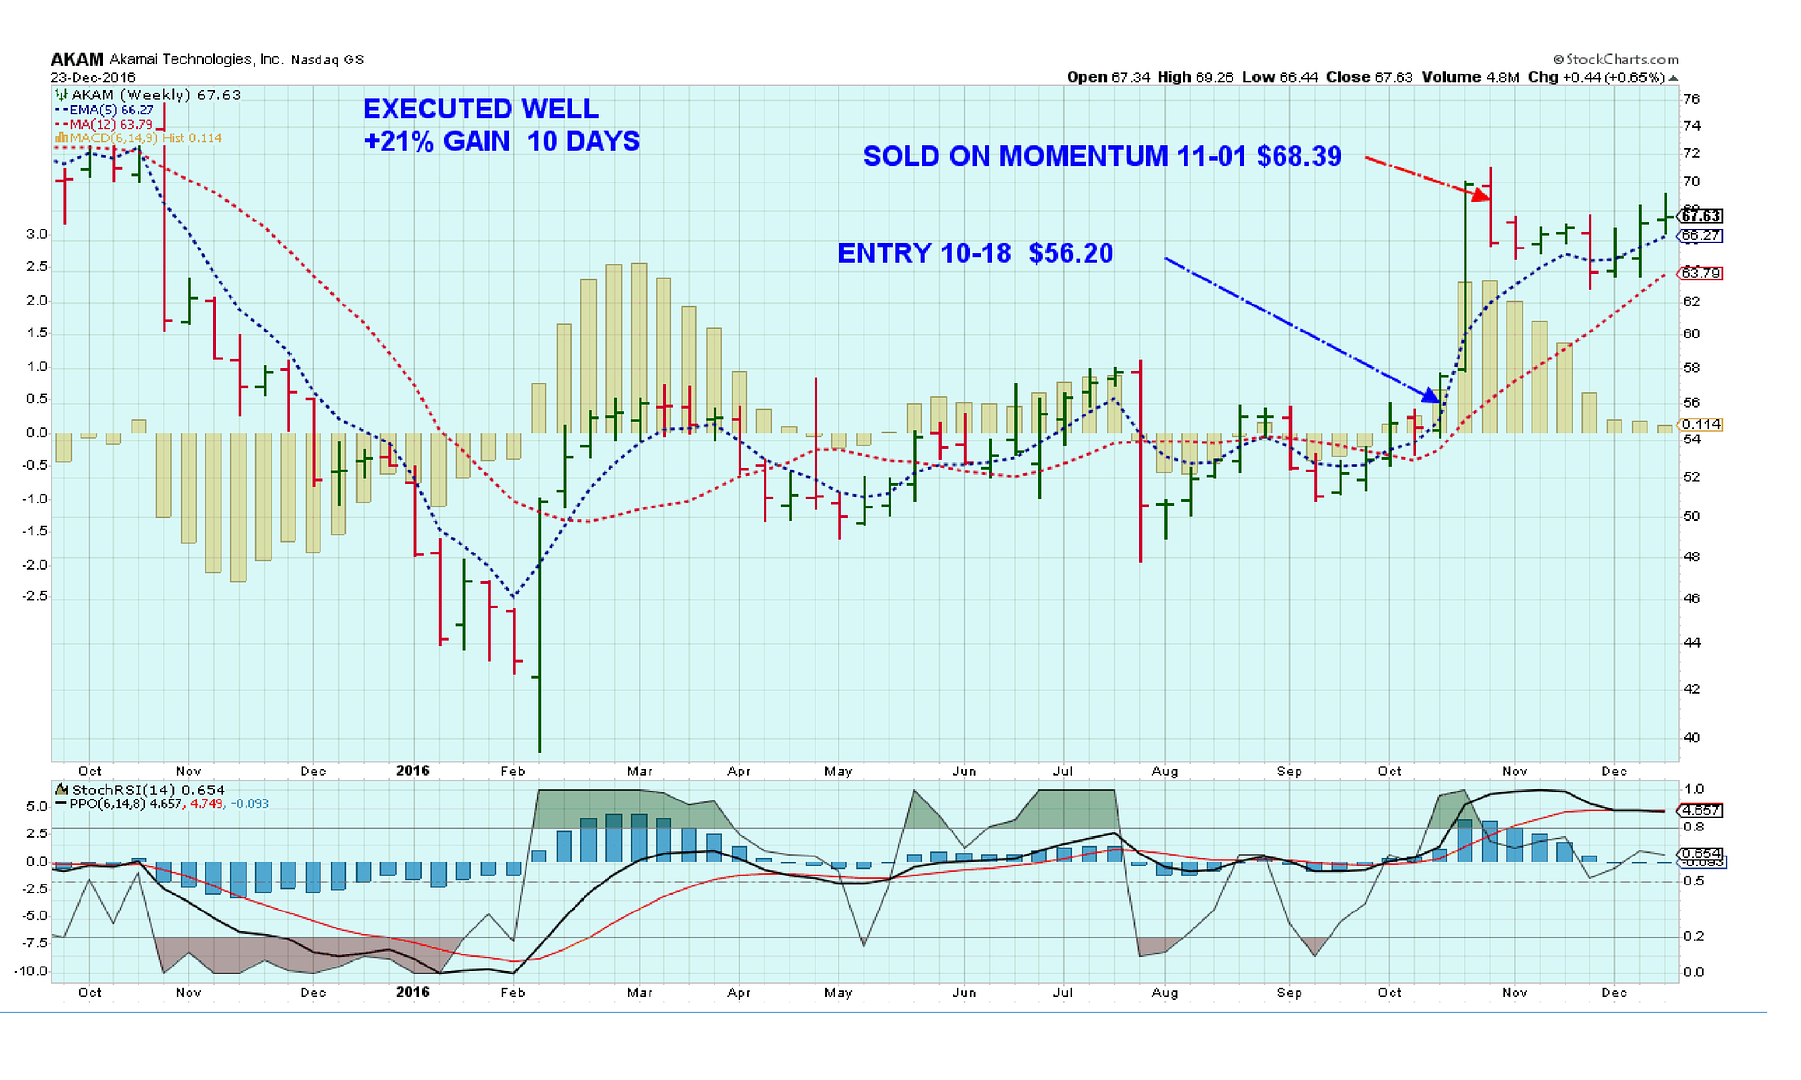 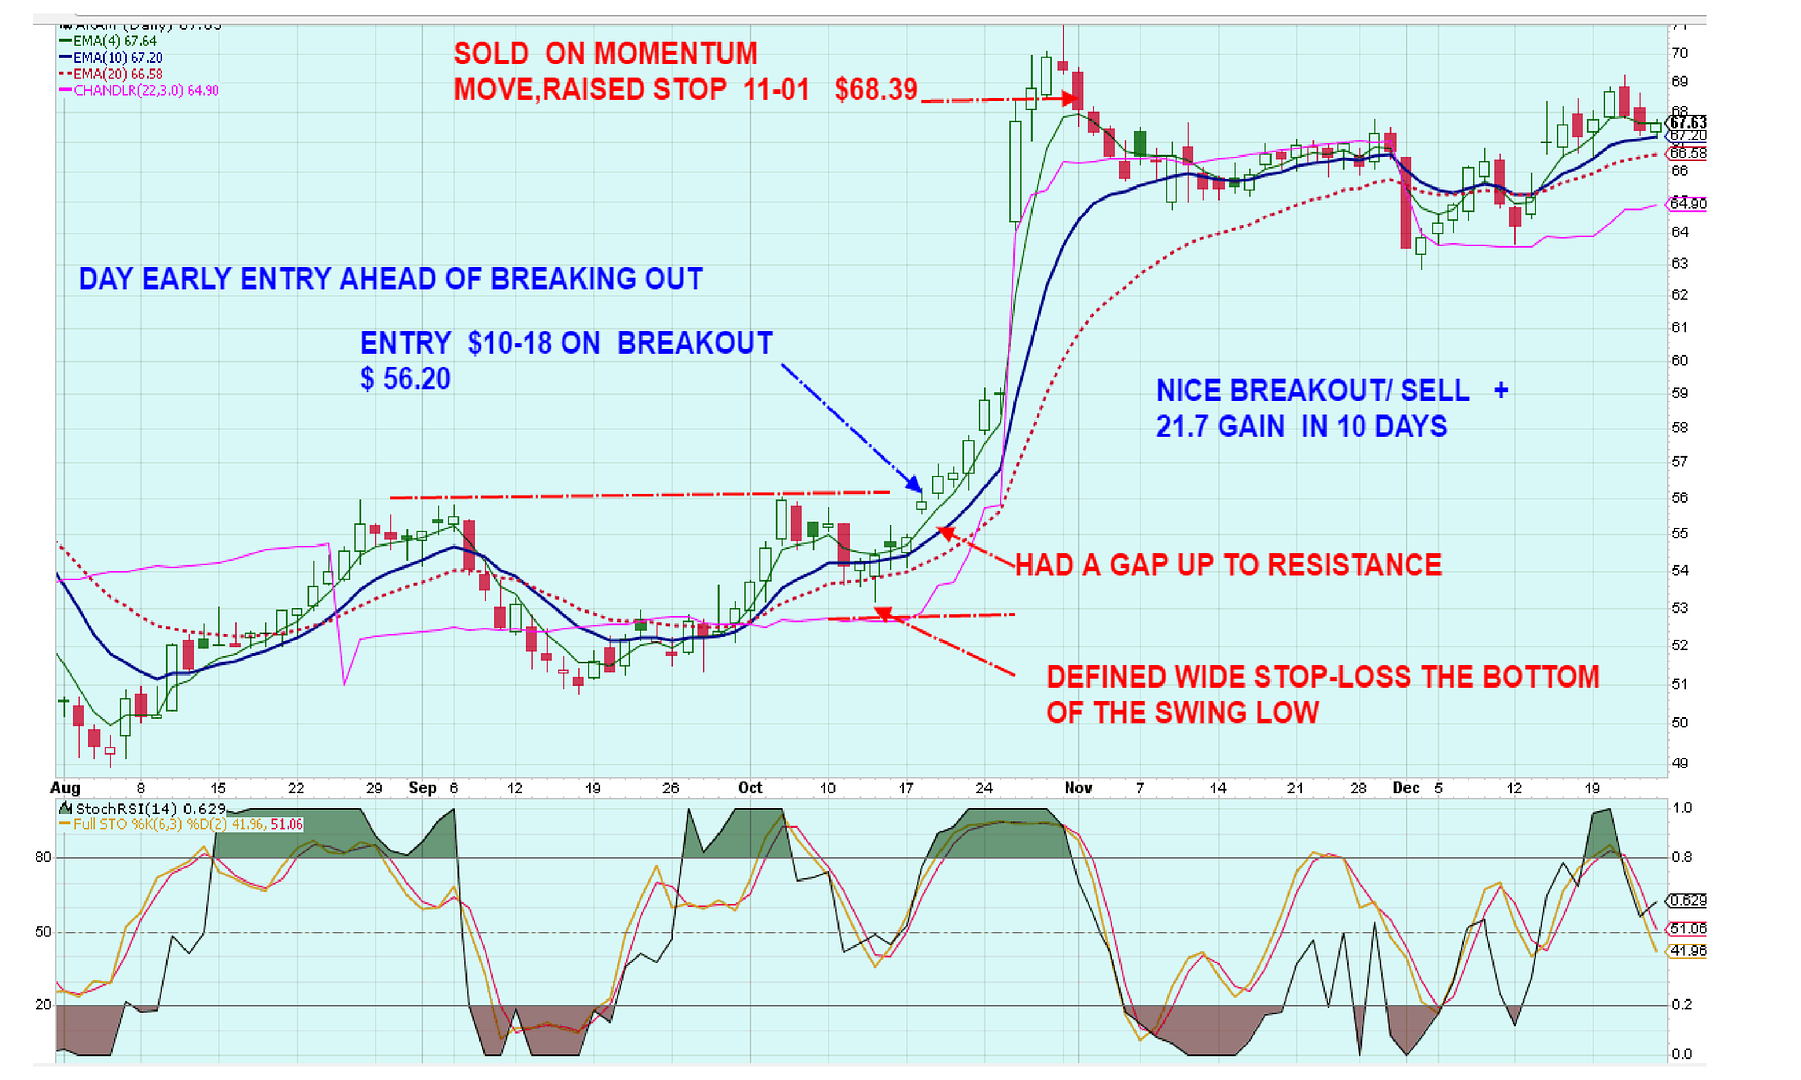 |
|
|
|
Post by sd on Dec 27, 2016 20:32:26 GMT -5
12.27 catching a nice upwards momentum in the chip sector- NVDA jumped up 7% higher, AMD +4%, and SOXX +1% trending steadily higher-
MU (not a position) had gapped higher a few days earlier- xlnx trending steadily higher-While NVDA may be well extended, some of these others might be looking more reasonable.
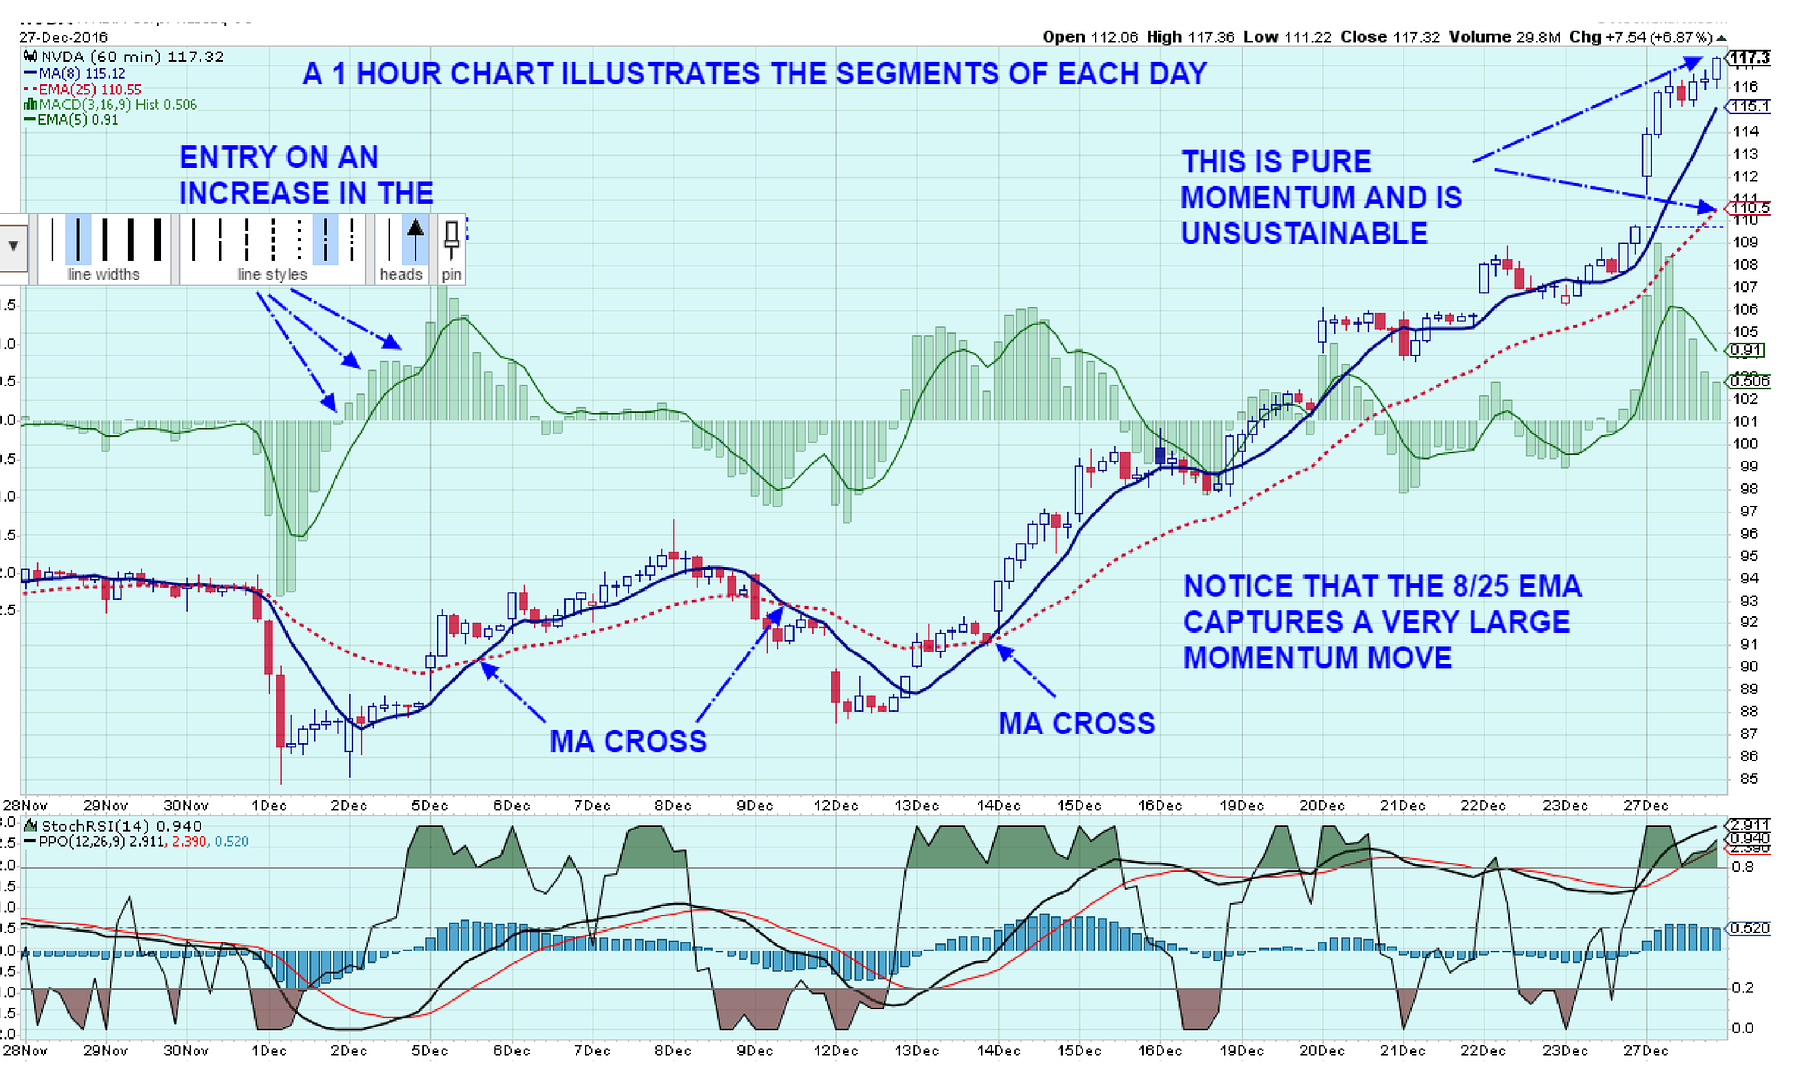
I accidentally sold my first entry partial position today -at the open $112.12 that I had set as a limit sell - and i overlooked it as a pending order when adjusting stops-Nice gain, and still have 2/3 to see if NVDA can still move higher. Chart wise, it's looking pretty vertical- but this could well be a combination of the recent upgrades in the past few weeks, and End of Year positioning by hedge and mutual funds.
The stock has doubled this year- and people are chasing it higher-I think the only way to do that now is with an aggressive trailing stop -
Looking at this price action - both on the weekly chart and the daily chart- and the upside momentum- It makes me think that this could possibly have a "climax" push higher in a day or two-or three... a high volume day , that will signal a short term peak, followed by a bit of selling and a basing period-.
On the off chance this goes 'parabolic'- I will set 2 higher limit orders -$130, and $150.00- not expecting it to jump there- but - just in case.......
In this particular situation, drilling down and looking at the stock's price action in a faster time frame- 1 hour for example- really expands the view as you see the price movement in the course of 1 day in multiple hourly segments. Of course, the issue of viewing faster time frames is that smaller moves appear much larger relative to viewing on a daily chart.
By tightening my stops, i am likely to get stopped out as soon as the momentum pauses- in this case, $114.50 gives little room for any downside from the close, while the other stop at the 20 ema 111.50 has served to be just outside the intraday price moves. This works -perhaps- only during very strong trending periods- and would result in getting chopped up in sideways conditions.
I also plan to consider a reentry after being stopped out- expecting price will pullback lower.
When considering momentum, the trend is what counts- While NVDA is up + 200%- on the year is not a reason to consider that it could go even higher-
It is simply out of the comfort zone we normally consider- The only antidote is to consider tighter stops to capture the gain when the momentum fails.
The thinking that one missed the trade just because NVDA had made a 50% gain this year somewhat sounds hollow when realizing it had done 4x that YTD.
This is trading aggressively on my part as i follow this momentum move on a faster time frame with a tighter stop. I think the rewind/pullback will capture a 5% decline minimum.
Part of this strategy is trying to understand what sectors are favored- and to select amongst the better performers within the group.
I think understanding the macro environment- and how it may change is really well illustrated by the election of Trump , and those sectors that have just taken off. Perhaps not all Trump, but consider the banking sector, - infrastructure- These illustrate the importance of those that had a grasp of the macro view benefitted by taking positions early on in moves that had substantial momentum. This is likely the hallmark of the more sophisticated investor- that plans ahead and doesn't wait to react later after the move is well under way....
in the interim, I think the SOXX still has upside and XLNX @ 461.50 Buy-stop is worth considering. Unless the sector itself breaks down, those leading stocks within the sector should outperform....
edit-stops 111.00 & 110.50 or 12-28
|
|
|
|
Post by sd on Dec 28, 2016 18:42:19 GMT -5
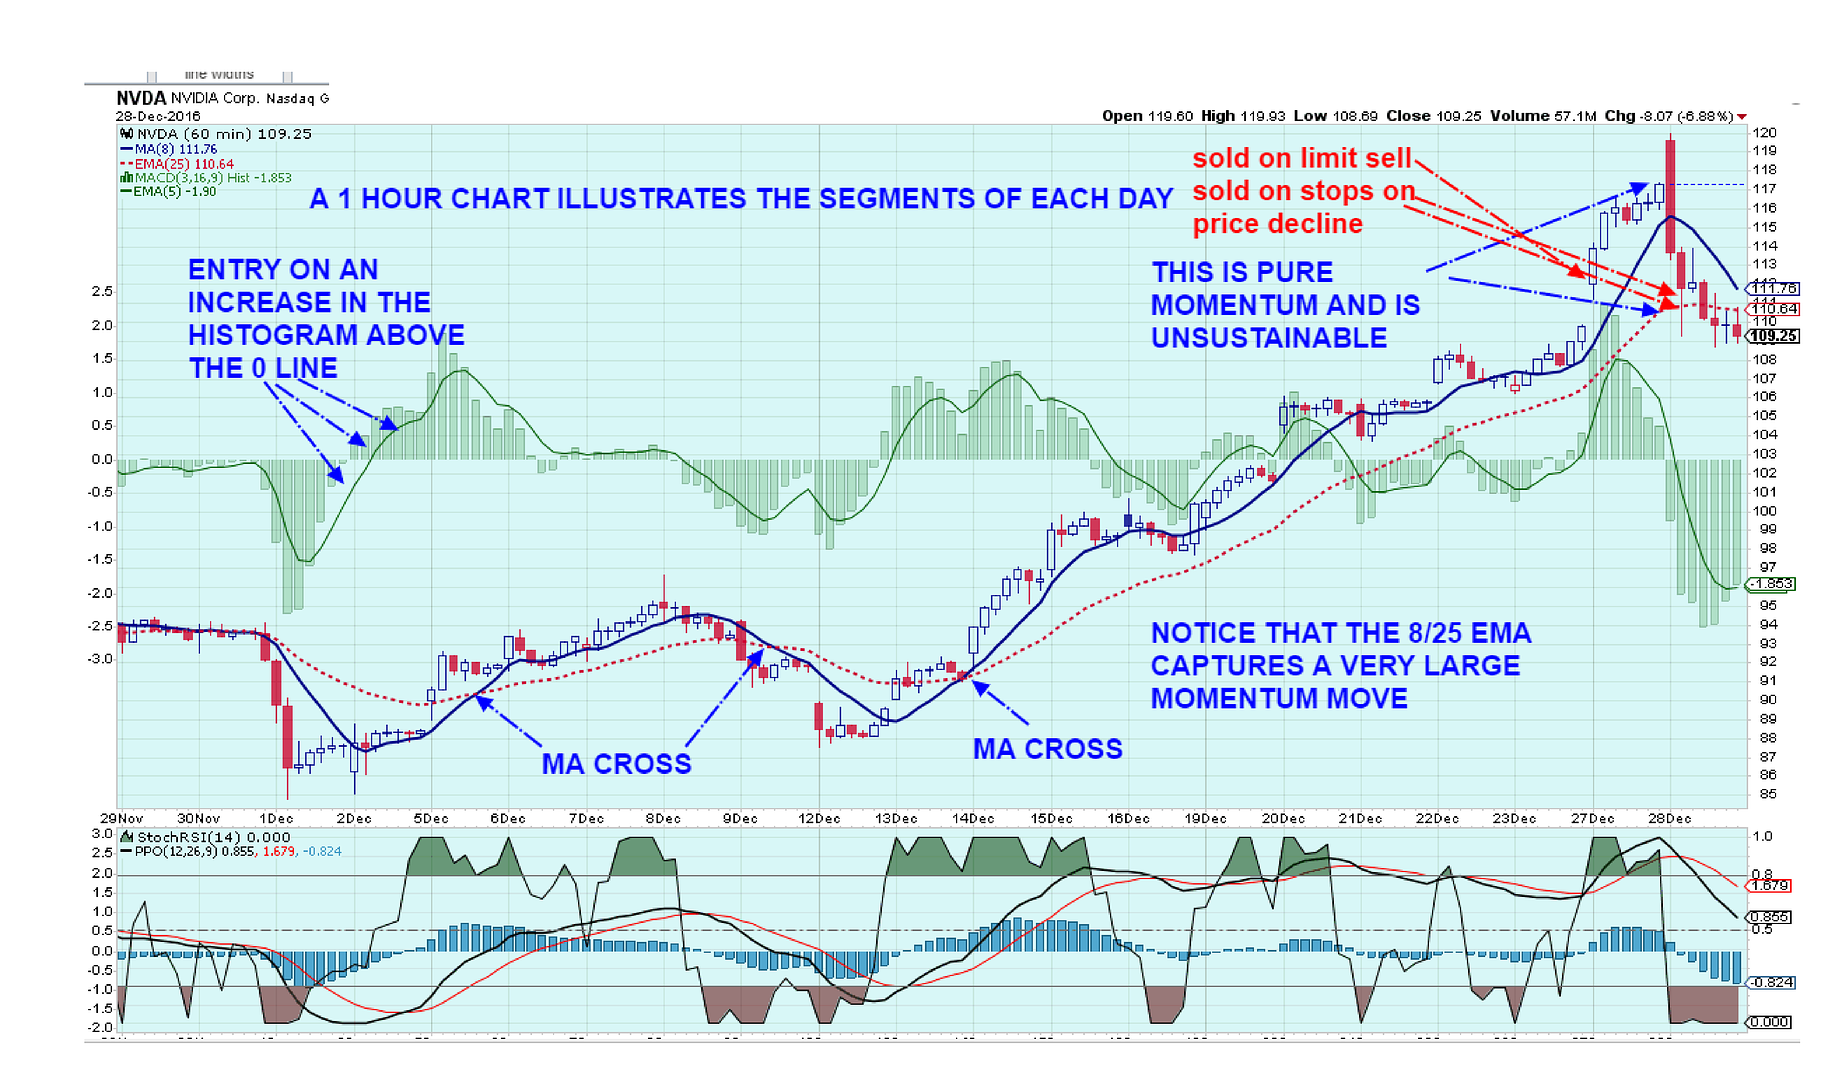
Sold both segments of NVDA on a market down day, as well as a industry group decline affecting SOXX both looking similar-
I'm glad i raised the stops - the day prior i exited on an inadvertent lmt sell, today my position was closed- I had started off with a very high stop and one a bit wider- felt that high stop was likely to get hit even if price moved higher- and so i set 2 stops at the 111, 110.50 level which both filled 110.92, 110.53, on a really negative day- price opened on a gap higher, to 119.60 open, and then sold off the remainder of the day. I had recognized the move was unsustainable, but thought it might get a day or two more squeezed up higher-I think this sell-off was not NVDA specific, but market wide weakness and profit taking.
Also sold off 1/2 Jets, KND-
I had no positions that gained today- and perhaps this is an indication of some profit taking before the end of the year.
One market sell day does not make a decline - but it certainly gets my attention as winning positions lose value, and recent buys start to decline.
Time to evaluate and consider adjusting stops- AMD is a good example- while NVDA gave up 8% , AMD gave up 6% as well
 |
|
|
|
Post by sd on Dec 29, 2016 9:25:23 GMT -5
12.29.16 "In the News"
" Nvidia is poised for a second day of heavy losses, following a 10-day win streak. The graphics chipmaker's shares reversed course Wednesday after short-seller Citron Research said the stock had gotten way ahead of itself and would likely go back toward the $90 mark. Nvidia closed Wednesday at $109.25 per share."
This retracement should be worth watching- Price seemed to stall in the mid 90's- nominal 95 on the way up- with a somewhat wide swinging weekly swing back to 88 . Prior to that , the weekly moves consolidated in a fairly narrow weekly price range- with 65-70 the last support before this recent momentum run.
|
|
|
|
Post by sd on Dec 29, 2016 18:08:25 GMT -5
NVDA did gap down on with a lower open,putting in a 102.80 low, and then reversed course and went back higher, closing 111.43.
I'm sitting on the sidelines, believing today's rally higher is suspect-.
|
|