|
|
Post by sd on Oct 10, 2016 14:16:19 GMT -5
psar, 3X cHANDELIER atr STOP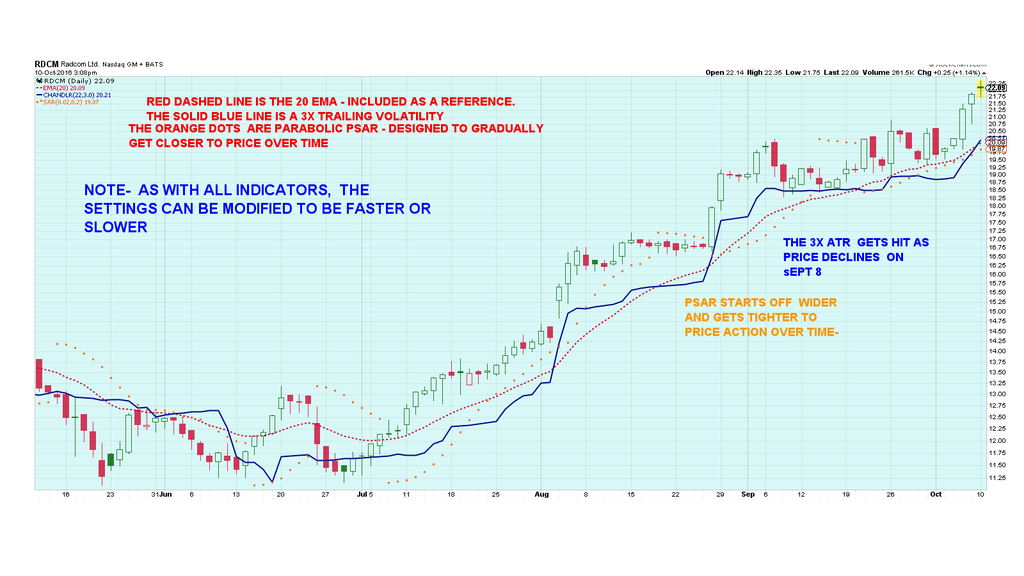
|
|
|
|
Post by sd on Oct 11, 2016 11:48:02 GMT -5
Lunch time note-
I have found that my Ipad also provides a 'Hot spot" - even tucked away on a construction site. Sweet.
Aren't these the most interesting of times!
Looks like Clinton will get this one in the bag, and Trump will go down swinging at the old guard in the Republican party.
Enough politics-
Markets are weak across the board today. Didn't catch the news as to why- other than OIL-
I split my RDCM position, one 1/2 using a tighter stop, and the remaining a bit wider. That 1st stop was hit a few minutes ago.$21.25.
RDCM had just started to push higher 3 days ago, and closed higher- but an indecisive Doji.... and the hope/intent was to see that move gain some momentum and trail a stop up-perhaps using the 2 hr time frame for a profit taking method- I think I locked onto the 2 hr 10 ema -below yesterday's close. My remaining stop is at $20.18-to see if this 20 ema will still be outside of the volatility. The goal will be to see RDCM pullback some more on market weakness, follow it and take another position. Depending on whether it holds the uptrend overall.
MZOR stopped out for a smaller loss- TQQQ stopped out locking in a smaller gain gain.
Still holding CQH and partial RDCM.
|
|
|
|
Post by sd on Oct 12, 2016 19:33:15 GMT -5
Bought some AAPL - With Samsung's woes. it will be AAPL at Christmas- good fundamental reason.
The chart move is 2 days moving above the prior high- allowing the recent swing back to register as a support , and an initial stop-loss under that range at 111.00
|
|
|
|
Post by blygh on Oct 13, 2016 13:06:09 GMT -5
I think AAPL is a good investment - one firm put a $129 price target on it - rather than buy AAPL you might consider CRUS who makes chips used in iPhones. It correlates well with AAPL but out performs it.
Blygh
|
|
|
|
Post by sd on Oct 15, 2016 8:43:33 GMT -5
Thanks for the info-! I will look into CRUS more , might get some time later this weekend.Loads to work on here during daylight hours though.
You had mentioned previously some of the sorting info you employ- and I have not taken the time to expand my sorting process to any thing more than the chart technicals, ideally sector strength in the market- Having a fundamental reason along with a chart -technical -reason likely improves the end results- I know if I had the time, I could spend HOURS in such pursuit- Unfortunately, Hours are not available to me at this point .
Since TIME is one commodity we never seem to have enough of, How do you maximise your time researching stocks to be used most efficiently? Do you have a specific process of making/narrowing the selection? If you don't mind sharing....
For myself- when I have the opportunity, I am turning to the Finviz screener, doing a sort to eliminate stocks under $7, market cap, and generally
don't sort into the separate industry groups being limited by time- It's a seat- of- the -pants approach that gives an idea of the movers in the market. I don't necessarily look for the biggest mover- just those that look constructive and trending up chart wise. Will try to refine the screener
some - again, this is a learning tool & process for me as I try to adapt my trading- Presently AAPL is my sole position- and I am in cash in other accounts- including my IRA.
I have considered sampling Vector Vest- They offer a 4-5 week trial for $10 that is supposed to narrow the investing/trading to stocks moving with
fundamentals also as a qualifier for their selections.
I think Pharma and biotech are under the microscope for now in congress and up through the election- So any trades i continue in that area will be with that thought in mind.
Again, Thanks for the suggestion!
|
|
|
|
Post by sd on Oct 17, 2016 13:25:51 GMT -5
A PRICE PERFORMANCE CHART- USING SPY AS A BASE LINE and aapl and crus 1st chart a 6 month 2nd chart will be a 1 month . 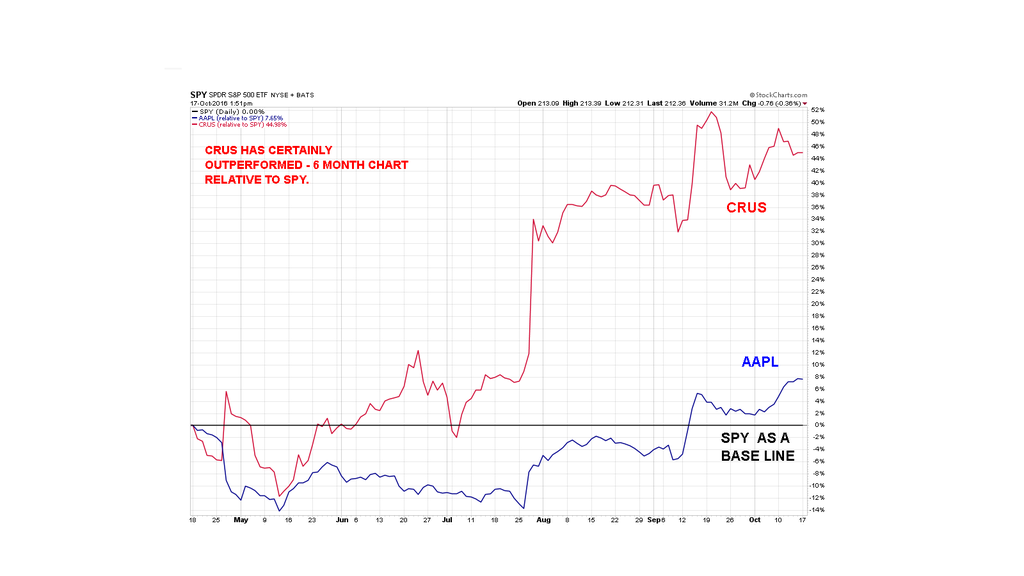 a 1 month chart flips the performance - 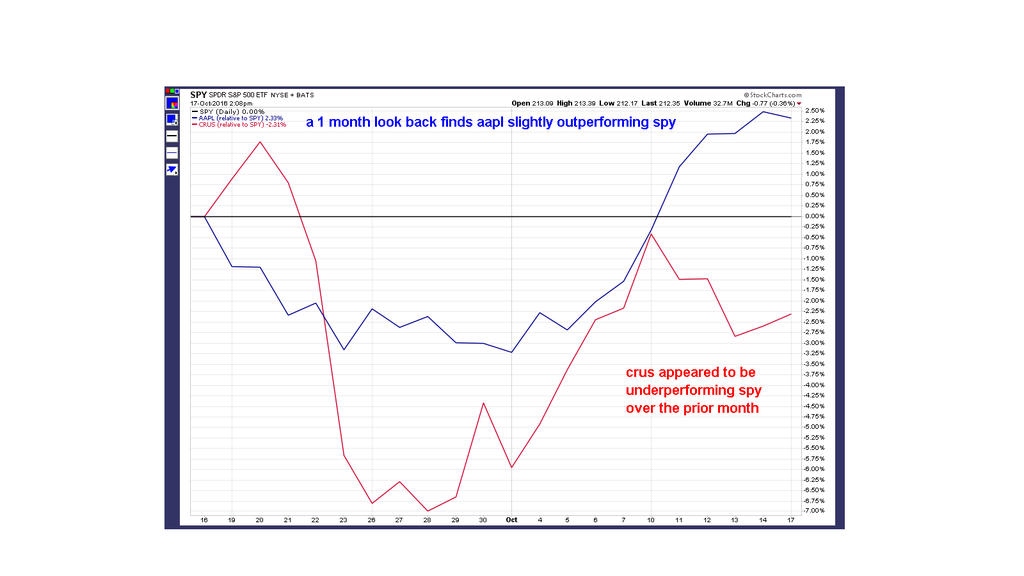 a 2 week chart tells the newer story 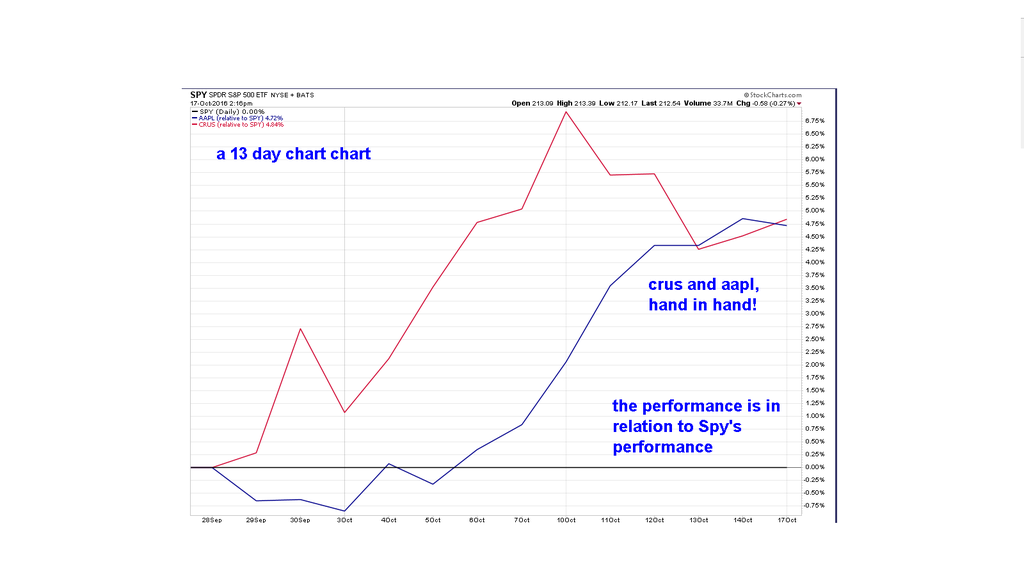 AND THE SAME 2 WEEK CHART WITHOUT HOLDING SPY TO BE THE BASELINE- ALL 3 PERFORMANCES FROM 13 DAYS EARLIER 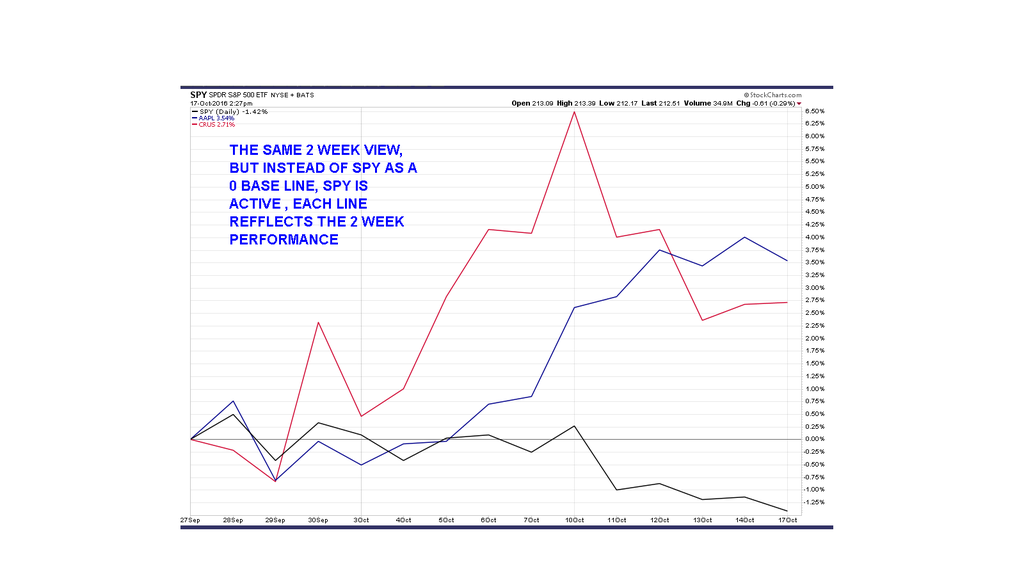 |
|
|
|
Post by sd on Oct 19, 2016 12:39:45 GMT -5
|
|
|
|
Post by sd on Oct 25, 2016 11:55:10 GMT -5
held 10 positions the past week- most were + until today- raised a few stops this am- Raised all stops this lunch time .AKAM best performer
|
|
|
|
Post by sd on Oct 26, 2016 19:35:56 GMT -5
80% of my positions stopped out between yesterday and today 10.26.16. ITUB is holding flat and looking weak- stop at $11.20 AKAM took off today, making up for those trades that stopped out today. Entry was $56.26. I had a larger position in AAPL, and it sold along with Goog,CX, AMZN, Prah. I had entered AAPL on it's recent up move, and had made a stop at 117. Instead of accomodating me with a nice gradual descent, it opened down at $114.39 and my stop-loss had then become a market order to sell. That trade executed 9:30.04- and executed at $114.002- so it was a fast execution, but price was dropping- Note that AAPL closed higher on the day......with a low at 113.31. I also noticed that the 3x ATR would have been hit as well- for a wider loss. I haven't had time to be able to get any input on the market for a few days-but caught a few minutes this AM 6:05 with Joe Kernan on CNBC and perma bull  name escapes me- but it seems the view is that the election is an overhang - and then the possible Fed increase- and earnings are increasingly important with higher PE valuations. However, I think Risk mitigation (My Bias ) is prudent- I am essentially in a money market fund- in the company IRA- for the short term- i think i am waiting for a correction now that likely will not happen to purchase at lower valuations. Look at the monthly chart of SPY going back 10 years- and note that we flatlined and lost the uptrend in 2015. The High in 2015 was $207.61 in JULY. and then we declined in August to -178 and repeated that through February of 2016. Whoppee! we have eventually gotten up to a new high of $218.50 - so, we look to be up from the 2015 high about $11.00 or 5.5% upside- and in a holding pattern. Since the pullbacks in 2015 were over 10% declines- it seems the downside volatility exceeds the upside return 2x for those with antacids in their portfolio- or the long term investor. That is not to say that it will continue to be this volatile in 2016-17 - but what IF it does? And, if most funds underperform the "benchmark" - There is not a high bar this year to do well for Investors. If individual investors underperform the market by 50%- this year may see a 3% return. Is a 3% GAIN WORTH A 10% decline? This is a good case to support active management IF a replicable approach could be proven. Food for thought- |
|
|
|
Post by sd on Oct 27, 2016 20:00:15 GMT -5
with ITUB and AKAM being the remaining positions-
i have raised the stop-loss just tonight on AKAM from $58 up to $67.00 ITUB TO ABOVE BREAK EVEN.
This stop is designed to give very little weakness- but just in case - allow the winning trade to go up just 1 more day- in which case i will tighten again, or close the trade if i get access. I will include a higher limit sell up 5% FROM HERE - JUST IN CASE ...NICE TO HAVE A RUNNER .
|
|
|
|
Post by sd on Oct 29, 2016 19:11:01 GMT -5
As we close out October, I made just a smidge of profits on the month.
I did not get to spend a lot of time viewing markets this month- Devoting what daylight is left when I get home to nibbling away at the Home project- and losing daylight each day.
Part of this approach in stocks vs ETF's this year has been to try to find a means and method for capturing that larger mover that may breakout and provide an exceptional short term return. The only resource i have viewed has been the Finviz screener, and I used it in the most basic settings-and filled my account limit with 11 positions. i oversized the AAPL position, took a $3 loss on a gap down below my stop.
I think the screener's ability to narrow the field would be a great time saver in developing watch lists and possible trades.
I am sure there are other links to You tube in how to employ a screening tool- here is one that came up this /AM-
I am not promoting this website services- and i have not had any time to search other Finviz instruction-
This video is a starting point in understanding how to use the screener.
ben323.clickfunnels.com/optin10206071
The tone of the market seemed to shift, as we entered earnings, and i tightened stops from the "position' area tighter to the swing trade - and closer level.
Tightening stops when i did appears to have been prudent and the correct move, as prices seem to have largely declined lower -
It would appear that for most of those positions, the 1st stall in upwards momentum was definitely time to close the stop-loss-
That close below the fast ema rang the warning bell on many. By elevating my stops , I captured some small gains and greatly reduced losses on others. I think this is mostly in response to what seems to be the market environment- The 2 surviving trades -ITUB, AKAM .and AKAM has broken out- i assume on a positive earnings,. I am now trailing price by upgrading the stop with each up move.
|
|
|
|
Post by blygh on Oct 31, 2016 9:59:37 GMT -5
ITUB up $0,50 this AM - I really like Brazil, Argentiina (ARGT) and Chile (ECH-CH - but Brazil remains the strongest with best potential - many companies have dissolved debt with inflation thereby decreasing their liabilities. I also like semi's - I am holding SOXL. I am down on real estate (holding SRS) and health care (holding RXD and BIS) - nibbling at Aerospace ITA MLM NOC holding LMT
Blygh -
|
|
|
|
Post by sd on Nov 3, 2016 19:26:21 GMT -5
Been very busy this week, missed your post-also missed minding the market - Thanks for sharing your focus. I had a good run with AKAM, stopped out this week for a nice gain, and Itub stopped out for a small loss- Belatedly, i took smaller positions in LABs and TZA- both in decline-and already extended .....
Your post was 3 days ago, and the markets have all continued to decline the remainder of this week. You have a wider sense of the world markets- and i think finding exposure to growth outside of the US is a good and sensible diversification. Particularly as the US markets are under pressure- now- and perhaps in the future.
I expect the Jobs report will be positive- perhaps causing a bounce- but my bias is inclined to believe that it will be easier for this market to decline than appreciate.
As i heard today on CNBC- the upside gain is minimal- should it occur- compared to the downside Risk. The point of view of the commentator was well expressed- excessive valuation, declining earnings, political indecision- and _If Clinton wins- there will be an overhanging Investigaqtion- and if Trump wins- the markets think Change is coming-
I think having realistic stop-losses in place in a trading account makes sense- and holding a larger quantity of cash to take advantage of a possible market sell-off may be worth considering.
But, That simply reflects my BIAS-
|
|
|
|
Post by sd on Nov 5, 2016 20:03:03 GMT -5
A Belated catch-up this weekend-
I thought I would find time to better track & account for the recent large group of smaller trades I had made-Such is not the case- as my focus outside of work has still been the ongoing, never-ending story of the "Home Project"., My children liked the "Never Ending Story": and the Dragon... when they were growing-
i should comment on the recent trades I made that are bearish - even after an exceptional series of consecutive declining days for the market- a Bounce is overdue- and tried to occur Friday-
Jobs report was OK- nothing great- and yet realizing that the decline is overdone- I still took some "short" focused trades- intending to withstand a day or two of volatility .
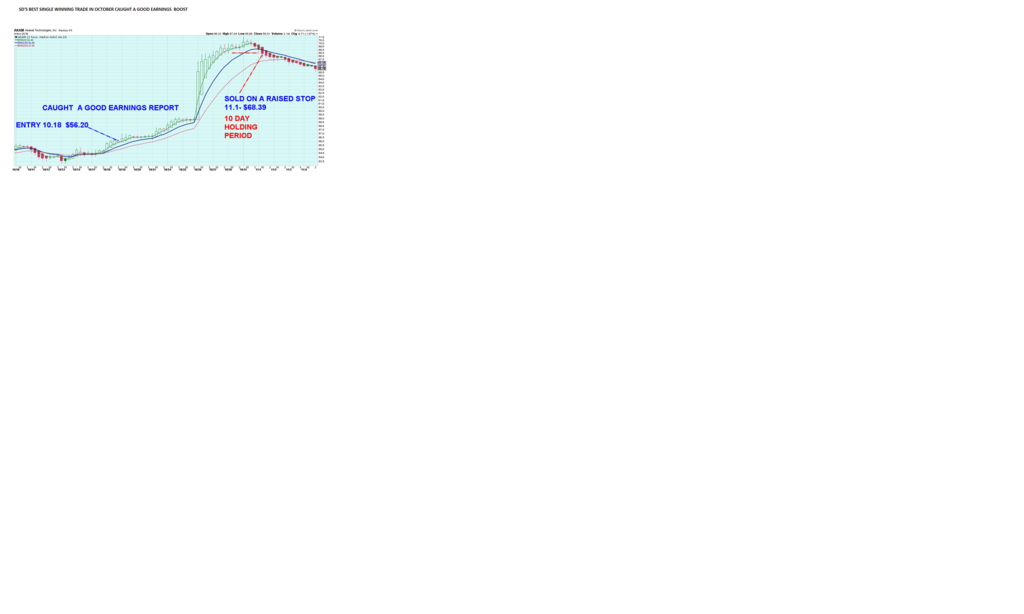
This post catches up on my best trade in October- AKAM- in the semi sector-
From a technical point of view- the Entry was on a move higher from a slight decline, and that offered a relatively minor % loss if the trade failed with the stop under the prior swing low.
I kept a wider stop under the prior range- and when price moved higher after earnings- note the surge higher- I did not tighten too closely. until the trade again moved higher-
From viewing the chart, the wide ema spread and up move was unsustainable to continue much longer- but i elected to gradually tighten- saw the sideways price consolidation at the top - and- if i was trading intraday, i possibly would have moved the stop even higher-but i elected to git it some room to base sideways, with just a minimal decline.
As it turned out, the 1st sign of weakness was the early sign of what was to follow.
This trade had an 11 day holding period, also going into earnings. If there was bad earnings, the chart would have reversed much lower.
The initial set-up gave a defined swing low that I would use to set an initial stop beneath-
As the trade progressed, it moved higher.
As the progress moved up, the gap in the ema's widened and price surged- Unsustainable over the longer term- "parabolic" is the up slope definition- The rubber band of elasticity between normal trends higher and excessive movement higher was in place- Stop-loss was tightened. I let it ride - and day 2 it executed on a deeper price decline. The goal was to allow price to stall and range sideways, but not to give back an excess in profits- I think this worked well in this trade.
 |
|
|
|
Post by sd on Nov 6, 2016 9:50:13 GMT -5
|
|