|
|
Post by sd on Sept 15, 2016 18:06:55 GMT -5
Thursday 9.15 note-
I think the energy sector took a big hit on a report of reduced global demand or Oil- That affected the energy sector- Retail reports also came in low- but despite that, the market is choosing to rally- This past week- AAPL has "sold out" the new I phones- while the competition- Samsung- has major issues with it's batteries exploding and catching fire.
I had a standing order in BLCM, that I overlooked- It filled this week, and i gave it a 4% trailing stop- It moved higher, pulled back, sold for a small profit and moved higher-
Still holding RDCM near it's stop- and placed an order for CLVS limit for Friday- Strong trend, lot's of past upside to recover.
|
|
|
|
Post by sd on Sept 20, 2016 15:49:56 GMT -5
My limit order for CLVS was not filled- came close- and it jumped higher today along with Aria- and IRA's pick - My RDCM position did little-
|
|
|
|
Post by sd on Sept 20, 2016 18:01:48 GMT -5
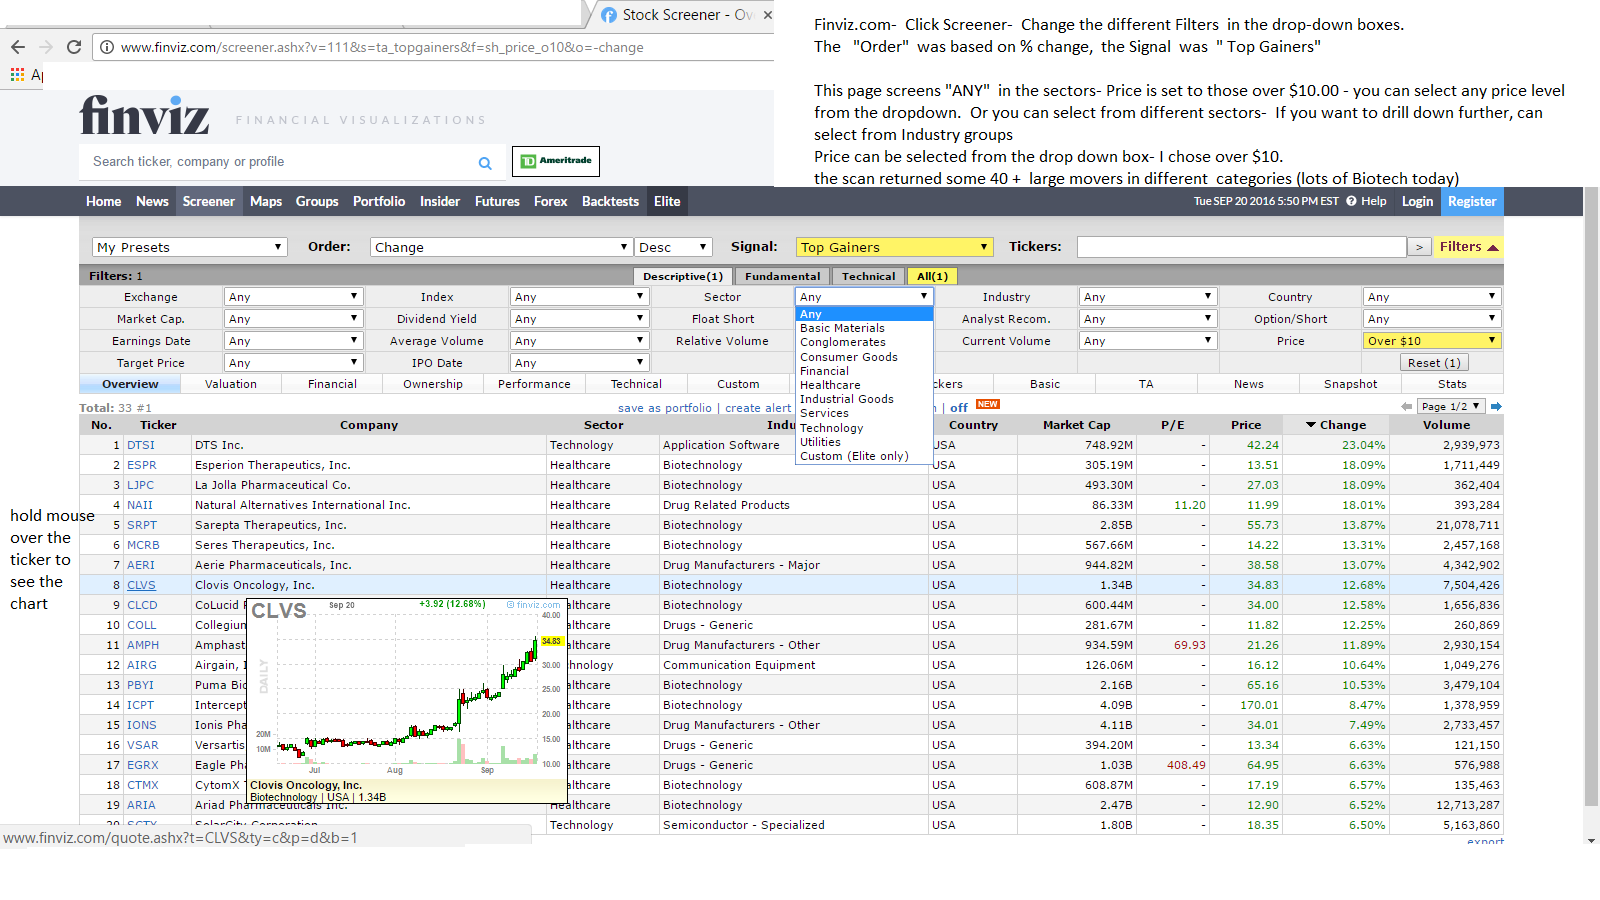
I thought i'd mention Finvez.com - Free site- As i play around with the screener, I find it a quick way to see what industry groups did well that day, and also some stocks that meet the selection criteria.
I'm just learning to use this as a tool to save time, and the screener tool looks to be very robust, with drop-down boxdes under the various categories you can narrow the selection field into.
Don't want to make this sound complicated at all- so - I am interested in stocks that performed well that day-
So, in the "Order" box- I select change, In the signal box I select "Top Gainers" , In the Sector- I start with "ANY"- but could focus more on select individual sectors through the drop-down menu, and in the Industry group I could drill down even further- but this time I select "Any" .
I go to the "Price" and I select stocks over $10-this narrows the field and eliminates "Cheap" stocks. There are many price ranges to choose from in the drop-down.
This is all under the "Overview" setting on the bottom line-left- To the right of the Overview, are multiple selections from Financials to TA to Valuation etc., enabling one to drill down
even further-
Since i am primarily looking for momentum picks , I run the scan, and then I move my mouse over the Ticker symbol, and a chart pops up-
A quick way to get a sense of trend and price movement that may make it worth tracking- My 2 unfilled Buy orders gapped higher today were selected from this type of screen- and my horse race selection for this week.
I haven't done a lot of study on the screener, but thought it would be useful to those who have not used it yet- It looks to be a powerful tool that can sort and narrow down the selection process and find the best performers -even within separate Industry groups.
I think Finviz allows members to also hold some chart lists for free as well.
 |
|
|
|
Post by sd on Sept 21, 2016 16:41:31 GMT -5
9.21.16 I got home in time this afternoon to catch the tail end of janet Yellen's Fed policy speech.
Following that was the grilling of Mylan's Ceo surrounding Epi-pen. Love to have that compensation increase from $2.5 Mil to $14M over 7 years!
So, the markets rallied with the reassurance that the Fed was willing to remain accommodating with no rate increase this month- That is now out of the market's way
The market rallied across the board, and I chose to add multiple trades at the market close- in different market segments-
Biotech has been breaking out, and -despite the grilling of the Mylan Ceo, pharma and biotech moved strongly higher.
I chose to go net long based on the Fed not being an unknown and a potential obstacle- At this juncture, will there be any follow through to today's higher prices?.
I diversified my positions, bought some EEM and Bidu, XBI and Sgen, Cybe, Tlt and TQQQ. Of Course, Buying into the close is buying at the peak of enthusiasm-for this day-and so the lows of today may represent a level that I consider setting entry stops at. Perhaps this day will be the climax peak- But in the event it continues with some momentum, I will trail stops-higher.
|
|
|
|
Post by sd on Sept 21, 2016 19:38:11 GMT -5
CORRECTION- WAS NOT FILLED ON tQQQ- SET A LIMIT OF 124 TO SEE IF WE GET A PULLBACK
|
|
|
|
Post by sd on Sept 22, 2016 19:06:09 GMT -5
tqqq gapped up higher, and my order never filled-
All of my new entry positions held- but several biotechs pulled back on the day but did not stop out- so it is still a close with "Promise" .
I am inclined to think that the Fed is now out of the way, xbi, Ibb making a new high- elections are already included- Nice 1% gain in TLT with a gap move higher- stop raised just a tad under the entry- tighter stops these days following momentum.
|
|
|
|
Post by sd on Sept 26, 2016 20:00:59 GMT -5
9.26.16 Busy days-Good weekend -working on the homefront, Played mason and did some veneer work- I calculate that if i could likely complete the masonry works in 4 weekends (8 working days) barring interruptions. and little time thinking about stocks- reality is likely Christmas if i can keep the day job scheduled at a 5 day work week.
While I believe i would enjoy more free time to study what is moving the markets and such- One has to be careful what they wish for....
Focus becomes an issue when you fail to cancel pending orders to buy- and I was filled today on TQQQ as it sold off on market weakness. What is the difference in getting a fill last week and-or - this week? The tone of the market- at least as i think i get a glimpse- and market direction. With the big debate tonight, tomorrow may shed some light on where the markets -and the world - think the US could be heading- This is like holding into a major annual earnings report -is it not? And this is a seasonally poor time to be Long-
I had 2 decent gains for the day- RDCM moved 6% and TLT up slightly.
Looking at my prior pending missed orders- Aria is up large-about 20% and CLVE as well. Both are in the more volatile biotech sector- While i recognized the momentum in both, I failed to allow myself to jump in on what already appeared to be a sizeable move- thinking "I missed it" - and wait for a return lower. ideally just a retest....
I found this article interesting- i think a lot of Hedge Funds- and mutual funds- are finding redemption's are increasing- and perhaps this is the evolution of the markets- or just that we are very close to a teetering and tipping at the brink- maybe this is just the really "smart money" closing their doors because they know the best is in the past.....
maybe that is just my Bias- seeking - and i am not a strong, spiritual person-but , a time of atonement for the excesses we have allowed to continue -
Why would a professional fund with all of the financial expertise money could buy- choose now to bail out? And - i also heard last week that the Harvard endowment fund also lost monies .
When the very best financial minds- find themselves unable to scrape a winning return-
www.cnbc.com/2016/09/26/perry-capital-to-close-its-longstanding-main-hedge-fund-reuters-reports.html
|
|
|
|
Post by sd on Sept 27, 2016 20:04:51 GMT -5
As i seek to come to terms with choosing a stop-loss strategy and a more defined method- beyond divine intuition-
I find that going to the basics makes the most sense-
As a TA advocate- believing that the trend fluctuations can be taken advantage of- a time to be in the trade- a time to be Out of the position....
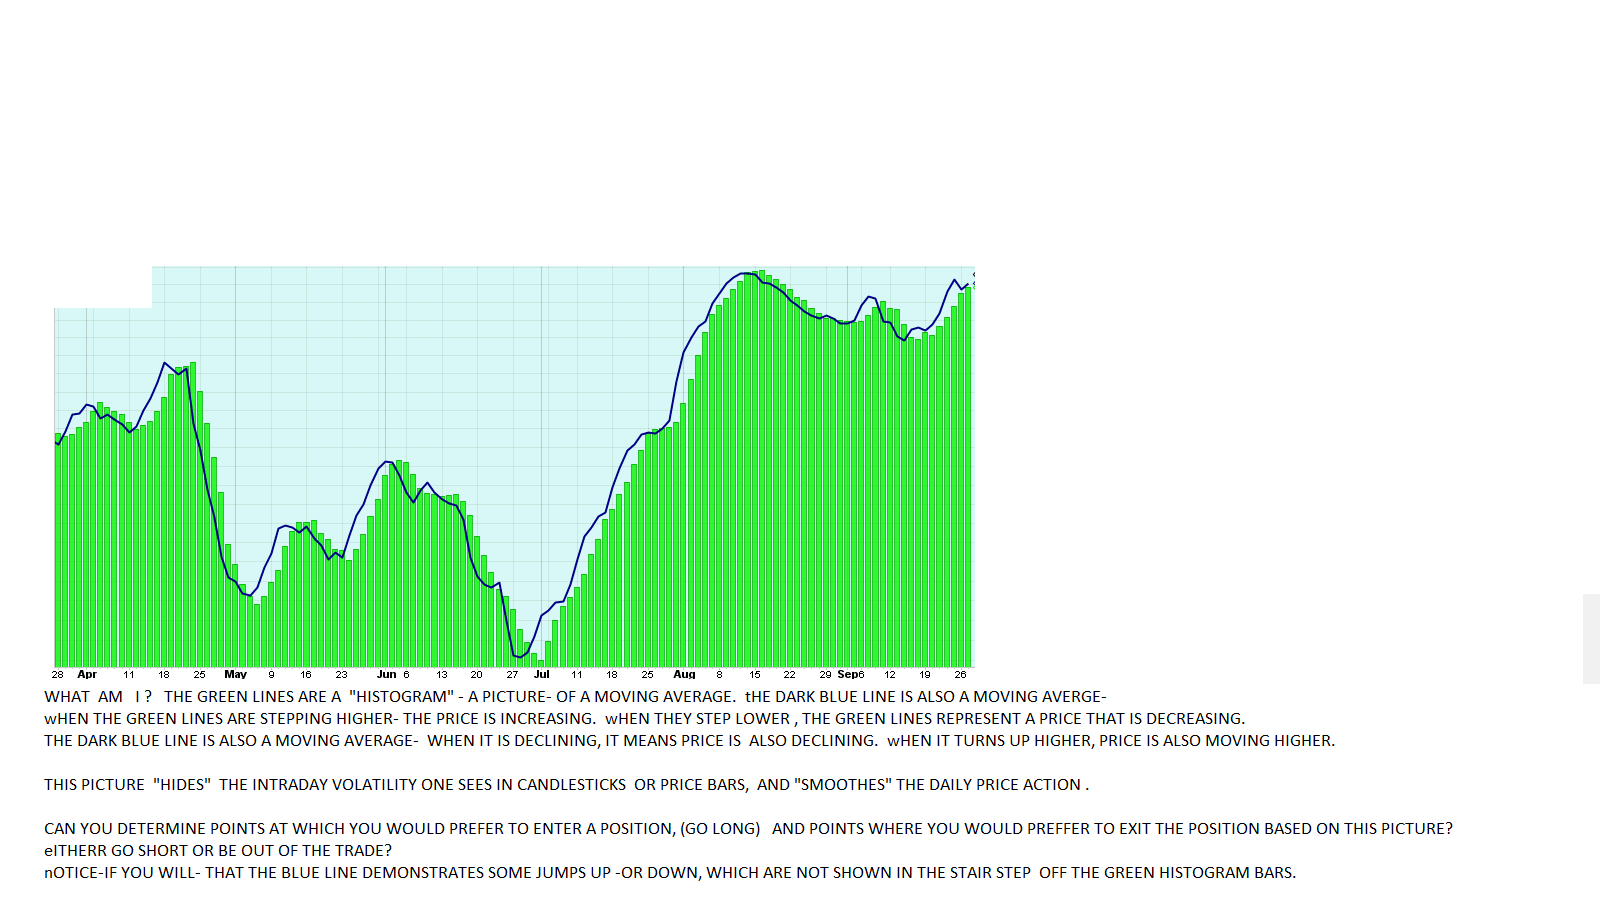
I would offer the attached chart.
There are NO price Bars, No candlesticks.
This is done intentionally- because the activity of a daily price bar may simply cause each of us to react and- in the final analysis- that high volatility daily bar we bail out on- may just be "Noise" designed to shake us out of a trade. That "shake out" may be intentional manipulation by market makers or HFT recognizing where stops are waiting-
Outside of the conspiracy idea that the markets are 'rigged' Trends are none-the-less evident and can be identified and traded on.
A Friend of mine has had good success in trading a popular tech stock - but has made a lot of very smaller captures- all net profitable , eventually holding through larger declines and then being saved by Price returning higher- My belief is that TA- will offer the better Risk- and greater Reward- to be entering earlier in an uptrend, and exiting sooner in a downtrend- and understanding that being Out of a position and on the sidelines- is indeed a position, even if it is the choice to hold cash.
Understanding the basics of trend support that approach.
The issue is we view the markets with too close a prism, and a 1 or 2 day fluctuation may look extreme.
So, the attached chart eliminates the daily price movements- The histogram bars follow the price- and the bolder line is more reactive and volatile.
This is worth understanding , as i ultimately believe that IRA has the start of a good idea- just gone bad- That is, hold during the uptrend, but recognize when the trend goes South and get out- Don't rely on Monthly charts to define the trend-
If you take the time to view the attached chart- it becomes pretty simple to discern when it would be profitable to be long in the trade, and when one should be out -or short the trade.
Assuming one wants to be long when the histogram is increasing, and potentially exits on any decline- looks like the start of a defined momentum approach.
|
|
|
|
Post by sd on Sept 28, 2016 18:07:37 GMT -5
fOLLOWING UP ON THE PRIOR POST -
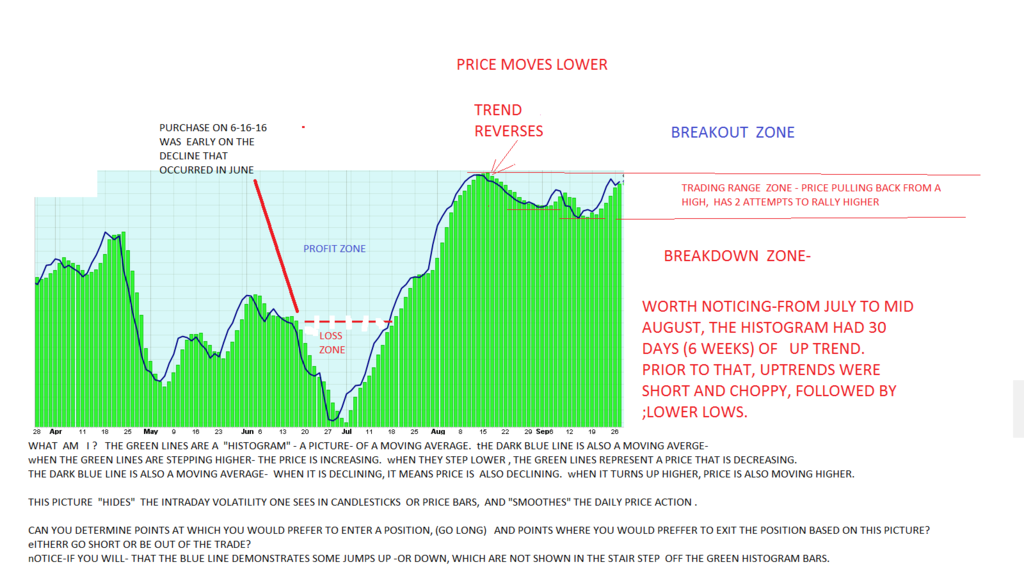
THE STOCK is Goog . By removing price bars from the chart- and using just the smoothing action that occurs by illustrating the action direction with a look at 2 moving averages- one fast ema in line form, another =just-slightly slower- in histogram form , removes the trees and one sees the forest (broader picture) in this 6 months chart, periods of decline find short lived attempted rallies, and finally after a substantial decline- a 6 week rally develops- reached a peak, pauses, has some pullback weakness, tries to move higher, declines lower, and then retests the recent high-
I would take the 2 lower lows and this attempted rally to be a line in the sand- Price is testing the prior high as resistance, and the recent price has established a lower support bottom. should this be violated lower, there is a lot of potential downside to get back to the earlier lows.
What is useful about this type of view is that it does a good job of graphically illustrating the movements of price- averaging in the volatility in a 'smoothed' -averaged- movement in the line or the histogram- Where an individual would perhaps react too soon if simply watching price intraday.
it should be noted- that moving averages lag price- the larger the moving average, the greater the lag.
Depending on the time period one selects, by the time the moving average starts to turn down- it is following an already lower price .
Where I think this illustration may have value, is to understand that reacting to minor price fluctuations while the trend is higher is simply not "allowing a winning trade to run"- In price chart format- price has to decline below a moving average before the moving average makes a turn lower.
A very fast moving average- say 4 or 5 SMA or EMA will track price closely, and be penetrated intraday with typical volatility-
Does this have any real world application for swing or position traders? I would think this would be useful - The driver is that one cannot be acting intraday- because the volatility intraday may obscure what is a higher closing price at EOD.
The 1st image in the prior post was a 'teaser' of sorts- looks promising initially- but -other than graphically defining a trending condition- what does it provide?
Perhaps simply understanding when a trending condition is in play , and allowing it to have a 1 or 2 pause before reacting with a sell would benefit the bottom line. those periods of sideways consolidation are an issue- and deserve to be noted-
Of course, i am striving to look at price action in a method that suits my life-style and lack of market realtime involvement.
|
|
|
|
Post by sd on Sept 28, 2016 19:13:18 GMT -5
Time frame is a bit shorter, but the chart captures price declining as well as resuming a substantial up trend-
included in this chart is the graphic lines of the 3 emas , as well as the histogram o a fast ema, and price action. What should be noticed is that the 'smoothing action" of the emas - reduces the volatility that can be seen in the price action- but that same smoothing results in a lag to respond on the same day or two or three- or 10 or more- depending on which moving averages are used. I think the lines represent the 5, 10, and 20 ema., and the histogram is the 5 ema moved to the right 1 position.
What is noteable on this rally, is that once all 3 emas were in proper uptrending alignment, price momentum was maintained for 6 weeks- even with a few days pause- and price action never penetrated the 10 ema. When the trend peaked, and the bar closed below the 5 ema, and the next bar closed below the 10 ema, the decline was starting. Prior to this sustained price action, there were several periods of short term hops higher, and then larger declines-which would make for very short term trades- mostly losers if long and fighting the trend.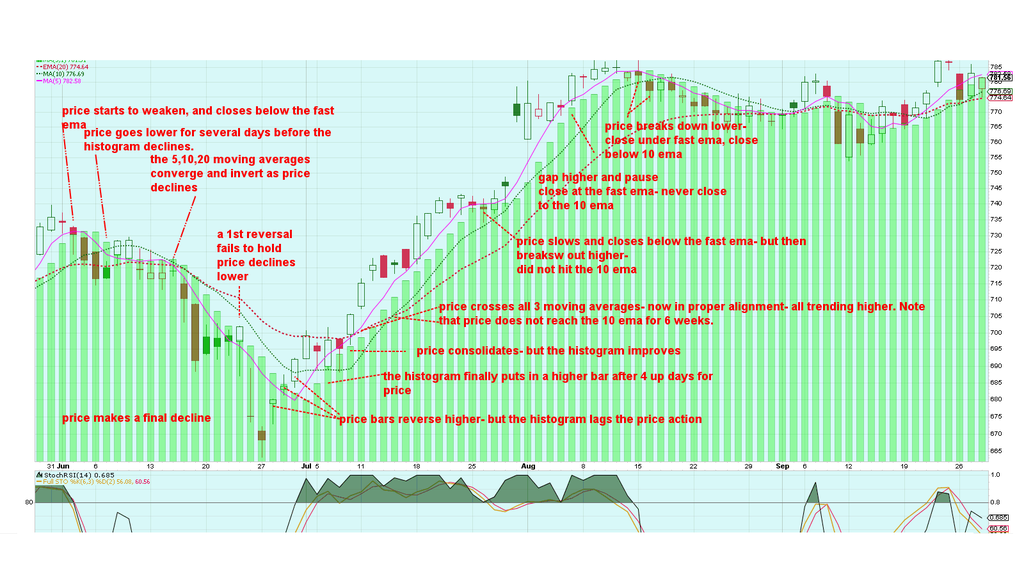 |
|
|
|
Post by sd on Sept 29, 2016 19:30:22 GMT -5
Was stopped out today on 4 positions- TLT for a gain but offset by greater losses in XBI, SGEN, and BIDU-
While i thought i was treading water,and was somewhat optimistic , I now feel that the water has reached above my mouth, about to go over the nostrils.
with sector weakness taking out xbi, I still hold 2 positions- RDCM net stop is positive, and CYBE -in slightly negative territory, and stops have been tightened.Also A small position in TQQQ is still positive-but looks weak with a stop at 124.00.
I presently am not trying to add any positions- But- some good news- Congress passed a temporary budget extension- the US of A will not default into 3rd world debtor status this week!
|
|
|
|
Post by blygh on Sept 30, 2016 6:58:29 GMT -5
Interesting analysis SD. I used to do a lot of chart analysis but when a trend becomes clear, it is time to start looking at more fundamental analysis. I always look at short positions and rarely buy a stock with more than 3% - 3.5% of the stock shorted. Joe Six-pack rarely shorts stocks. People who do are usually the most sophisticated investors. I also look at insider buying/selling. If the people who have the best knowledge of the company buy or sell shares in it, I think that is a pretty good indicator. Sector analysis is very important - it is a lot harder to cherry pick the best of a bad lot then to pick a good stock in a growing sector. E.g. solar panels are a bad sector - I have rarely made money buying even the best stocks in it. Pension funds - some pf the main drivers of the market invest for returns many years down the road. Buying TSLA today is like buying Ford in 1908 - if they keep innovating and perfecting, gain a few patents, they will dominate
the auto industry.
|
|
|
|
Post by sd on Sept 30, 2016 18:00:44 GMT -5
Good input Blygh and thanks for sharing-
I agree that -particularly over time- understanding the fundamentals makes sense- as is also understanding the Macro environment and sector/industry groups in favor-
that is interesting about 'rarely buy a stock with more than 3-3.5 short interest" .
I confess, I do not bother with trying to review fundamentals, preferring instead to rely on trend - and ideally narrow the positions to industry groups in favor, with just a spare amount of time allocated to trading.
This year, I have made what i consider some better small steps- as i shifted from ETF's solely to include individual stocks-just for swing trades, I seek the chart and momentum- and tried to shift (somewhat successfully presently) to not react to a negative bias-during market news and short declines. Can't quite escape the volatility though- as in yesterday's sell-off .
I also recognize that i should invest a greater amount of time in pursuit/qualifying the stock selections - and it is just a roll of the dice when -as an example- biotech is running and I take 3 positions.......based on the chart alone. Chart analysis alone may be quite simplistic, but it is also a good place to start- IMO as you point out- there are additional levels to consider ...
And holding through earnings- Questionable at best-particularly in what seems an extended environment .
The goal in posting charts, is to share a perspective, and understand and reinforce the positives of allowing price to trend-in a positive trend, and to discern when to take action when that trend appears to be violated.
A friend of mine prompted the most recent charts as He/ She have an entirely opposite approach to the markets choosing to Buy and Sell within 1 or 2 positions- and often take what I consider irrational entries on price breakdowns-and selling too soon-for small gains-
However, they have the stomach, and belief, that all that has to happen is to wait, and eventually the "irrational purchase" will be justified
by price moving back higher- and that is reinforced over multiple trades and holding periods-
I fall into the mindset that the position is a trade- and as long as the trade trend is intact, i will try to hold it for a longer term swing position. got somewhat chopped up recently, but it's part of the "still learning" mindset. (Decades doing that) Outside of the active IB trading account- which is my "testing ground" , I may hold a few positions with a wider stop- but those are presently All in cash.
TSLA and Elon Musk is certainly a big gamble on the long term future ,perhaps worth considering as a small speculative, and disruptive position in a long -term account-
Thanks for Posting!
|
|
|
|
Post by sd on Oct 9, 2016 10:10:12 GMT -5
When considering trailing a stop- one has to consider why a stop would need to be tightened- based on Price Action? Price Decline? Time in a consolidation? Is the Trend broken?> What defines a trend? A series of higher highs, and higher lows- meaning -pullback -lows.
For my present approach, I am trying to Position trade, holding a trade for what I hope will be a longer term larger gain.
Stops are critical - IMO- but as Spiderman noted, stops can often be recognized and taken out -particularly if too close due to volatility or held where everyone is sitting. To hold a position for a longer duration- and i have held RDCM for a month or so now, it did not hit my entry stop- nor my slightly tightened stop during the consolidation. This type of trading also fits with my lifestyle/ full time job and limited time .
A couple of charts to view without price action- I one had entered when the moving averages confirmed an uptrend was underway, and those averages are still intact and uptrending- 3 months now- - why would one exit the trade for a short term gain?
Yes, price has made a substantial move, but no one can tell when a move is going to roll over and decline- until it does-
What is interesting about this chart- is that price often penetrated the fast ema intraday,and on pullbacks, but rarely the 10 ema, never the 20 nor the 50. Understanding this is normal price action in an uptrend- Higher highs and higher lows are well illustrated by those moving average lines.
The prevailing direction is up and higher to the right. Good starting point to step back and note the overall larger trend direction. 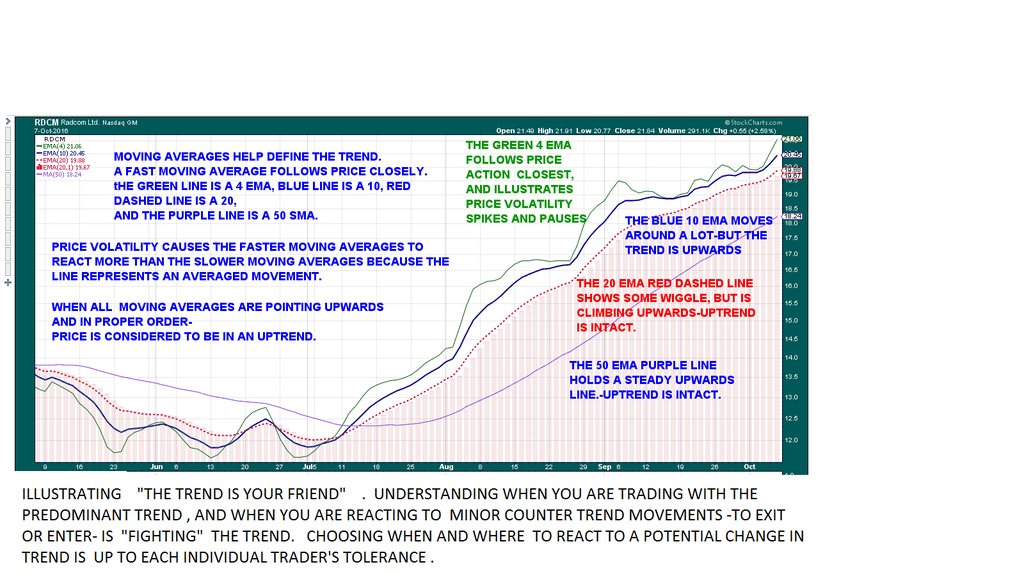 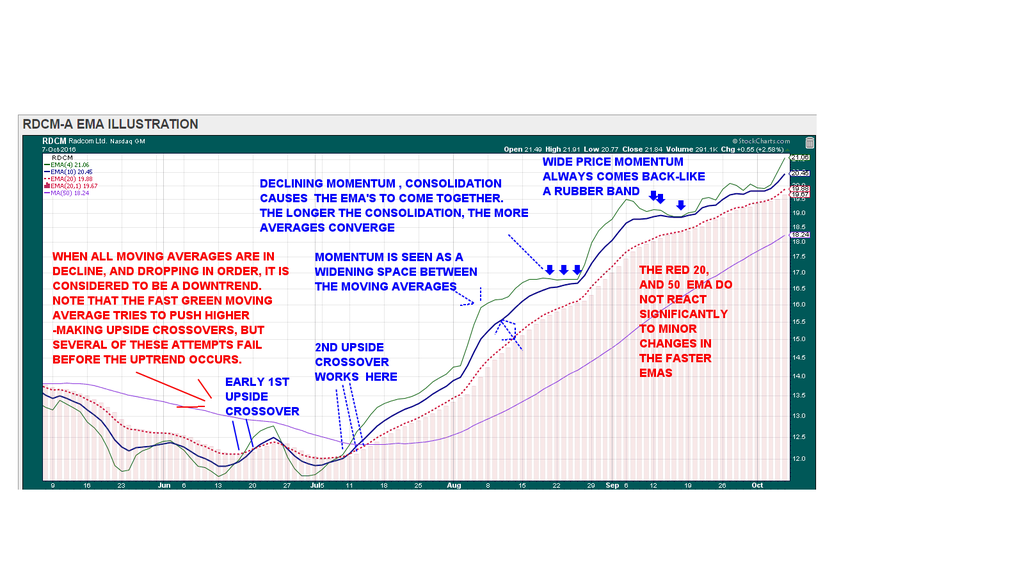 |
|
|
|
Post by sd on Oct 10, 2016 13:52:28 GMT -5
Stop-losses are likely harder to determine than a good entry- both are easy to see in hind-sight-
Stop-losses give one a mathematical idea of how much Risk any one trade may have - not including slippage and a gap down situation well below the stop.
Where do you set a stop? Is there a good -one -size-fits-all- type of approach?
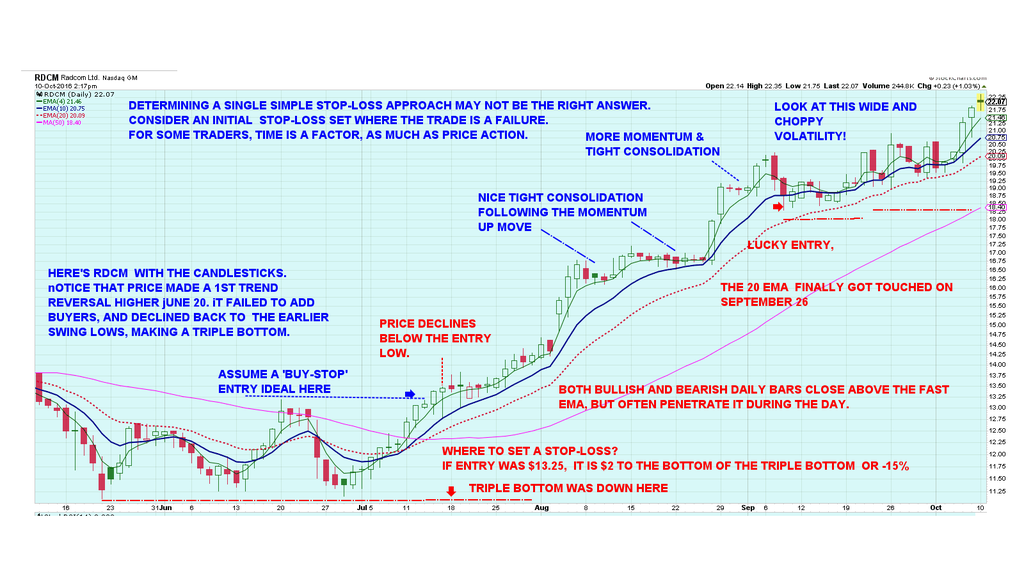
The best loss they say -is the 1st loss- but if one gets a lot off smaller losses because stops were too tight- step out and view the bigger picture, trend, and what is "normal" for the price action- Average volatility is exactly that- just an average of very low volatility and tighter bars, and then add in the much wider ranging bars with larger spikes up or down.
This chart shows the price bars, the moving averages- and note how well a stop set at some of the wider moving averages captured the majority of the upper move- but eventually- all moving averages converge together , so a stop at a 20 ema that didn't get hit while trending, gets hit during a week or two of consolidation-
So moving averages perhaps give an indication of what price penetrates during a trending period, and what is outside of normal volatility.
Notice that I am writing with the assumption that my goal of a longer term hold equates to a larger gain may certainly not be the same as someone reading this- we all have different approaches, and mine may change in the future. Just sharing what makes sense to me at this moment in time as i look into this subject more closely.
Consider- that a stop held back while price is behaving and trending makes sense- but if one realizes that during every period of a few days higher momentum, where the ema's widen, there is an opportunity to tighten stops daily- just under the price- or perhaps on the fast ema- and capture a lot of the meat in the momentum up move, and not wait for price to come back to a consolidation range-
I want to get another chart in today on some technicals -PSAR and Chandelier exits which can be used as stops-and entries.
Bullet points on this chart is note that price bars -even when trending higher, may have intraday spikes below the lows of the prior bars and may penetrate one or more of the moving averages- particularly early in the up move, or late in periods of sideways consolidations-
Also, notice the periods of wider upside momentum- ALWAYS come back - usually with a decline lower in price- but that does not mean the uptrend is over or violated. An Uptrend is defined as a series of Higher highs and higher lows. This is "normal" price action -
Periods of consolidation are usually necessary to build additional upside momentum, until the supply and exchange in the consolidation area has gotten to a point where someone wants more of a position, and buyers want to sell for a bit higher-Or vice versa-
From the view that a price has moved up too much, too soon etc- That will eventually be proven when price fails to make a new high, and turns over and what appears to be a normal pullback may turn into a much faster decline as traders realize the best is over.
 |
|