|
|
Post by sd on Jul 25, 2016 13:11:10 GMT -5
Starting off -it's 7.25.16-
Year is half over, markets sold off, recovered, had Brexit, and then broke higher-
Amazing indeed. The bull music is still in favor, despite all of the plausible reasons that we are way over extended, market is 'long' in the tooth, and it appears that monetary policy manipulation & accommodation is keeping the US and global economies looking forward.
Bias can make you "see" what you want to see-
While not being very active in trading this past year, When I heard the Brexit vote was to leave- I was confident that that would be the final straw and the markets would drop quickly-
I took short ETF positions on day 2, determined not to get shook out with any tight stop expecting wide swings.
I held -with great expectations that I would easily capture a substantial downside move lasting a week or more- At least a 15-20% drop was my expectation.
I finally cried "UNCLE" and sold- taking a $600.00 +/- trading account net loss of 5%. (Had some leveraged ETF positions)
wHAT WAS THE LESSON? Don't let your Bias or beliefs cloud the vision that the chart presents.
I expected some volatility, so I had not set hard stops-
As time allows, I will share when I can - Day job usually prevents me from seeing what occurs during the day- But I occasionally get a week day off (1/2 day today)\
Too Hot- heat index above 100 - to do any outside work on the home project-
No set Format for this thread- Feel free to comment or criticize .
|
|
|
|
Post by sd on Jul 25, 2016 15:21:39 GMT -5
7.25.16 Markets down slightly. Oil down today. AAPL downgraded. (No position)
Sold Goog $735.91 . (minor weakness-testing the indicator reading)
Holding positions in MSFT, HACK
added HPE, Upgrade & chart breakout higherfrom recent range
DOG, shorts Dow indicator cross from oversold
COW (livestock-few shares for tracking purposes- waiting on cash to free waiting period.
DUG- ultra short oil- big move up today- Best opportunity was to get in a few days earlier
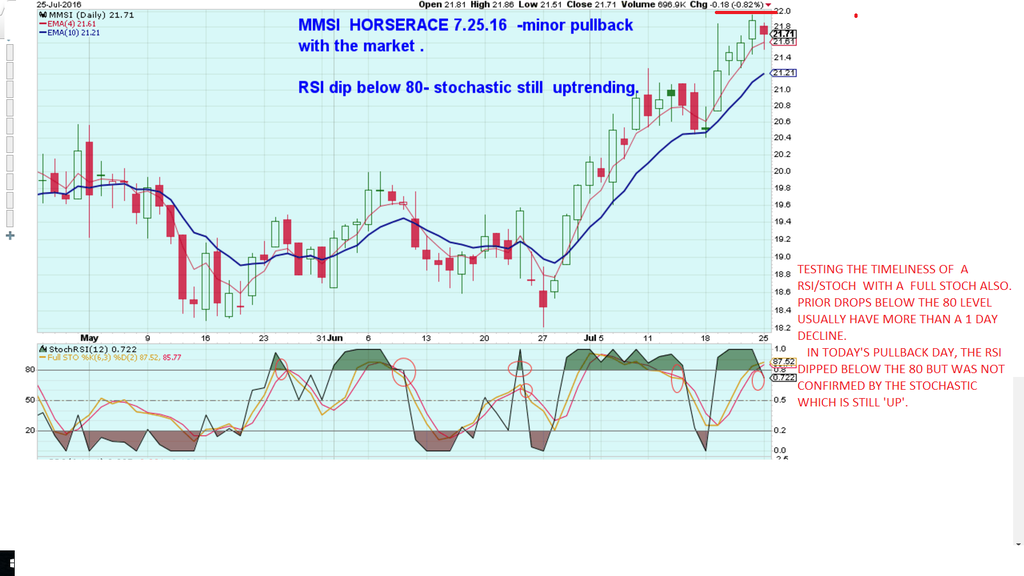
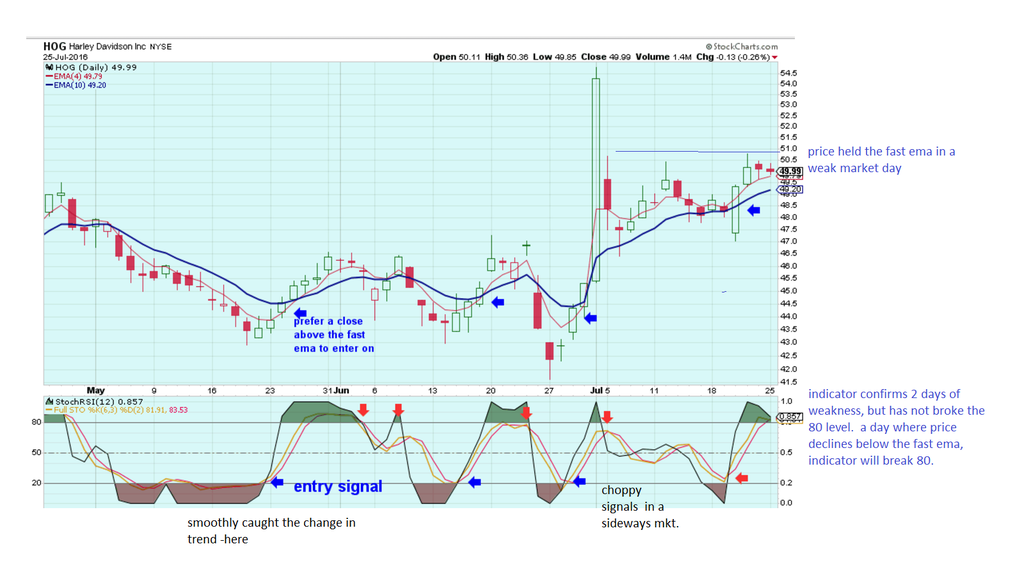
Buy-stops not filled on HOG, MMSI-Horse race candidates both were lower today.
Future candidates once cash clears xbi eq.wt biotech testing recent highs- If Earnings in the sector are good, etf should gain momentum
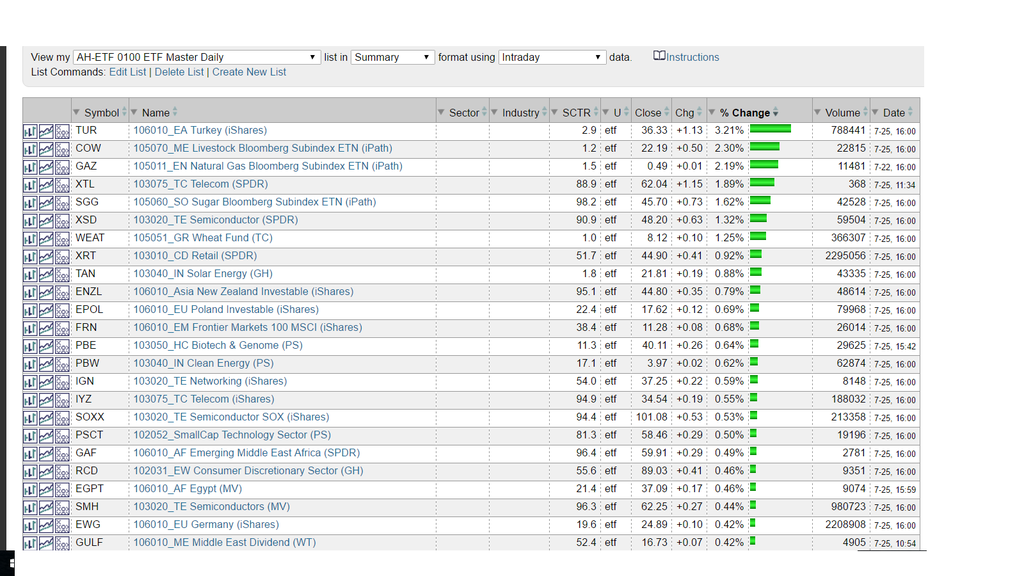
I recently uploaded from Stockcharts - a list of 300 ETF's that cover all sectors, indexes, industry groups, and drills down into commodities etc.
Today is the 1st day I actually used this while trading-
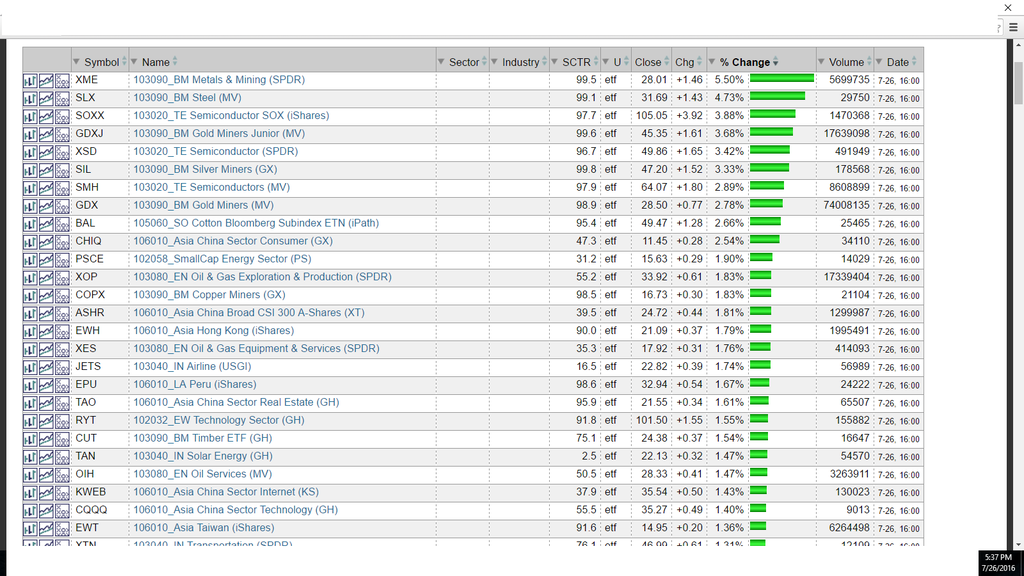
I scrolled down through the list- notice the % movers shown in the green bar- The majority of the list was in the red.
COW is a position I took a tracking position in- just a very few shares. It also has an extremely low SCTR rating of 1.2- bottom of the list.
Note the winners today- had a number of commodity -Wheat, Sugar etc. You can also click and get the individual etf chart up-
I will explore this further- It also has the same 300 ETF's in a weekly master list- so, you can view it in terms of the longer trend . If interested in this- or have a similar screener you use for stocks daily, share it if you will.
|
|
|
|
Post by sd on Jul 25, 2016 16:15:23 GMT -5
I intend to do some indicator study to determine if there is actual application that i could employ in making trading decisions.
I will present the horse race candidates here and on the chart comment on the indicator-Stoch/RSI quickly goes from oversold to overbought- and the function is not to trust every indicator response- Only time and much backtesting would prove the merit of it's application.
When the indicator declines and breaks below the 80 level, and the stochastic lines cross and decline lower- How often does a multi day decline follow?
Also, for possible early entries, when the indicator turns from oversold and the stochastic crosses to the upside- may indicate a possible early entry.
The benefit of the early entry from an oversold level is that it potentially reduces the width of the stop-loss.
Also- some rules could be employed that require that price close above the fast ema.
Indicator values here are faster than the "normal" values to respond more quickly to individual price movements.
Note that the markets were generally weak and giving back a bit today.
I think Gild posted good earnings, but gave a negative fore-cast- This will likely put a damper on that sector.
Sold Goog- prior to the close. Might have noted that in the earlier post?
  |
|
|
|
Post by blygh on Jul 25, 2016 17:39:53 GMT -5
Nice work sd. . I play the volatility with tight stops - If I have to buy a stock three times in a week, it is no big deal - so long as I can turn a profit. With leveraged ETFS like DTO NUGT DUST RUSL RUSX SOXS SOXL I keep tight stops - usually $0.15 to $0.25 and I up them two or three times a day. All trends are short lived and this market can reverse at the drop of a hat. This week will see the 9th anniversary of the 2007 sell off on the 28th. Things had been going great - Dow up to 14500 or there abouts - Then the rug was pulled out as the subprime mortgage came to light. I am not sure what kind of situation might come to light to cause a sell off but given the "unknown unknown" I am standing close to the exits .
Blygh
|
|
|
|
Post by sd on Jul 25, 2016 18:25:20 GMT -5
I totally agree with your assessment of the market Blygh!
Yes- moves are indeed short lived and tactical trading makes sense-
Protecting your downside with tight stops and then making a reentry as called for -is good practice-
That means you are well past the psychological "attachment" that some traders desire to seek confirmation that we were "right" in taking the trade.
Do you use IB? The low commission rate makes it a choice for multiple exits and entrys without accumulating a huge commission bill.
I've been expecting this charade to end- and end badly- but desperate governments employ desperate measures. Not in Kansas anymore , are we?
I'm generally unable to have computer access during the day when at work- so I am usually limited to position swing trading.
Thanks for the input- I would hope to encourage you and the other members to join in- share means and methods in our mutual pursuit to greater prosperity!
I had to come back and EDIT this post-
While overall I hold a negative Bias, I think it is important that Trading one's way to prosperity should be plan B or plan C.
I would encourage anyone reading this thread to max out any Employer IRA up to the Match, then max out your Roth (Invest or trade in the Roth)Use a low cost (Vanguard broker) and then look to max a personal IRA or other Investments- Real estate etc.
I would not advocate using trading as the sole mean's of improving one's future years- Just repeating the statistics- I think they call them the mortuary tables..of retail traders.
|
|
|
|
Post by sd on Jul 25, 2016 18:50:17 GMT -5
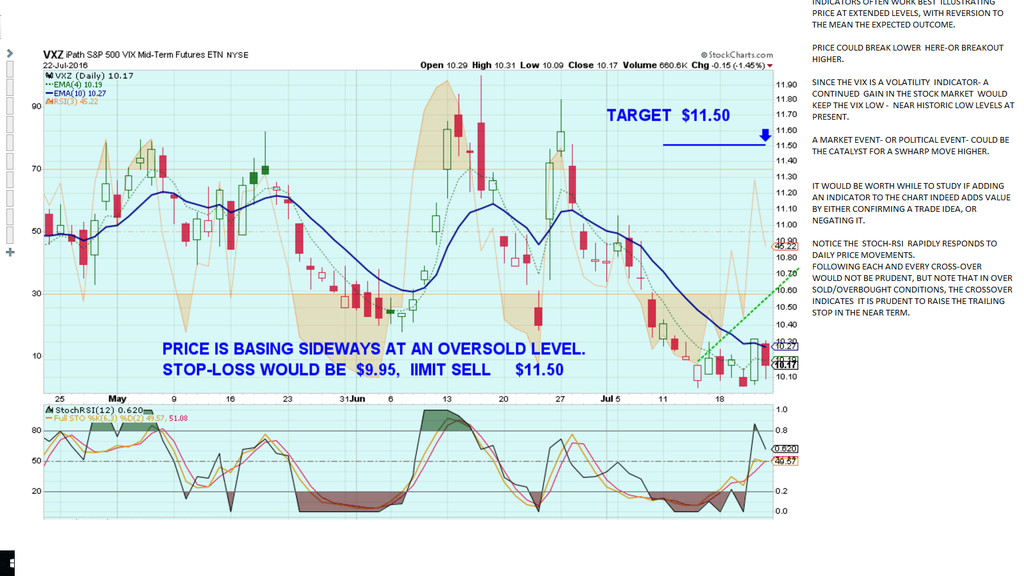
Horse race- SD's pick-VXZ
This 1x etf tracks the movement of the $VIX. Being unleveraged, it should not have the decay other leveraged instruments have- but i cannot confirm that-Hadn't backtested it against the actual $VIX . My basis for taking this as my race pick is that it is more likely that something will rattle the markets after a smooth few weeks, than the markets smoothly gliding higher.
Volatility is very low with the markets having had a nice run these past weeks. It's about time that something should shake the apple cart- Perhaps it will be the disappointing earnings-perhaps a financial failure in Europe? Oil/energy conflicts in the mid east? Political, Social Events will always occur, markets will always choose how to react to these events- and very often the reality of the impact is actually minimal, but the reaction could be quite large.
Here's the chart of my pick- I'm only including daily charts at present, but i typically will review the weekly to take note of the larger trend, and prior points of support and resistance.
I should mention that while i am including / studying the stoch/RSI indicator- i include some faster moving averages. I don't wait for moving averages to crossover-
i think the more volatile and less long term trending the market is, the more adaptive approach- responding to weakness- certainly has it's place in swing/position trading.
Also, with the HFT trading-computers- some Algorithm in some machine knows how to probe for stops and analyze orders- They execute without emotion- no hoped for future large win-
I think that is why we had the flash crash in 2011- with no liquidity...,. If and when another event occurs, it will likely be just as rapid.
Enough rambling-
Chart:
 [/font] |
|
|
|
Post by sd on Jul 25, 2016 20:33:16 GMT -5
oddly enough, after my Edit to Blygh's post - where i added that extra stuff about Investing 1st - trading plan B or C - i got an e-mail from my financial adviser asking how things are going....Oddly coincidental- but i invited him to join in the horse Race- or start a discussion- on Investing compared to trading -
I have no clue as to whether he will take my "bait" "invitation"- to join in- but i really hope he will. I have invited him to join in the horse race, comment in my thread - open some dialogue as to the pros and cons of investing vs trading. I hope he accepts and adds his voice into the discussion .But not in the capacity of selling any service .Just presenting his point of view would expand the dialogue on this site. Should he join in the discussion- i need to acknowledge that he manages some of my personal assets- That was a decision i made in the past year - to not have everything in one large lump sum basket- and i took steps to interview with several "advisers' . I chose him as he declared he was a "Fiduciary" adviser- Call it asset diversification-I had too large a % of my retirement assets under the umbrella of one Company adviser account that was selling only a select group of mutual funds. I gave a portion of my meager assets to be actively managed for a set fee, using a diversified approach that combines stocks, bonds, and some fixed annuities. I have active control of assets in the company retirement account,but cannot employ stops- the active trading account- and some separate Roth accounts. i could discuss that in greater depth down the road- and likely will- whether he joins or not...I think that is very relevant to where we want to be when we need it.
I hope that is transparent.
Back to Trading.....,.

|
|
|
|
Post by sd on Jul 26, 2016 16:50:34 GMT -5
7.26.16 Tuesday
Dow was down today, but managed to reduce the decline by the close-
SPY is still sideways- RSI is in decline, but price holding this level.
Nas up slightly-
AAPL earnings were good, price popped higher.
TWTR dropped lower on poor earnings-
SMH semi ETF popped higher
Daily leaders-
Metals and miners- Semi sector- lots more green today
 |
|
|
|
Post by sd on Jul 26, 2016 20:33:26 GMT -5
i THOUGHT I WOULD START AT THE BEGINNING....It will seem overly simplistic to some- Sorry- This is a new Easel.
In the charts I am starting with will be daily charts-
I prefer candlesticks - or fast Renko- but Renko will be long down the road if i ever get there.
When i 1st started trading and came to try to use TA, moving averages were one of the 1st indicators i started with-and then i gradually piled on a great combination of multiple indicators-
thinking that if i Just got the right combination- the Oyster would be mine for the taking- LOL!!!
Today, i think that while everyone learns to develop their own methods that suit their style of trading- or personality- or time available-I think it is worthwhile to question that which we become accustomed to , and periodically do a check to see if what we choose to select as relevant really helps us- or do we hold it because we have held it for so long it is comfortable.
Moving averages would be the 1st TA indicator i would use- Depending on one's time frame, and i will assume Daily swing trading- holding positions for days-possibly a few weeks-
2 moving averages- one faster , one slower- Your choice- To Test the relevance of whether these 2 indicators add to your trading , you have to understand that these are lagging indicators-
If you use a 20 ema and a 50 ema - The 20 is the weighted average of price over the past 20 days. In a nice uptrend, price bars will be well above the 20 ema line-
If you want to get closer to price action, you can experiment with faster periods for the 2 lines-
You can employ any combination of time periods for your moving average lines- you can use EMA- (Exponential-weighted more towards the more recent periods- or SMA- smooth equal average
weighting. or one sma and one ema- You can also add as many emas as you choose- up to what your program allows.
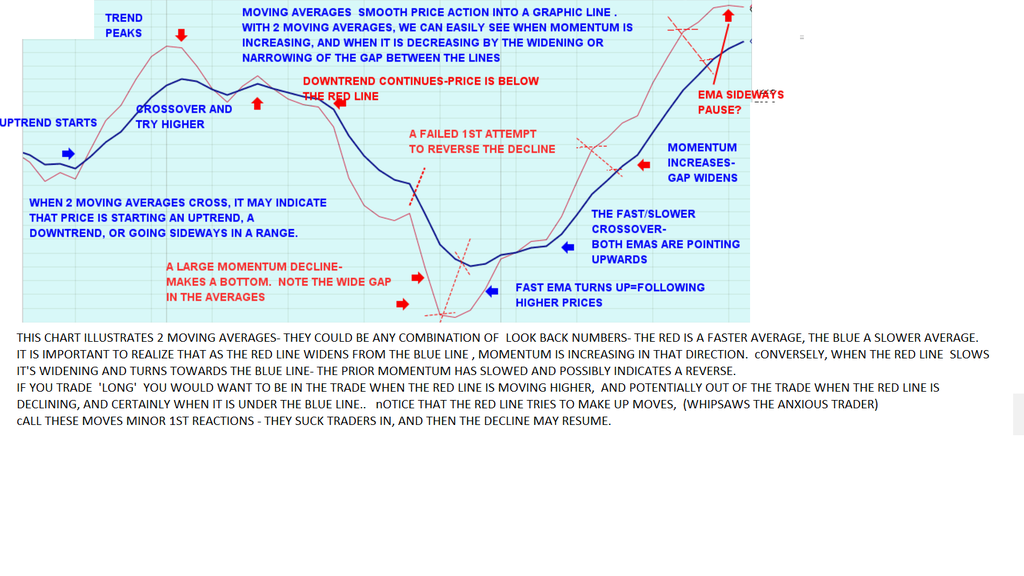
In the attached chart- I am only showing 2 moving averages- no ticker- no price- It does not matter what periods they are set at- for the purpose of this analysis. They are at different periods .Faster and slower.
The red line is the faster and the blue line is the slower -
The faster line only goes up when price has moved above it. If both the Red and Blue are pointing upwards and spaced apart- with the blue below the Red- Price is higher than the red and considered to be in an uptrend.
You would like to be on the red line while it is going higher above the blue line- You would want to be off the red line if it is declining below the blue line.
IF both lines are criss-crossing somewhat sideways, you are in a range- waiting or an uptrend or a downtrend to unfold- Markets do not always Trend- Sideways ranges can give false crossover signals that need to be understood -
With the 2 averages- let's assume we are using a 10 ema and a 20 ema-
The lookback is the average of the prior 10 days compared to the average of the prior 20 days. When the uptrend is continuing and momentum is working- the fast line will widen away from the slower 20 line- Notice- that at times it gets very wide, and inevitably will come back closer- to the 20 (Reversion to the mean) Meaning buying momentum slowed, investors are considering to buy more- some are selling and taking profits, waiting for new buyers to step in. Price may go sideways as investors try to determine a value at this price level.
While the fast line was uptrending, price is typically CLOSING higher than the ema- If price pullsback and makes a close below the ema it is perhaps just a pause- or perhaps a sign of something more.
If you are using a 20 ema and a 50 ema, and price closes today below the 20 ema, it is likely that some days earlier it closed 1st below the 15, 14,,13,12,11,10,9, 8,7,6,5,4 emas- because each of them represents a line that progressively follows uptrending price action closer.
The closer(faster) a Moving average is : the more likely that price will come back to hit it, penetrate it intraday, or close below it. This is where a trader has to choose how to interpret the price action.
When price is trending, I want to see price close above my fast ema line- It may penetrate it intraday- on volatility- but i want to see how it closes- If it closes below the fast ema- it is a potential warning that the momentum has slowed- and perhaps i might want to consider tightening a stop-loss- Without knowing what caused the drop in momentum- Obviously no new buying pressure- but what was the reason ? Was it market or sector weakness? Buyer exhaustion- needing a small pullback and consolidation, or was this the temporary top and a more substantial pullback be ready to occur? Since the moving averages are "LAGGING INDICATORS"- They are many Days behind the actual price action.
For shorter term holding periods- i prefer employing faster moving averages-
If you view a chart of a stock of your choice- instead of just using the typical canned moving averages- change the settings - and then look back over the price swings and see which setting corresponds with changes in the price that benefits your style or holding period.
Just for the record- this chart is a 4 ema and a 10 ema-
Notice- when i get to upload the chart with the candlesticks-(not tonight) it did a commendable job of indicating directional swings- not on the line crossover, but on price moving above or below the fast line. There will always be exceptions, always whipsaw signals- The question one needs to ask in considering to employ TA is will this help keep me on the correct side of the trade direction- and there will be failures and false signals- But- will it "Improve" or help to define the present approach?
 |
|
|
|
Post by sd on Jul 27, 2016 18:27:07 GMT -5
wED- 7.27.16 fED SPOKE- Don't know what occurred- Today's leaders -Miners, Biotech, Pharma! 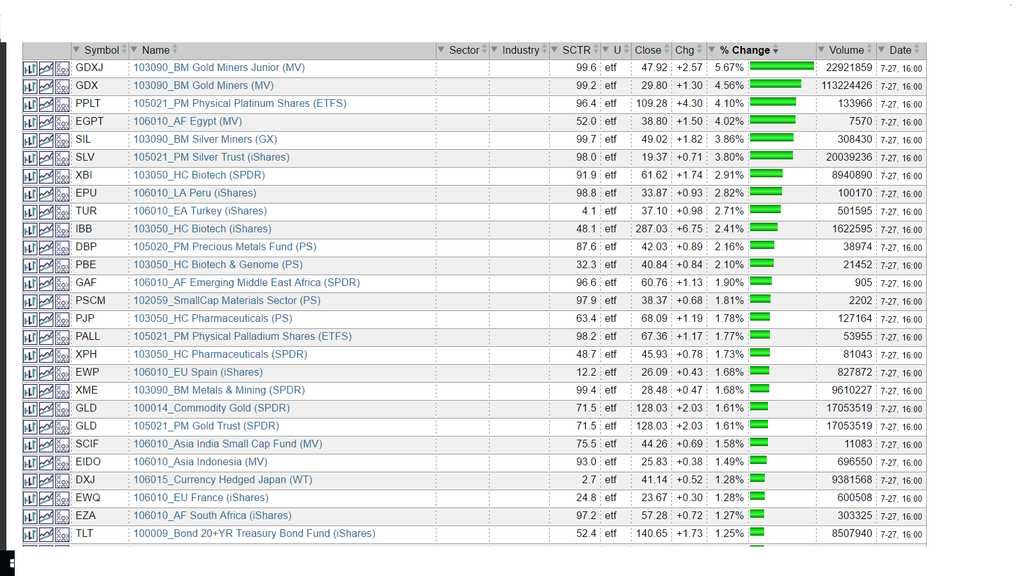 |
|
|
|
Post by sd on Jul 27, 2016 19:36:02 GMT -5
fOLLOWING UP ON MOVING AVERAGES:
If i was a position trader seeking to hold a position through wider volatility swings, I would likely use a combination of slower moving averages to reference price to-
perhaps a 20 ema and a 50 ema for a long term investment- but understand- there is a lot of real estate between where price was and when it drops below the 20 ema, much less below the 50.
That means the percentage decline in price is quite large by the time these 2 indicators both decline and have a crossover.
For swing trading, references should be more tailored to that which is more relevant to the current price action- so faster EMAs could be employed to alert the trader to what the price action is doing in terms of the ema direction- which can define the trend direction..
IF all of the ema time frames are pointing up- an uptrend is in place- If they are all pointing downwards, a well defined downtrend is in place.
The faster the ema one uses, the more volatile will be the results- Potentially providing earlier signals- but also more likelihood of getting short term reactions and whip saws.
In my present swing trading at this time- I will be using the faster emas for a quick reference on the Daily chart.
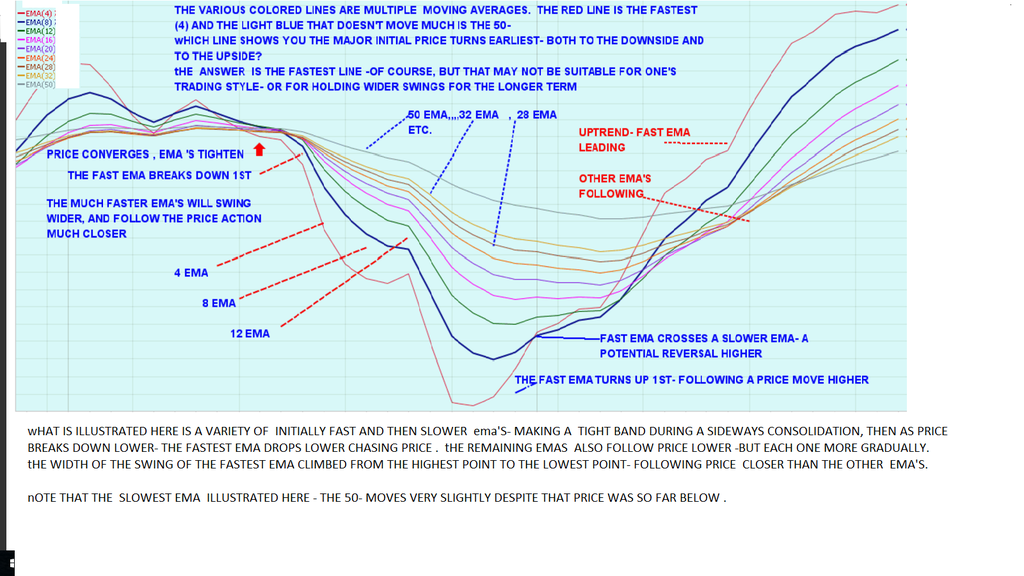
The pretty picture in the chart reminds me of ribbon candy we used to see at Christmas-decades ago-
The relevance - as illustrated in this wide swing- would be that the trader that responded to the fastest ema to get out on the initial weakness- and to get back in on the upturn and potential strength, captured the majority of the price movement.
If he waited and used a slower ema, his exit on weakness was a day or two-or three later, and his reentry was a day or two, or three later as well- reducing his net opportunity for reducing loss on the decline and capturing gain on the move higher.
The purpose of this chart- without any bars or candlesticks- is to provide some clarity in seeing what actually occurs with the moving averages as reference points-
In this example- without seeing the confusion of the volatility of price bars- one would likely rather exit on the faster ema decline, and reenter on the faster ema incline-
This chart almost says "This is "Obvious" - But wait until daily bars are inserted. You can see what draws you in to react too early- or too late.
As an additional "this is so obvious" Instead of posting a chart with a bar or candlestick, I will next post a Renko chart- which allows you to ignore the high and low and only record the actual open-close with the range of price volatility. Then followed with a candlestick chart on the overlay.
 |
|
|
|
Post by sd on Jul 27, 2016 20:05:43 GMT -5
Moving averages are lagging the price action- and actually "Smooth" the price moves by averaging what has occurred over the prior periods-
Exponential (EMA) gives more "weight" to the more recent periods- and SMA -simply gives equal wt- not important at this point.
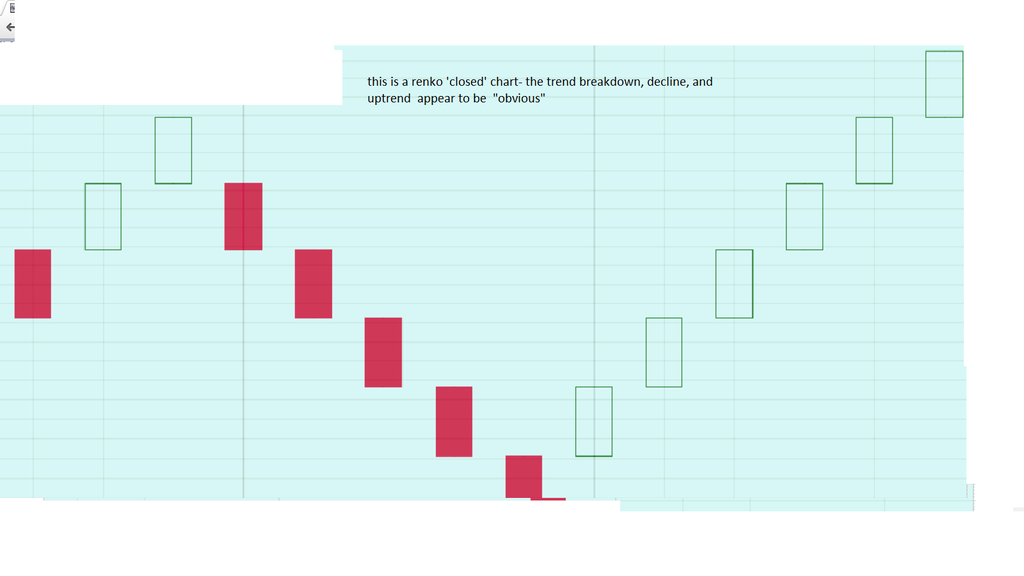
Renko charts are based on a box being displayed when price moves beyond a certain average range- Renko charts can be set to ignore the intraday price fluctuations using a "Close" setting- which sees only the high and lows between the Open and the Closing price and ignores anything above or below as not significant.
The value range of each "box' is based on the Average True Range of price movement over the past (put in your desired lookback periods ) 10, 50, 100 days. etc.
The renko chart eliminates a lot of "Noise" seen in candlestick charts and focuses on capturing the meat of the price movement- as more important to where price starts, and where price ends based on the past average movements.
 |
|
|
|
Post by sd on Jul 27, 2016 20:26:17 GMT -5
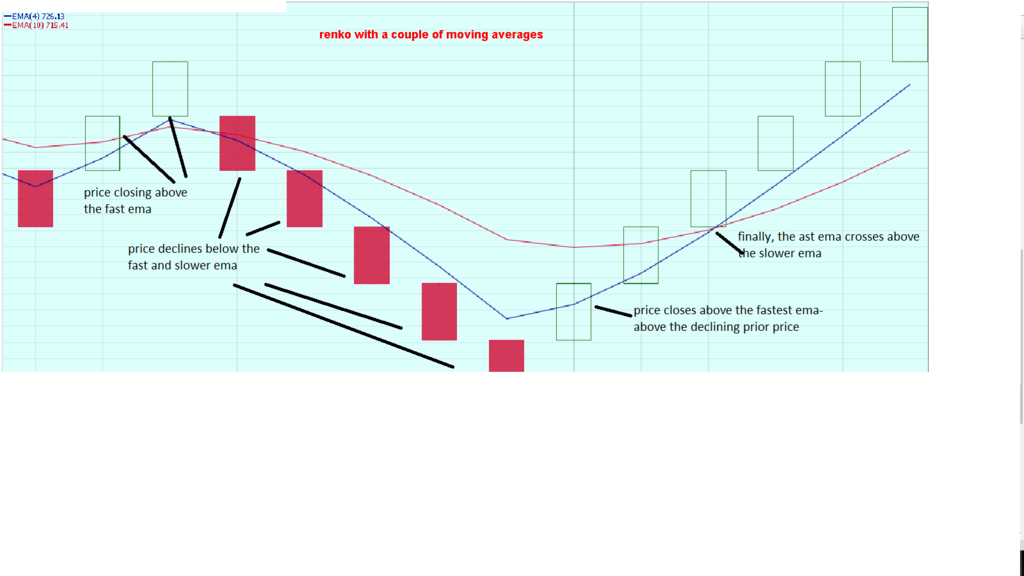
i've taken the Renko chart/close and added back in a couple of fast Moving averages-
Notice- that the Renko chart shows a reversal, and it is only several bars later that the moving averages make a cross higher-
To some this may be obvious- but Renko charts disguise the volatility of a bar or candlestick chart. But useful in this example of illustrating price movement around moving averages.
A side note here- I think that daily traders could benefit by checking out a faster renko -Hi-Lo on a 1 hour setting.
 |
|
|
|
Post by sd on Jul 27, 2016 20:54:14 GMT -5
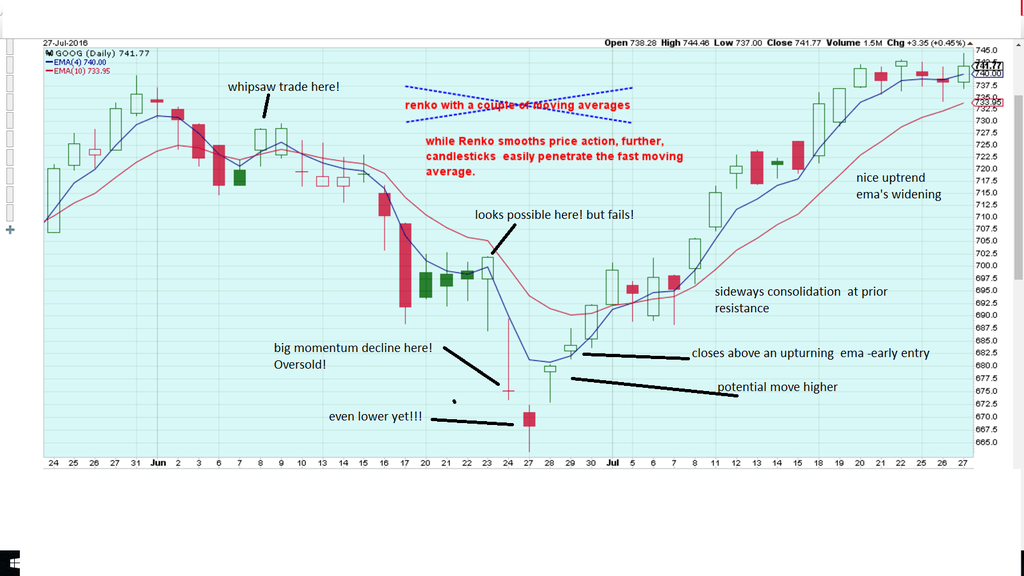
here is the trade example-GOOG over this period.
The price action is shown in this chart.
Where the moving averages and the Renko charts appeared more obvious, they smoothed the volatility of the daily price bars.
In the smoothing process - the highs and lows are averaged out- but the bulk of the trade direction is usually left intact.
For swing traders- it might be more useful to not react to the daily chart unless compared to the smoothed charts of moving averages-
Keeping out of trades in a decline- and entering earlier in a possible uptrend- are but a starting point-
Understanding where price is in relation to the prior past action is captured on a couple of moving averages
 |
|
|
|
Post by sd on Jul 28, 2016 6:38:45 GMT -5
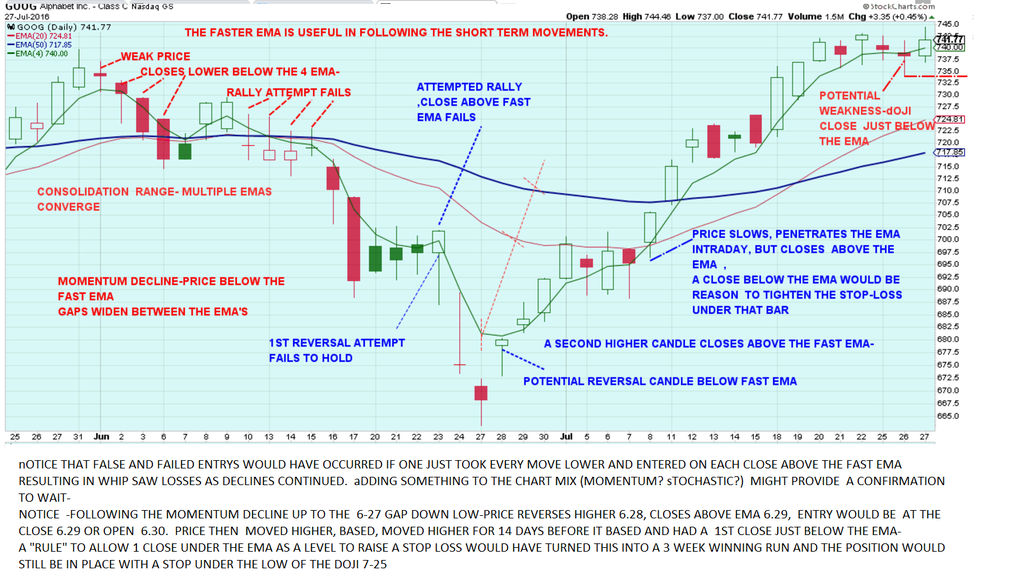
IN THIS CHART, ILLUSTRATING HOW A FAST EMA OR SMA THAT IS CLOSER TO PRICE WILL ALSO GIVE MORE POSSIBLE EARLY SIGNALS THAT FAIL- SO TRADES MADE ON JUST THE PRICE TO THE FAST INDICATOR NEED TO BE VIEWED WITH THAT IN MIND-PERHAPS VIEWED IN THE CONTEXT OF THE TREND DIRECTION, MOMENTUM ETC, THAT FAILED SIGNAL PERHAPS WOULD NOT HAVE BEEN TAKEN - OR A PARTIAL POSITION ONLY.
WHAT I HAVE NOTICED WHEN PRICE DECLINES, IS VERY OFTEN THE 1ST RALLY ATTEMPT WHERE PRICE CLOSES BACK ABOVE THE FAST EMA SHOULD BE CONSIDERED SOMEWHAT SUSPECT-
uNDERSTANDING THAT THIS IS INDEED THE POTENTIAL IF ONE REACTS TO EACH AND EVERY CLOSE ABOVE THE EMA- , IT DESERVES TO NOT BE USED BLINDLY AS A CONFIRMED ENTRY SIGNAL.
iT SHOULD BE VIEWED IN CONJUNCTION WITH THE OVERALL TREND DIRECTION AS HAVING THE MOMENTUM . THE ISSUE TRADERS WILL HAVE INTRADAY IS TO "WAIT" FOR A CLOSE ABOVE THE EMA AT THE EOD ON WHAT APPEARS TO BE A BULLISH MOVE INTRADAY-
IN THIS CHART EXAMPLE- NOTICE THAT SEVERAL FAILED RALLY ATTEMPTS IN JUNE MADE CROSSES HIGHER THAN THE FAST EMA- SIMPLY TAKING AN ENTRY ON THAT ALONE WOULD HAVE RESULTED IN 2 LARGE GAP LOWER.
ADDING ANOTHER 'CHECK' TO ONE'S CHART AND TRADE DECISION (LOOKING AT A LARGER TIME FRAME TO CONSIDER WHERE THE ENTRY IS WITHIN THE LARGER TREND, AN ADDED INDICATOR- A POSITION RULE ON PARTIAL ENTRY ETC)
A RULE TO NEVER ENTER LONG WHILE PRICE IS DECLINING AND CLOSING BELOW THE EMA MIGHT SAVE A LOT OF FAILED ENTRIES ON WHAT APPEARS TO BE A BULLISH PRICE ACTION DURING ONE OR TWO DAYS.
WHILE THERE POTENTIALLY WERE SOME LOSING TRADES TRYING TO CAPTURE THE MOVE HIGHER BEFORE THE 6-27 LOW, THE ENTRY SIGNAL CLOSE ABOVE THE EMA 6-29 WAS FOLLOWED BY 18 !!!! DAYS OF PRICE CLOSING ABOVE THE FAST EMA- NOW THAT IS CAPTURING A TREND- AND THE TRADE POSITION WOULD STILL BE IN PLACE- BUT A STOP WOULD NOW BE RAISED BELOW THAT WEAK CLOSE LOW.
PRICE EASILY PENETRATED THE FAST EMA DURING THE DAY THOUGH- SO A INTRADAY TRADER WOULD HAVE SOLD IF THEY DID NOT HAVE A RULE TO ALLOW 1 CLOSE UNDER THE FAST EMA.
OK, NOTICE THE OTHER 2 SLOWER MOVING AVERAGES- PRICE CLIMBED WELL ABOVE AND WELL BELOW IN THIS CHART. IT'S IMPORTANT TO REALIZE THAT WHATEVER MOVING AVERAGES ONE USES- WAITING TO REACT BASED ALONE ON A MOVING AVERAGE CROSS ANOTHER MOVING AVERAGE- WELL, A LOT OF PRICE ACTION HAS OCCURRED BEFORE THAT MOVING AVERAGE CROSS HAPPENS. FOR UP TRENDS, YOU OBVIOUSLY WANT TO SEE THE MOVING AVERAGES STACKED IN PROPER ORDER- FAST 1ST, FOLLOWED BY THE NEXT SEQUENTIALLY.
WHAT MOVING AVERAGES ONE USES, AND WHAT HOLDING PERIOD AND VOLATILITY IN PRICE SWINGS ONE WANTS TO HOLD THROUGH- ARE UP TO THE INDIVIDUAL TRADER-
I THINK EVEN DAY TRADERS WOULD BENEFIT BY UNDERSTANDING THAT HOLDING A TRADE FOR A LONGER DURATION (PERHAPS HOURS OR THE ENTIRE DAY IF THE TREND STAYED STRONG-SELL AT THE CLOSE OR TRAIL UNDER EACH PRICE BAR AT THE CLOSE) .) -REDUCES COMMISSION COSTS AS WELL AS CAPTURING THE LARGER MOVES. NOTICE THAT SIDEWAYS ACTION IS "NORMAL - AND NOT IN ITSELF A REASON TO GET SHAKEN OUT OF A TRADE UNLESS IT BREAKS DOWN . tHE GUIDELINE "RULE" OF ALLOWING A CLOSE UNDER THE FAST EMA BEFORE TIGHTENING A STOP IS SIMPLY ONE EXAMPLE OF EMPLOYING A RULES BASED APPROACH TO ONE'S TRADING- AND THEN TEST THAT RULES EFFECTIVENESS BY DETERMINING HOW IT PERFORMED OVER THE PAST DAY, MONTH, YEAR ETC TO SUIT ONE'S TRADING STYLE.
 |
|