|
|
Post by sd on Jul 28, 2016 7:24:08 GMT -5
precious metals moving strong seen in ETF's-
Looking at slv to break through recent prior highs $19.45 buy stop order (already over that premarket ) limit $19.60 late to work....
|
|
|
|
Post by sd on Jul 28, 2016 20:19:12 GMT -5
Guess my print size was a bit large- could read it across the room without the glasses!
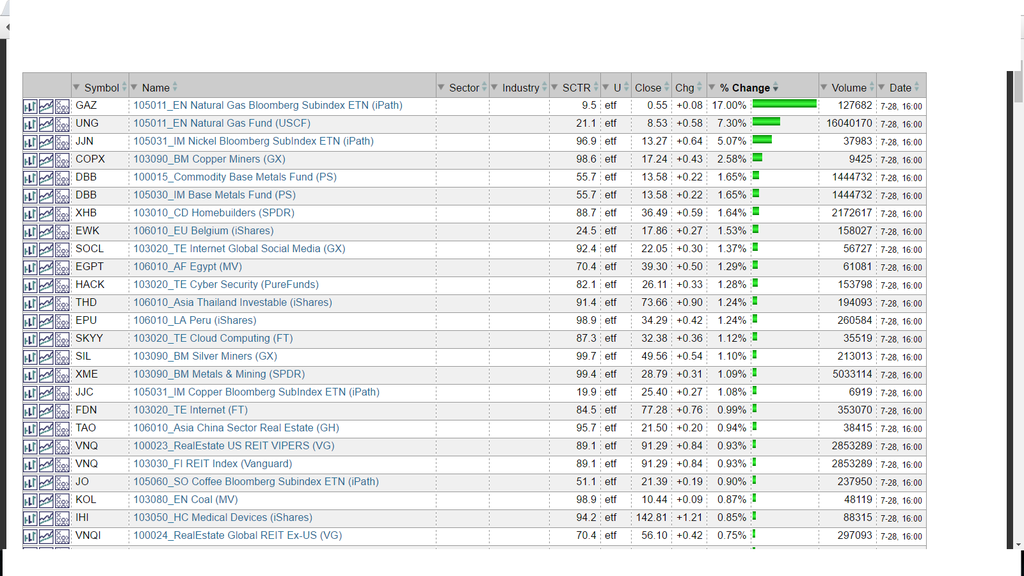
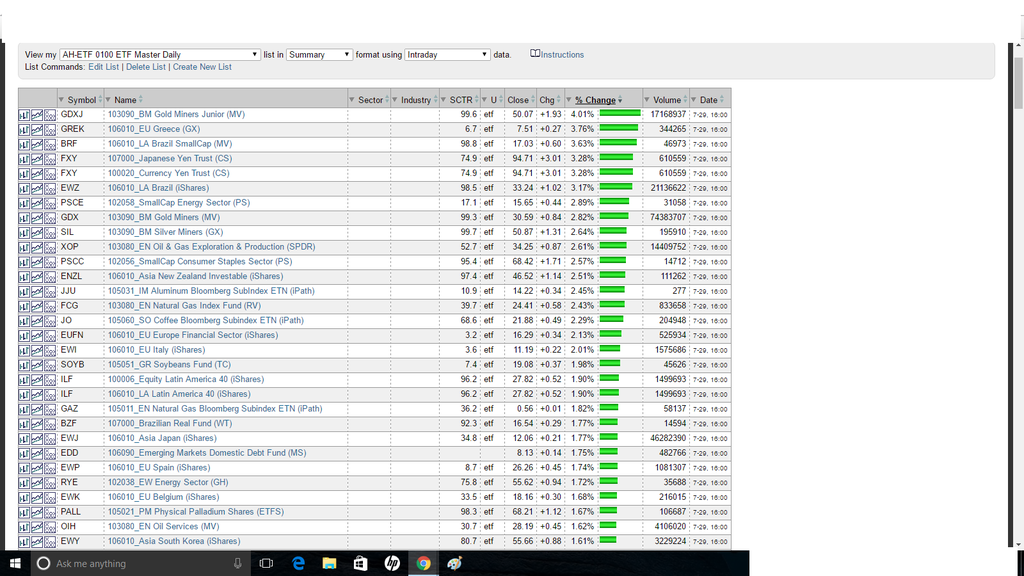
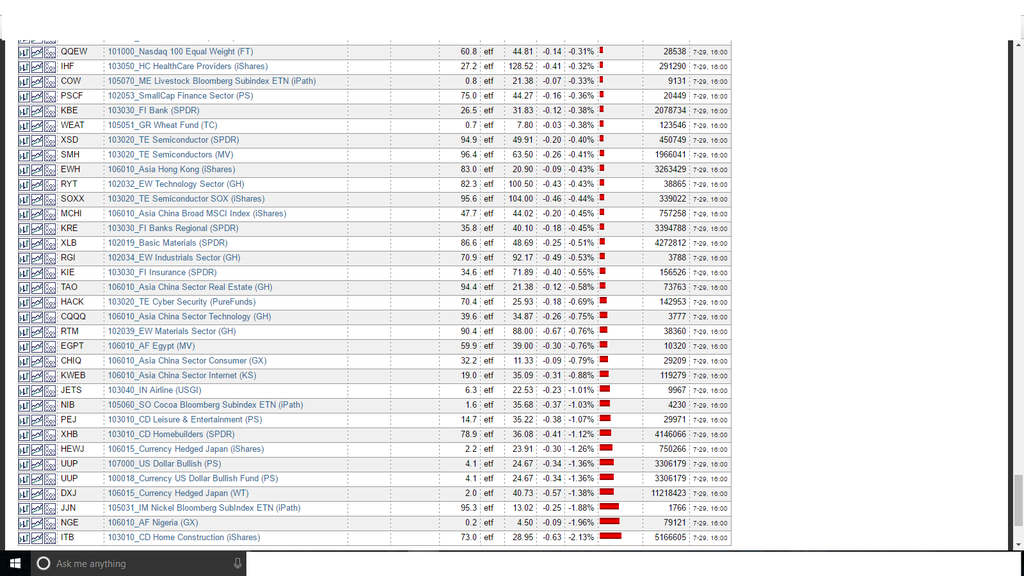
I'm posting a chart of the Daily leaders for today from the stockcharts 300 list-
I'll try to remember to do this everyday-
NOTICE- there is a lot less green today in this list-!!! suggesting less wider market participation- and one could read into those that did move higher
Nat gas was the big winner- also the DBB fund i cautioned Blygh about was up nicely today- which means the majority of the stocks in that sector universe were positive-Hope his pick did as well.
unless it was cap weighted- I am not sure-
Either way, I think this chart list is a great screener to see sector rotation within different indexes andx market segments - If anyone is interested, i could post the weekly as well.
Eventually, i would seek to drill down with the sector group to find the leadership within that sector that is bringing the momentum results home-
 |
|
|
|
Post by sd on Jul 28, 2016 20:40:58 GMT -5
A lot of inside bars today- and the master list shows a large reduction in green-
My Buy order for SLV was an inside b ar and did not fill-
Commodities are seeming to be at the top of the list- which suggests to me that a certain amount of investments are going into "Safer" basic commodities-
Of my active trading positions- DOG- Dow short made a minor gain, curious that the Dow is not participating- HACK moved up again,
HPE is flat in a sideways consolidation- Has not broken the rule of a closing bar below the ema- but the indicator and stoch are in decline- a break lower is expected, but not penetration through the prior base range. i think a $19.60 stop level will be wide enough to be outside the normal volatility swings.However, that is below the recent range lows, and with the overall market flat- i will tighten the stop to $19.98 . This increases the likelihood of a whipsaw, but reduces the pain.
A stop-loss will be raised on the recent move higher. HPE had a gap move higher breakout- is sideways- and may retest-
A too tight stop under the price does not take into consideration normal price action & volatility- Gaps are occasionally tested.
We will see what transpires- but -for the record- This is on the "raise stops" list.
|
|
|
|
Post by sd on Jul 30, 2016 7:03:36 GMT -5
i'M TRYING TO POST CHARTS IN THE HORSE RACE- 1 MIGHT HAVE POSTED- HOG- CAN'T TELL- I GET AN ERROR MESSAGE-TRYING TO POST MMSI THERE AS WELL-I WILL TRY TO POST IT HERE IN THIS THREAD- 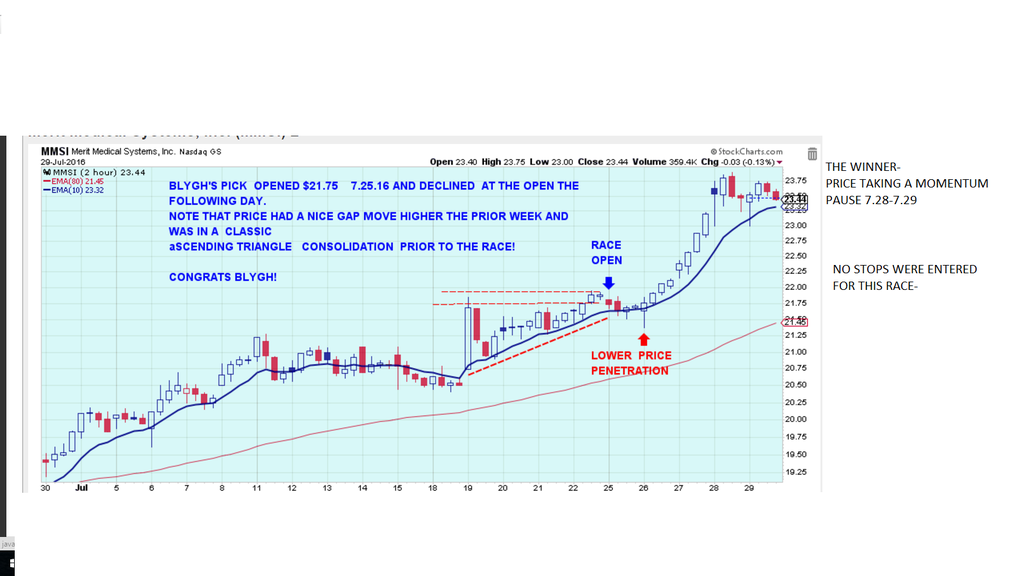
|
|
|
|
Post by sd on Jul 31, 2016 9:54:19 GMT -5
In this chart, I am including a couple of Indicators.
I have quickened the indicators by putting in shorter time values in the look back period.
Various indicators are built based on comparing 2 different values-
For example MACD common settings are the 12 , 26, 9
stockcharts.com/school/doku.php?st=macd&id=chart_school:technical_indicators:moving_average_convergence_divergence_macd--
One can change the indicator settings and vary the values- to make them quicker, or slower. With quicker- comes faster signals- and more "false" or Failed signals.
With slower settings, the indicator is slower to react to minor movements- potentially longer holding periods can also be the outcome if one can stay in a trend with some wider pullbacks.
Aside from price action, some moving averages, one can add in some indicators to confirm what one is seeing in terms of price action.
Indicators Lag price. Price action tells a story- indicators take the past look back period to "suggest" an interpretation. One might want to "react" to today's price action- bullish- or bearish- but indicators lag and can keep things in context- a single red bar may indicate a higher open and lower close, but does not necessarily mean the uptrend is violated.
Putting an indicator in the charts can keep the price action movements in context- confirming -the price action or not---
May keep the trader in a winning trade longer, exit a pullback on weakness and take a smaller loss.
Indicators need to be "Backtested" on how often the signals improve ones trading results- or is a detriment.
Within this thread- and with limited time- I will be showing some indicators and try to demonstrate- how my trading could be improved-or not-
with the inclusion of Indicators.
Stockcharts.com has a Chart school section that is Free and describes a large variety of Indicators, the construction, and the potential application.
There are also links to other articles- Such as this article on a weekly approach employing Indicators. I only included it because as part of it's weekly approach, it also includes some thoughts on refining the approach depending on trend direction, reduced position size in a declining trend vs an uptrend- tighter stop-losses in a downtrend reversal, and wider stops in an uptrend pullback.
These are just some variables a systematic approach can evaluate.
Also, if one wants to employ the criteria one likes in a scan, it would present a narrower list to review.
technical.traders.com/archive/articlefinal.asp?file=\V29\C01\004KONN.pdf
stockcharts.com/school/doku.php?st=macd&id=chart_school:technical_indicators:moving_average_convergence_divergence_macd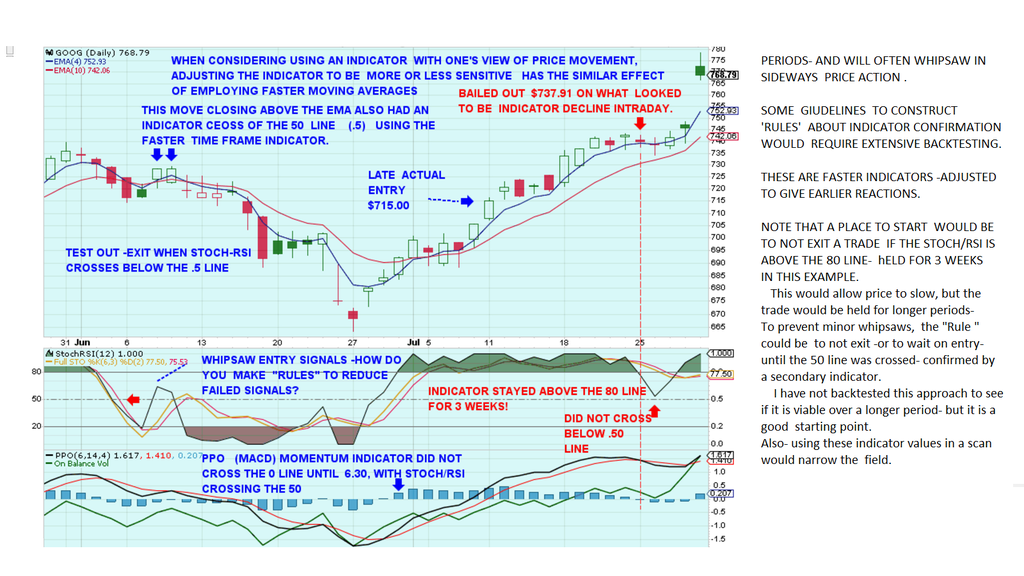 |
|
|
|
Post by sd on Jul 31, 2016 10:52:57 GMT -5
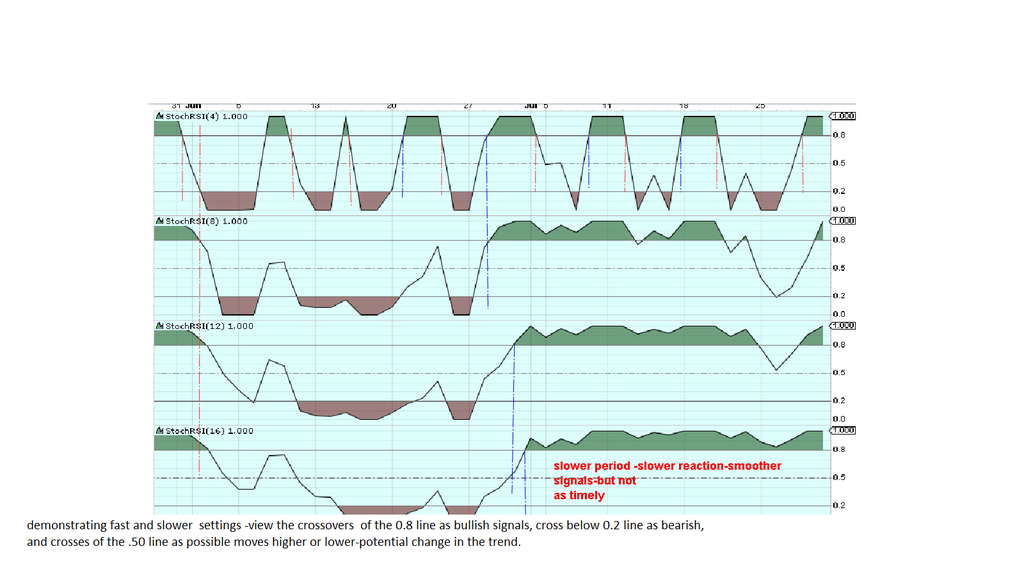
Chart here is demonstrating the differences and reaction times one sees in varying timeframes of indicators. It would be up to the individual to determine what is most appropriate for their style, Risk tolerance and Trading time frame. Price chart is not included -simply wouldn't fit in the photo.
As can be seen -from the fastest to the slowest- the cross over of the 80, 20, and 50 usually occurs sooner or later depending on the time frame.
I'll be experimenting with a variety of different indicators in the weeks ahead, and will try to post & compare the variations I may use-
The goal would be to eventually outline a trading plan for myself , that is not discretionary, but more systematic.
On occasion, I may have intraday access to initiate a trade- but if the markets are trending - I would prefer to hold a trade for the longer period.
 |
|
|
|
Post by sd on Jul 31, 2016 11:10:04 GMT -5
I also hope to be able to make better use of available technology- to reduce my time spent in stock or ETF selection for both the horse race and in trading in general.
taking notice of sector rotation within the industry groups, may uncover growing weakness or strength in a group that will likely affect the individual performer within that group.
Home builders, Dollar showed in the red Friday, while Gold miners, medical ,biotech, even Base metals closed higher.{/font}
 |
|
|
|
Post by sd on Jul 31, 2016 16:59:24 GMT -5
Perhaps we have an existing thread somewheres that Trading resources- websites can be listed that members have found to be of interest. Please let me know.
If such a thread exists, I would add some sites to it. As i am trying to stretch my limits and improve in my trading , i think reviewing and drilling down to find which sectors are leading, what industry groups are gaining in strength, who are the individual leaders within that group propelling it higher....Screeners become a tool that one might use to find the specific stock -or ETF- they want to take a trade on.
I presently use Stockcharts.com, and pay for the "Extra" membership- They have a limited Free Membership allowing some charts and limited indicators.
They also have lots of Free information- Chart school, etc. and for members they have screeners etc (I haven't applied them yet but am heading in that direction.
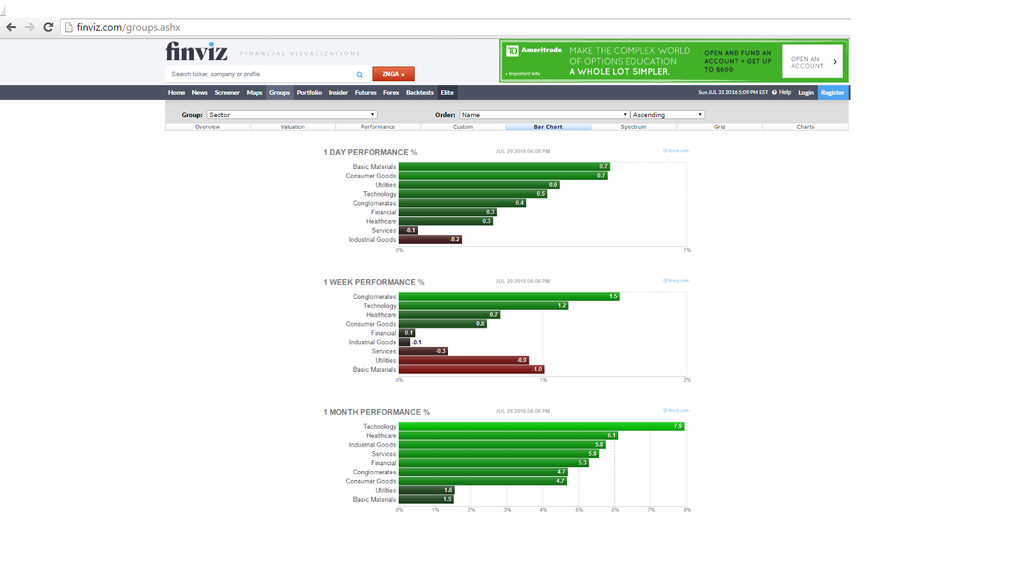
Another site is Finviz.com- also offering some free charting, and a screener that i like the looks of initially- You can sort by Industry group, and find the individual stocks within that group- I think the screener is limited -because i tried to sort by Industry group, and do a sub sort to list in the order of highest % gainers- and it sorted everything-all groups- to highest % gainers.
Eventually, i will learn to write some sort script to define what I want to look for based on technical levels.
i thought the Finviz screener looked interesting- because it also sorts by day-week,month-
So, If you have a stock you might want to take a trade on, it might be worth seeing where it is listed/ranked in terms of it's Industry group.
And compare where that group is ranked compared to the other groups-
|
|
|
|
Post by sd on Jul 31, 2016 17:14:27 GMT -5
Traders will like to test their trading skills and interpretation of Price action- in this trading simulation based on actual charts-
It tests your trading prowess compared to a Buy and hold position. This is Fun! Fast, and "educational"
www.chartgame.com/
|
|
|
|
Post by sd on Jul 31, 2016 17:39:56 GMT -5
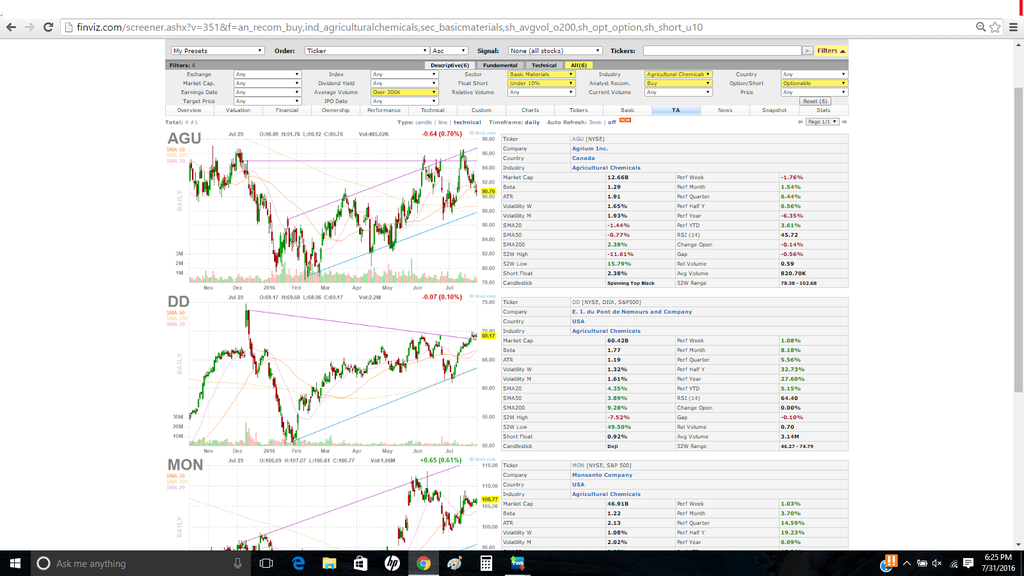
Screeners- this is a snapshot of screening a subsector of the broader industry group - In this example- The Finivez screener - Basic materials- down to the Agriculture sub sector.
As i explore "screening" , it opens up the possibility of narrowing the playing field to help one find the 'cream of the crop' within a group.
 |
|
|
|
Post by sd on Aug 1, 2016 18:53:49 GMT -5
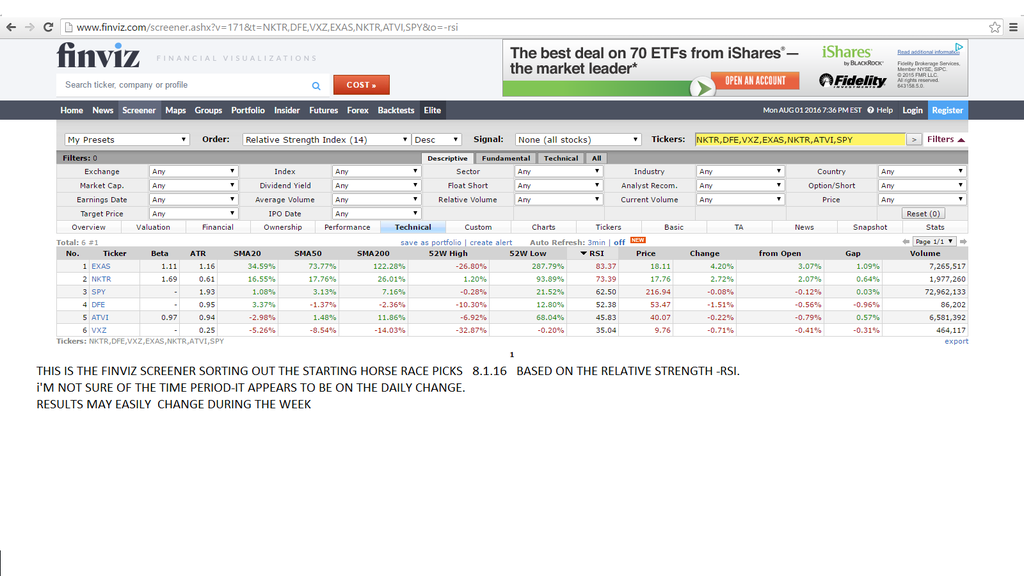
the FINVIZ SCREENER allows you to compare a specific # of different ticker symbols-
and sort them by different criteria-
in this example, I used the different Horse race picks and the Spy , and sorted by the Relative Strength-
This snapshot gives the results of today- and can easily change during the week.
what might be particularly useful though, is comparing stocks within a similar index or market segment, to determine the stronger within the group.
Also- Look at the ATR value- for the Average True Range- some traders use multiples of the ATR as a level to set their stop-losses
 |
|
|
|
Post by sd on Aug 2, 2016 19:59:01 GMT -5
I had added both SLV on a buy-stop and GDX the other day- Their gains offset my net declines in long positions-
Unfortunately- I'm sure it was Operator Error-on my part- my stop-loss orders became Market sells for EXAS and VXZ- which never declined- and only went higher-
Has to be sloppiness in my adjusting the portfolio and the stop orders automatically become market sell orders if not properly adjusted. That is an 'Automatic Order Type" and needs to be actively modified and confirmed. SLOPPY on my part-
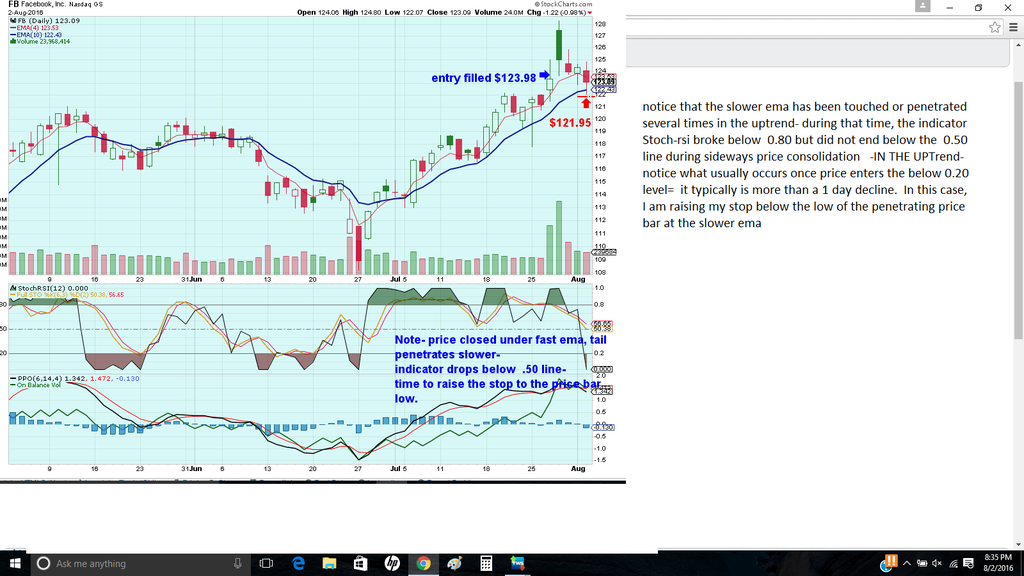
This Chart is FB- an actual recent position that appears to be breaking lower along with market weakness- Price not only closed below the fast ema, but penetrated the slower ema in a sideways range- The Stoch RSI was weak and pushing the mid line yesterday, but today's price action caused it to dip into and below the 0.20 line- Time to look left and notice what usually follows when this occurs. Stop has now been raised to the low of the penetration- The goal-instead of selling- Is to assume the price penetration was the extreme today, and that price will not continue to go lower.If it does, my stop-loss will be hit and this will be a losing trade based on my recent entry- But it will be a controlled loss. HOPE is not navigating here.
 |
|
|
|
Post by sd on Aug 3, 2016 20:09:52 GMT -5
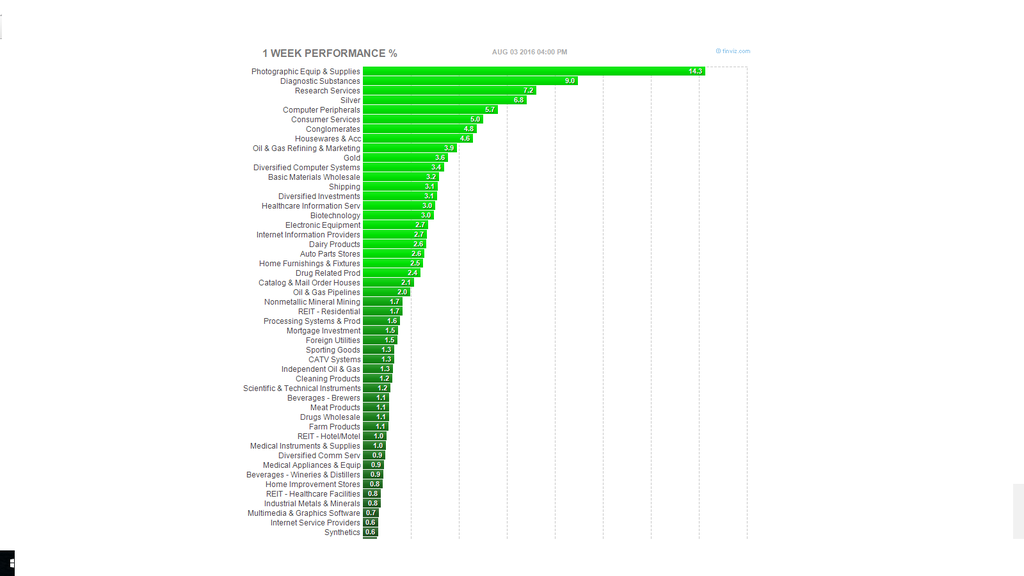
Finviz screener. allows you to scroll through industry group performance by day, week, Month, etc.
Notice the big performer of the year SLV! If you look at industry groups over the longer term. I think I will certainly have to learn to utilize a screener to save me time and narrow the selection process.
can't follow the market this week- too many irons in the fire .in the day job- .... .... Perhaps later- Nice gain in HPE in the port today.
Still holding FB but it's at the stop-loss. Dog finally had a down day, as did SLV GDX-
Looking at the longer term performance of SLV- Why get stopped out on a mild pullback?
|
|
|
|
Post by sd on Aug 4, 2016 20:10:06 GMT -5
wORK has gotten demanding this week- covering 2 separate projects-
While i am testing out my Daily Chart method- I've given it a bit of leeway- and stayed in the FB trade- I backed out and checked FB on the weekly chart/trend line, and the uptrend is intact-
I added an order to buy more FB on a pullback spike to 115= but that may not occur- As i look at the indicator signal, i also need to balance the price action between the 2 faster emas-
One thing i likely will do going forward will be to raise a stop on an excessive momentum move higher-
Still holding a number of positions, with HPE trending higher,FB consolidating?; Dog a contrarian hold- still in the money;
SLV weak - at Break Even....but i have to understand that this is a sideways range- and not overreact in a sideways choppy action- SLV had a break lower $18.40, so my stop-loss should be below that to hold the position. I'm using $18.20
GDX- I have to remind myself- that a single pullback does not mean the trade is over- I held FB in this recent multi-day pullback= but in this recent trend higher, price had several pullbacks but price stayed above the 10 ema on closes. Have to ignore the intraday volatility if hoping to hold a position longer and not get whipsawed. So easy to want to react and bail on what amounts to a minor period of weakness. Have to see where that real weakness falls on the wider time frame dAILY / WEEKLY chart. Have to maintain stops- but when comparing what occurs over the Weekly chart, it illustrates the price trend and price swings one can expect to find one self within. Multi- timeframe look backs are helpful- Noting whether the stock is within a trend on the daily, but in a range on the weekly. etc. That higher time frame can set the past boundaries of price exploration that needs to be considered on the faster time frame chart.
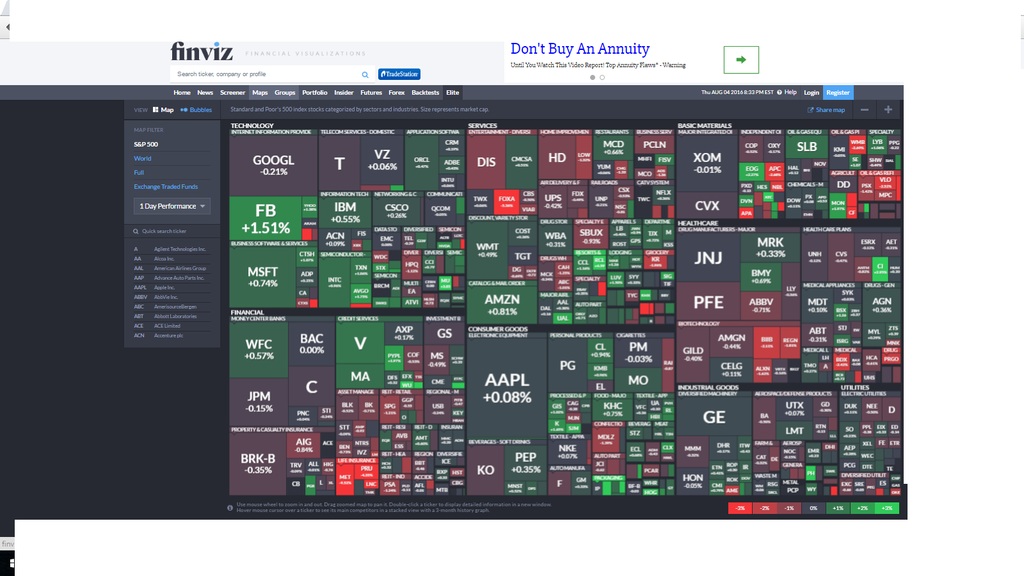
Chart tonight is the graph of the sectors map-
 |
|
|
|
Post by sd on Aug 5, 2016 19:22:11 GMT -5
A good jobs report bolstered the market to rally- My SLV position had a gap down decline- below my stop-loss negating the winning positions.
Sounds familiar- losing more than intended on the individual trade. From a Risk standpoint, the ideal stop and the actual execution price- perhaps be calculated as 2x a greater loss than one intends if a market moves price down quickly. Just a thought when pricing stops and position sizing.
|
|


