|
|
Post by sd on Aug 7, 2016 17:51:56 GMT -5
aS I GET GEARED UP FOR ANOTHER MONDAY-Workday- Adjusting my stops-paying attention this time to GTC or Day- and autofill.
SLV will likely sell at a loss if it declines further- I was also short the DOW with DOG, and that has come back to my entry level.
HPE moved up decently, and Hack is holding at a higher level. FB moved up past the recent pullback...
The markets seem strong in what is traditionally a weak month- But you have to respect what is occurring- not what you think "might' happen.
As i seek to find the best possible entries- and defined stops- I think this starts with Understanding Where the markets are - so the trading Universe- at least US stocks- are appearing to trend with a lot more making new highs than lows, That sets the TIDE- which way the momentum is flowing.....And it's into US Equities!
Within each industry group , there are leaders and there are laggards- So, picking out leaders in a group is the direction I want to go in on a Long Trade.
I think that both the Stockcharts screener and the Finviz screener will be excellent tools to "see" the outperforming Industry Groups, and then one can drill down inside those groups to find the better momentum leading stocks- I wish I was more proficient at using these tools....Practice will improve that-
My present thinking regarding trading is that you have to GO with the Flow- Trending markets are not the norm- but we are in a trending period presently- and that is opportunity knocking.
When the markets are choppy, it's likely a no-man's land where one gets whipsawed and understanding that it's OK to sit it out until one sees a definite trend occurring makes good sense.
Trader's find this out the hard way- with whipsaws -stops hit- quick rallies and then sharp pullbacks-
Traders get defensive , and want to take quicker profits to lock in gains- and in the transition to a trending market- that trader pulls the plug on the trade on an early sign of a slow in price momentum- fearing it is a downtrend unfolding- when- perhaps- it's a normal retracement.
Another way of viewing price action-to hold a position longer- is to ignore price action- simply ignore the day to day bars- and view it at the end of the day. View the closing price relative to the moving averages and the longer term trend.
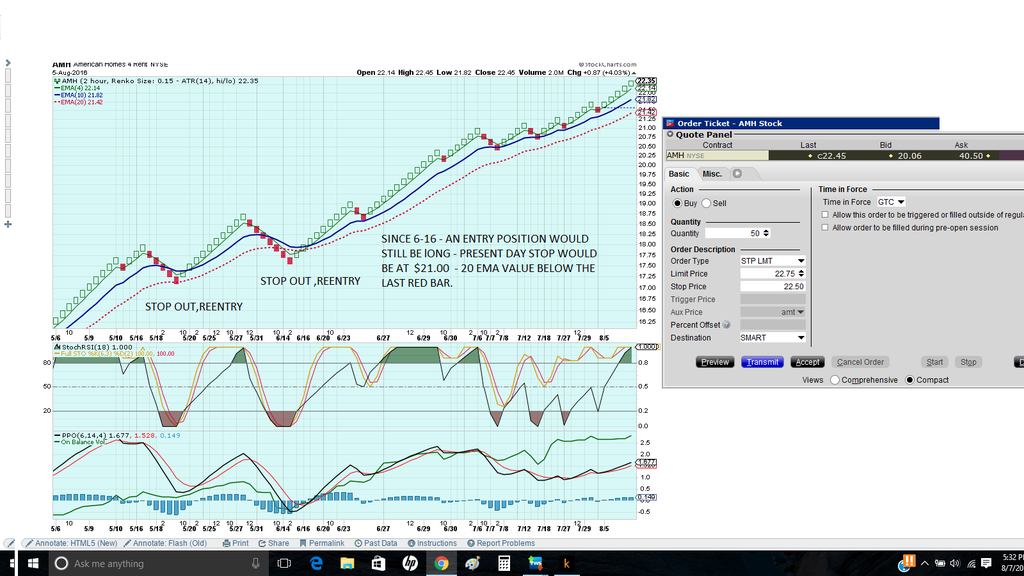
i put in a Buy-Stop/Limit order to purchase some AMH- Happens to be Blygh's pick for this week's race.
Price is extended- just had a breakout- and if one only looks at a daily chart, perhaps that looks like it just went too far-too soon.
However, Momentum is a strong force- and should not be denied as it's "too far" in the upside move.
It is natural to view the Daily price bars and want to react to them-
Perhaps---If one had a way to close out the NOISE of daily bar charts- Blinders- if you will
Renko charts do just that-
As i seek to find a longer term strategy- that still allows me to employ stop-losses- the Faster time frame Renko charts perhaps bring a new perspective worth exploring.
All of this needs to be back tested- and non-trending consolidation periods need to be recognized.
Notice this "test " period in the chart- Price stops out based on the trailing ema as a stop-loss.and a reentry is needed when price goes higher- but look at how well it captures the majority of the trend- and presently is still long.
 |
|
|
|
Post by sd on Aug 8, 2016 19:24:19 GMT -5
I was filled on AMH $22.75 at the open. it closed with a slight gain.
I was also filled on a limit on ALNY, but it declined ater my fill- but that was a pretty wide bar Friday- Still in both positions.
Went to bed early Sunday- just caught up on charts for the race tonight-
As i view the price charts- if the longer term trend is up , I may afford a wider range stop-loss- as long as the rest o the market is cooperating.
A friend asked the question about whether it would be better to be a buy and hold - or to be trading in and out.
I have heard that statistically- active traders underperform the market return by 50%. They exit late, and get back in late.
The potential for individual traders is to make a better stock selection that will outperform the market averages-Timing the market week in and week out is difficult - as the market may react strongly to some influence and then reverse a few days later.
Finding the time- and method- to follow the market rotation- and purchasing strong stocks - would be a noble pursuit.
I think this is where the Finviz screener- is valuable. and perhaps the Stockcharts screener as well- I am sure there are others out there-
Gaining an understanding of sector and industry rotation- part of the normal market process,,, may position one for better shorter term trades of weeks, perhaps months.
HSKA gapped above my buy limit order and closed higher-
|
|
|
|
Post by sd on Aug 8, 2016 19:40:22 GMT -5
I want to add that shorter term trading may seem to be profitable- but one also has to factor in higher commission costs- opportunity costs waiting for settlement- and notice the gap moves up in some of the charts of winning picks- Some follow slight declines where active traders would have exited- and missed the gap move up .
Ira's decision to go with a longer term view in LMT as his horse candidate- reflects the value that may be found in holding a single position for the longer term period.
In my recent charts, i have added a 30 period average-and seldom does that get hit in the near term in a trending market-This may seem an uncomplicated level at which to trail a stop as long as the market is trending- but be careful when the sideways consolidation occurs.
|
|
|
|
Post by sd on Aug 9, 2016 19:47:52 GMT -5
After reading a number of Articles on "Why Traders Fail",reportedly from successful traders- which I forwarded to a friend-
That friend of mine asked what my Rules are in my trading approach- A Fair question- because much of what we do -or i do- can be considered discretionary.
Now why is it called Discretionary? Because, the approach is not based on a systematic approach- .
We often respond-react- to external influences- news, and a systematic approach is designed to remove the emotion from the trading decisions.
A systematic approach may incorporate any number of inputs- from fundamental rankings- such as PE Values- to Technical rankings.
The holding period- should be decided- and -for me - since i favor technical inputs - I prefer to include some indicators in a price chart for reference.
What is a Systematic Approach? It has Guidelines- that say- You cannot enter a position here..... but you could consider taking a position there-
For myself- some technical signals- moving averages, and possible momentum- are what i am testing with real trades.
It's also about position sizing- and understanding the Risk you are taking in the individual trade to the overall portfolio value. If you place all of your eggs in one basket- That could be your undoing.
A systematic approach seeks to qualify a trade Entry or Exit based on specific information- and to separate the emotional aspects of the decision making process.
Once you have the outline of a set of Rules for Entry and also for Exit- and how you will handle volatility with -or without stops- You can "backtest" those rules based on past price action. There is no system that will prevent losses , nor that will guarantee wins- The goal will be to outperform a Buy and hold position and the likelihood of a large drawdown . "Backtesting " an approach requires "testing' the approach without adding discretionary entry or exits -- just follow the "RULES" AND SEE WHAT THE RESULTS WOULD HAVE BEEN. There are some programs out there- that can 'backtest', if you actually have a technical approach-and can define the rules.
As a Swing trader, I would hope to hold a trade for Weeks- perhaps Months- if the trend is strong-
So- Market analysis - the larger market trend may be important to consider- Sector- Sector rotation- What is the sector(s) in favor- at this time?
Call that getting a sense of the Macro market condition- If it is largely bullish, it favors going with the Tide- and perhaps increasing position size. Daily charts are likely noise- and the weekly chart better defines the market trend.
But, let's consider what Momentum is- and that is the goal of the Weekly horse race- As Ira pointed out- a longer term approach may out-perform-
but my recent focus is to "test " some of the momentum ideas- and to stay with the trade until it fails- usually determined by a close below the 10 ema as a reason to raise the stop-loss.
the end goal of a systematic approach backtest is to determine that the overall results of such an approach will exit the trade with smaller losses than it holds for winning trades - over numerous periods of time extending back into the past.
A winning approach might have a 60% losing trade- but if the 60% are all smaller, and the 40% winning are all larger- the approach is net profitable.
Here's the Zinger- a specific approach may work well with a specific stock-or ETF- but not as well in another stock/ETF. To manually backtest an approach will take a lot of chart time- going back years to get the sense of the bigger picture, and including periods of market declines.
The initial charts i am posting - a very fast ema, a slower ema, and a much slower ema- set some initial ideas as to whether the trend is intact or declining. i think i am learning that one has to wait for the price bar to close- as the volatility above and below can be misleading.
Since i am experimenting with some of these trades- Do not follow these trades as recommendations- just active tests in process.
|
|
|
|
Post by sd on Aug 11, 2016 20:03:21 GMT -5
Impressed with the steady trend NVDA on the Weekly charts- like the Energizer bunny.....Pulled it up with a 2% gain todayfrom the Finviz screener= and after reviewing the Weekly charts of the other daily outperformers- you have to look at NVDA on a weekly and simply say WOW- a 100% + gain since Feb.The other High Daily % movers were all reaction up moves from serious declines.
The end goal is to develop a strategy that already has momemtum, and to hop on board-
When faced with making a selection to enter a trade, I prefer going in the direction of the established trend, and more comfortable with considering it to allow greater range- as long as the trend stays intact.
Qualify and understand where the trend is and price on a weekly chart- Drill down on the daily, the Weekly trend supports the Daily movements.
My approach is to allow a trade some room on the daily-unless it breaks down- a Close below the 10 ema, is reason for concern, The 30 - should survive as a further stop-loss as long as there is a trend in effect- not when price pauses.
Since 7.25 holding HACK, HPE; FB 8.3 ; SLV 8.1
|
|
|
|
Post by sd on Aug 12, 2016 4:50:06 GMT -5
Looking at Agilent technology- to break above the prior high- Entry will be a buy-stop $48.50, $49 lmt.
Comparing "Chandalier Exits - a trailing stop based on the ATR values of the price action, to what I normally refer to - price losing momentum, closing below a moving average,. Just added it to my standard chart- haven't done any homework on it yet. Also buying NVDA at a $60.20 limit.
|
|
|
|
Post by sd on Aug 12, 2016 11:23:09 GMT -5
NVDA gapped high +4% on the breakout, and over my buy-stop $60.20 lmt. Price has come back to $61 over the prior 4 hours, and again moved higher-
I cannot watch this in real time, so here at lunch, I will raise my limit to $61.10, see it it pulls back again.
|
|
|
|
Post by sd on Aug 12, 2016 11:58:17 GMT -5
If- as proponents suggest, we are oi the verge of a 4th technology revolution. the companies in these various revolutionary sector may be worth some consideration. Didn't have a chance to look through them, but posting a link here for future free time.
kenshoindices.com/
|
|
|
|
Post by sd on Aug 13, 2016 15:04:01 GMT -5
One resource i have just started to use (Despite my Long membership In Stockcharts) is some of the Member's information and articles.
In the interest of sharing potentially productive information- that members or readers here may find of interest, I will post some links that I find of personal interest- I would guess that much similar information abounds in the Internet- but i simply don't have the time or desire to be searching multiple potential sites with my limited time.
i have just recently started taking advantage of my membership (renewed monthly) and reading some of the premium content available only to members- Stock charts has a number of premium content contributers- I'm not doing this to promote the site- btw- just sharing what i find that has value. If others have similar opinions of other sites, let's share that info .....
Arthur Hill illustrates many uses of TA- and in recent weeks has been writing on various results of backtesting different approaches to the market -usually for a longer term time frame- and this week's article starts by employing a 10 & 40 ema on a weekly chart to a basket of 15 different ETF's going back some 20 years- The advantage of applying a rules based approach, is that such a strategy kept one out of the greatest part of the market declines- 2003, 2008.and he compares that to a Buy and Hold strategy that had drawdowns in excess of 40% in the worst of those years.
Seeking to find a way to improve the results, he implemented some rules to sort the group of 15 broad market ETF's based on a Rate of Change -momentum strength- And rotate the positions when one dropped below a certain level.
This becomes a more systematic rules based trade approach that reduces potential drawdowns- -that- in itself is a big plus- as well as potentially bringing in larger gains- HMM- Larger gains-Lower Drawdowns....... That sounds like a win-win.
For an average individual -like myself- these articles are informative- and - may become the cornerstone of one's longer term approach- if one has the discipline to apply the techniques- to each and every trade signal .
With everything out there today that wants a piece of our paychecks, I find that the relatively small membership fee to access some really solid
TA explanations and actual applications is worth a look. One could sign up for a 1 month membership, and access all the archives to find information of value.... Up to the individual-
For myself, The Thinking behind this week's backtest study is really relevant to considering about how to manage a long term retirement portfolio. This may not be the best approach -but this outlines the backtesting process incorporating Technicals in a diversified allocation investment strategy that appears to improve the long term gains and reduce the drawdowns-
\
SystemTrader - A Timing-Momentum System for Trading Asset Classes - Vanguard Mutual Funds and ETFs
Arthur Hill | August 13, 2016 at 03:52 AM
SystemTrader // Introduction // Setting Ground Rules // Picking the Securities // Buy-and-Hold Performance // Reducing Drawdowns with Simple Timing // Increasing Returns with Pure Momentum // Combining Trend-Following and Momentum // Conclusions - Past Performance.... // Asset Group ETFs // Further Study //// ........
Introduction
Today we will dive into the world of asset class rotation by testing some trading systems using 15 securities. I will start by showing how a basic buy-and-hold strategy would have performed over the last 20 years and then see if we can improve this with a little timing with some trend-following indicators. Timing does improve the drawdowns, but the returns are still a little low so I will then turn to a rotation system based on momentum. Finally, I will combine the two systems, timing and momentum, to show how traders can improve the Compound Annual Return and reduce the Maximum Drawdown.
{font]
|
|
|
|
Post by sd on Aug 13, 2016 16:31:36 GMT -5
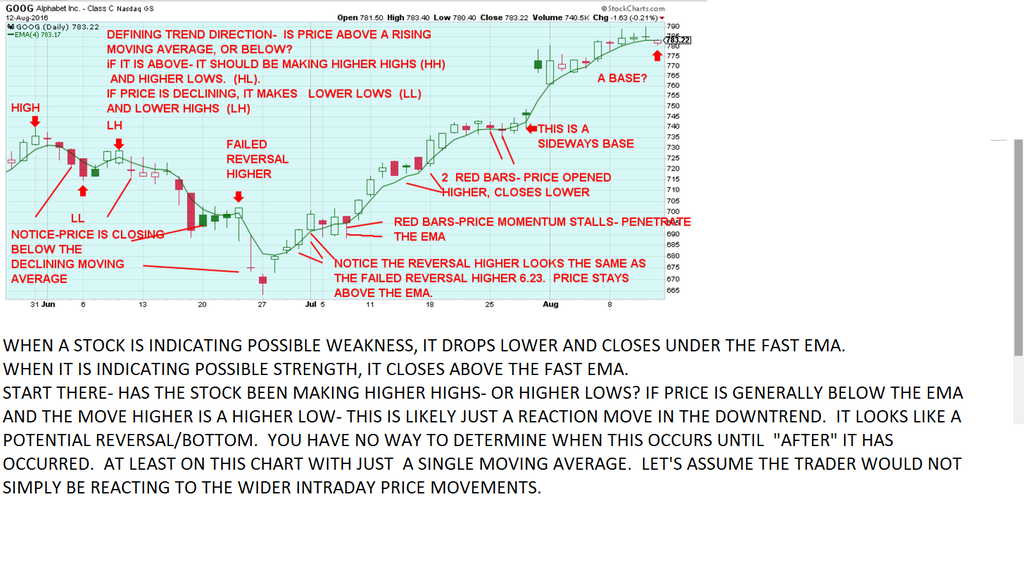
A friend of mine questioned whether GOOG has lost it's momentum Friday.
My answer would be that -Yes the momentum has slowed- but that the movement is Normal , Natural, and not to be reacted to-
For the purpose of trying to hold a position for a longer term gain, identifying when real price breakdowns occur- rather than "normal" minor consolidations- is likely a 1st step in holding as position for the longer term run . However, the start of a downtrend may often simply signal as an initial stall in the uptrend- I don't know how you get past that- just deal with it and plan to trade -and hold- on an initial weakness if the markets are holding. In the past, i have been inclined to react on early weakness, and am presently testing holding long past that 1st weak signal.
This chart illustrates price declining lower from a prior high- Notice there are rally attempts higher and some closes above the fast moving average.
these make a series of attempted moves higher- that are simply Lower Highs (LH) and go on to make a Lower low (LL) . Notice that price usually closes below the fast moving average. Disregard the attempted penetrations higher- As you should also disregard the attempted pauses and declines in the Uptrend. until the penetration reverses the momentum of the present trend, the direction holds- That will take several bars before a confirmation is assumed to be valid.
for the moment, and the purpose of this chart with a single moving average- View this with the Eye of when a trend change seems to be confirmed.
 |
|
|
|
Post by sd on Aug 13, 2016 16:42:17 GMT -5
simply adding in a second ema for consideration 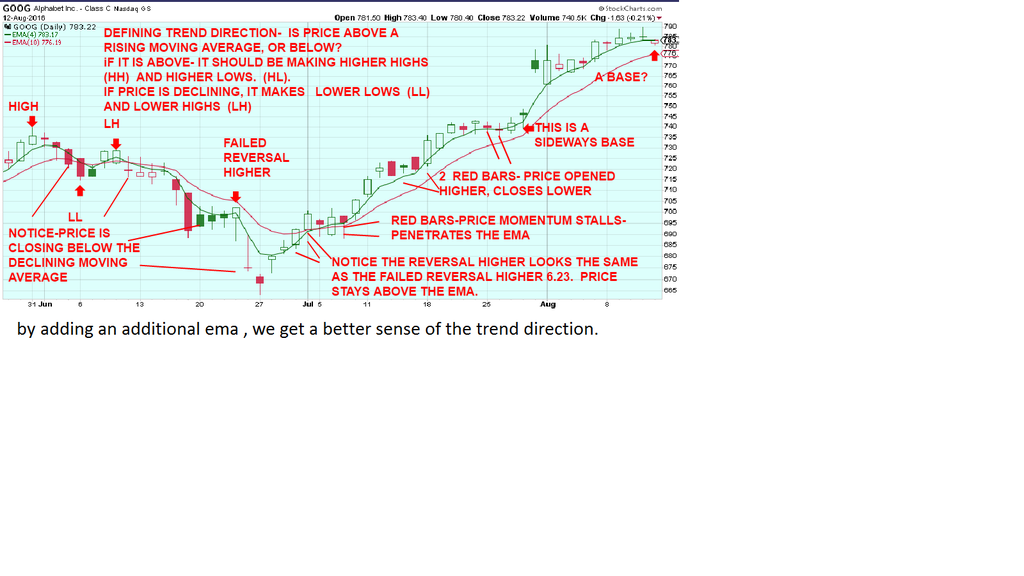 |
|
|
|
Post by sd on Aug 14, 2016 3:27:31 GMT -5
I'm illustrating some aspects of how I believe some basic Technical analysis "Guidelines" can improve MY Trading results.
Looking at a small period sample in itself is just a starting point-
The goal would be to allow Price to pause, and possibly pullback some- To essentially "Give a Little , to Make More-"
To stay in a bullish trend as long as it holds without getting shook out on minor price action weakness.
I'll illustrate with GOOG - where i took a later entry 715, jumped out on some slowing price action 730 area, made a minor gain, but wasn't in the position for the next jump higher-
I think this is a common condition - and natural reaction, as one sees the possible profits shrinking on a lower price bar.
A friend of mine also trades Goog, -also for smaller gains- more $$$ paid in commissions, ... and perhaps this will benefit him as well.
I think I covered moving averages in an earlier post-but will do so again.
In this study- I have included a very fast 4 ema, a 10 ema, and a 20 ema- This means price is very closely followed by the 4 ema-
A less reactive combination would be to use slower ema's - 10, 20, 50 - which means price would have to move further to reach the 10 ema.
Or use the 50 day, 100day, 200 day for a longer term approach for position trading.
Faster ema's will give more reaction signals- while slower emas give fewer signals, and allow for a wider range in price movement.Up to the individual
what they want in their trading- Combining your trading style- day, swing, position,investment, with the appropriate ema's are an individuals choice.
Some people trade based on ema crossovers- a faster ema crossing a slower ema- both to the upside to take a long position, and to the downside to exit.
Since moving averages are built on Past price action- They Lag behind- or tail the price action-
If price is trending- the emas are sloping upwards, with the fastest on top, and the others in consecutive order.
If price is Downtrending, the fast ema is below the slower emas and sloping downwards- When all emas are sloping downwards in consecutive order-fastest leading, middle , then slowest all in order in the decline- price is downtrending. Even If one has a big green bar day, the momentum often prevails, and the decline will try to persist lower.
If price is trending higher- and there is a red bar- lower closing price-it means the bullish buying pushing prices higher has slowed. it does not necessarily mean the trend is over- or that a downtrend may start there . (All downtrends start with a red bar -true-but not all red bars mean price will downtrend even lower) It could be a pause in momentum , or price was extended, and it will come back closer to the ema.
During periods of consolidation- or periods of attempted price reversals, the ema's will merge- run parallel in consolidations, and eventually will choose to uptrend, or downtrend- or just look like a roller coaster in a trading range. These are the most difficult periods to not get "Whipsawed"
going long because the trend appears to be in your favor, just to have price turn back lower. This happens- and price bars alone can give what appears to be bullish signals , causing one to jump in, only to find out that the trade turns against you- Limiting one's exposure to reacting to
early signals, and waiting for some "Proof" before taking an entry, is where some rules can be useful- as well as some TA exposure-
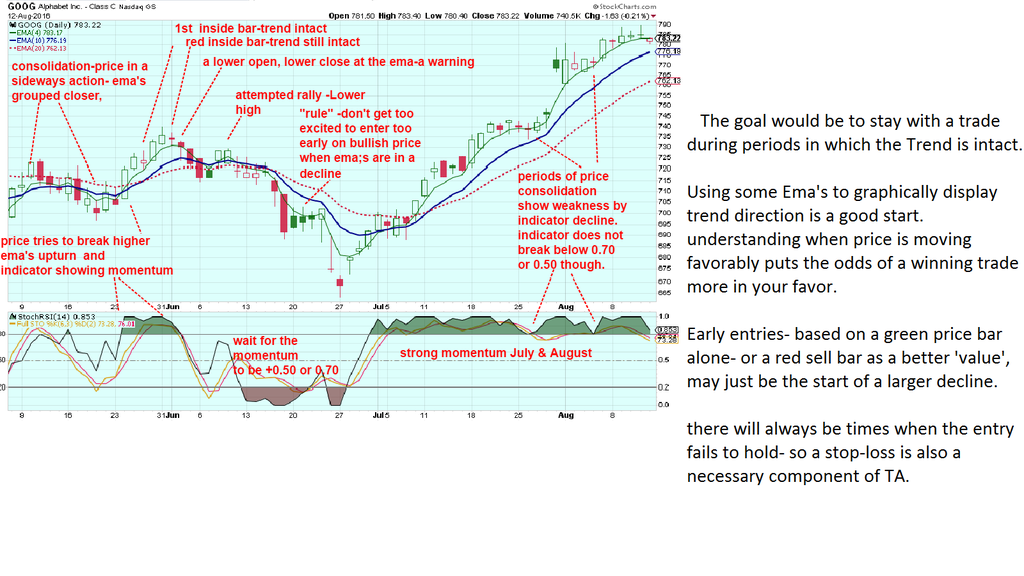
Along with some EMAs on the price chart, in the box below i have included a stoch-RSI indicator set for a faster period-
Generally speaking, when the indicator is below the 0.30 -0.50 line, it is bearish, and when above the 0.70 line it is bullish. The 0.50 line is the midway line. If the indicator stays above the 0.70 line, it will show dips during price consolidations, but will usually not drop below 0.70 without a more pronounced dip in price- The opposite is true- If price is downtrending, just a single bullish day will not pull the indicator out of oversold and above the 0.50 line. Like all things in TA, there are exceptions that will occur because the indicator is interpreting today's price action based on levels of past price action .
In the world of Indicators- when they exceed a certain value to the upside or to the downside, they are termed to be in "Overbought" or "Oversold" -
but that is not a reason to sell because it is overbought- nor a reason to Buy because they are oversold and -falsely-a better value- The terminology there is misunderstood by many- strongly trending stocks can remain overbought or oversold for weeks and months.
I will separate the chart in this "backtest" look - note the areas of price consolidation, failed signals, periods of price confirmation, then reversal and decline, and then a period of upside reversal, and long term intact uptrend- and see how using price compared with positions of the ema and the indicator would support a trade.
Note- during consolidations, emas converged- whipsaws often occur as buyers and sellers are trying to determine supply and demand .
 |
|
|
|
Post by sd on Aug 14, 2016 4:32:42 GMT -5
Here's the hard part- We all like to get in early-and capture a move higher.
Indicators with Faster settings will give faster signals-
This can result in more failed false entry signals- if one doesn't also have some other guidelines-
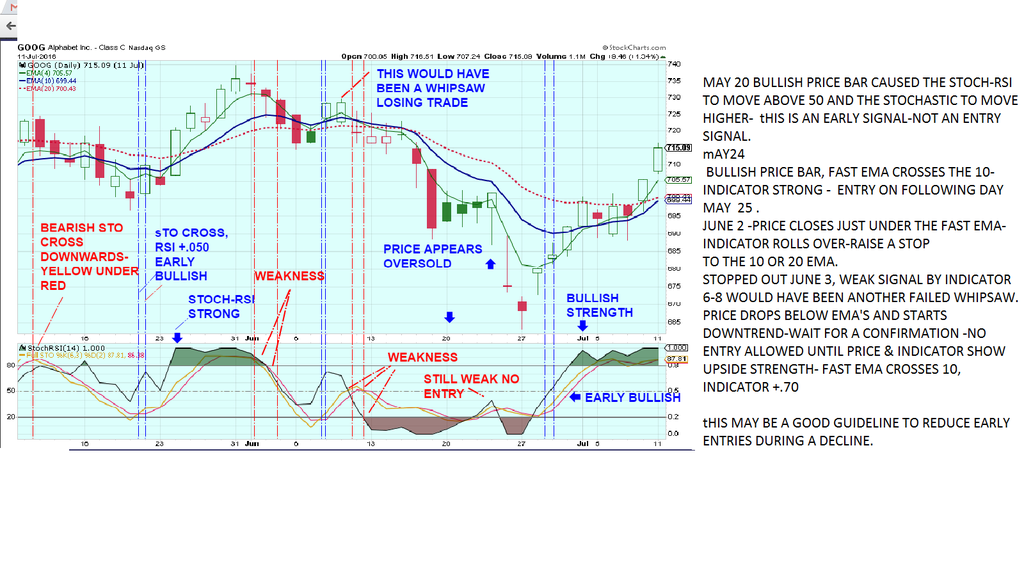
This chart of GOOG illustrates some of the results of taking a confirmed entry- moving averages and indicator confirm, and then that trade rolls over, and would require stopping out -for a small loss as price weakens.
Following that, price declines, and the indicators give some crossover readings-and price is converging around the emas- this is a non-trending condition and should be viewed cautiously- until a defined direction displays itself- There was what appeared bullish price action for 2 days higher above the averages, with indicators above the 0.50- But not is strong territory- This is where it looked potentially bullish movement was underway- but a quick entry here rwould result in being caught as price dropped below the ema's- At this point, a decline follows, and although it tries to pause and potentially reverse- (1st reversals are suspect), the stoch-rsi never got above the 0.50 median line-and when the fast ema is that wide from the slower ema- that's negative momentum that needs to be overcome- So, it's "safer" to not to try to be too early during a decline-
at the right side of the chart, price acts bullish, pushing above the moving averages, indicators show strength +.70 and moving averages upturning.
As that entry signal occurs, price then holds sideways the next 3 days with a couple of red bars included- and then it moves higher.
At that point, the 4 & 10 ema are just crossing each other and below the 30- so a hard rule about price closing under the ema needs to realize that we are not yet trending . The stop would have to be below the bullish signal bar or on multiples of the ATR (average True Range).
Another delayed entry could be to employ a Buy-Stop higher than the bullish bar that closed above the fast ema.
 |
|
|
|
Post by sd on Aug 14, 2016 5:04:31 GMT -5
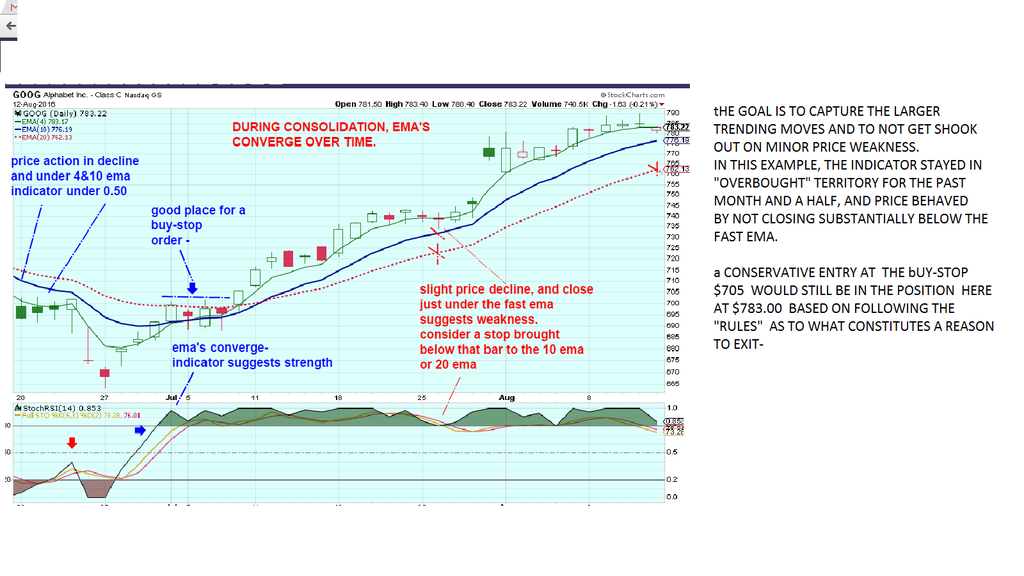
In my opinion, the goal of swing trading and stops is to capture gains when price moves higher, and stops- to reduce the potential for downside losses.
This chart illustrates the potential positive gain to be made by not reacting to minor price weakness- as that is customary during trending periods. One has to make their own decision of how much "weakness" one can stomach- But by noticing where price is relative to the moving averages- and not reacting just on a day or 2 o consolidation or slight lack of momentum- one has the opportunity to capture larger gains in a bigger trending period.
Some rules to stay with a winning trade where price doesn't violate those rules - and a plan of action When price does violate-
is a good start to becoming more systematic and less discretionary.
By backtesting the ideas one has on diffferent stocks over longer periods, one can get an assessment of how that approach performs over multiple months, years, and conditions.
Would you, the Trader- have been willing to stay and hold during this recent trending period?
 |
|
|
|
Post by sd on Aug 14, 2016 5:47:28 GMT -5
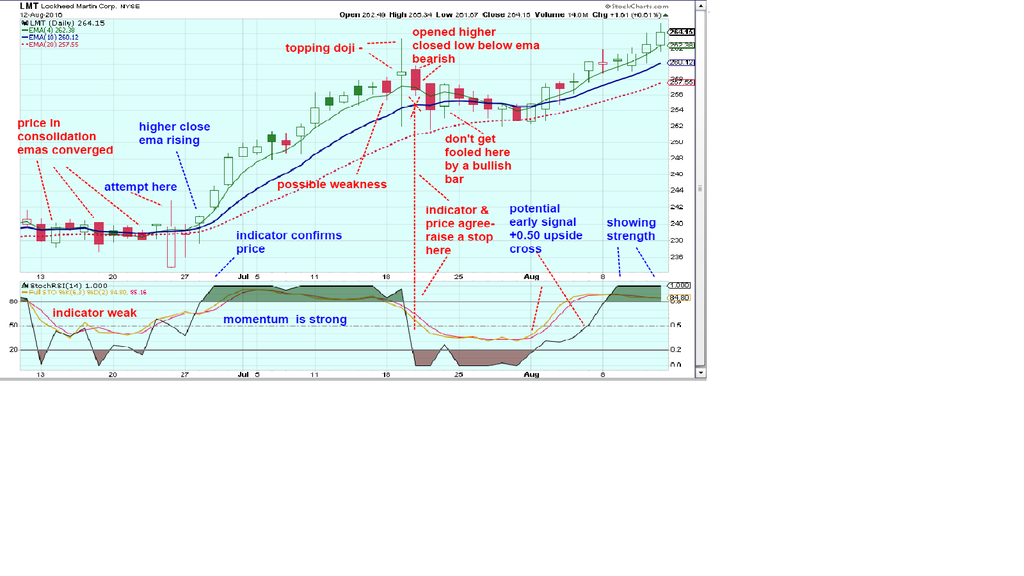
I was filled on LMT- IRA's horse-
 |
|


