|
|
Post by blygh on Jul 15, 2013 16:24:08 GMT -5
One of the market's old saws is "When the small caps peak, the bull market is over." I am just remembering July 2007 - I said to myself - " I should put everything in bonds. Things are going too well and just the return of Treasuries would provide me with a comfortable existence - but I was worried about inflation and rode my portfolio down 20%. I'm getting that feeling again. Putting in tight stops and buying index puts.
Blygh
|
|
|
|
Post by sd on Jul 15, 2013 19:55:36 GMT -5
The market's 'old saws' are indeed based on the market's repitition- and there is likely a lot of validity......That- after all, is one of the premises of employing Technical Analysis- Similar events can often have similar results .
We- perhaps all on this board- remember 2007-2008 all too clearly.
There is a fear built in to the market participants of that time, that history will indeed repeat itself- and I am certainly a product of that time, as well as the bursting of the tech bubble at the start of the decade.
The fact that you rode your portfolio down only 20% back then suggests that you indeed had a very Risk adjusted portfolio-
I appreciate your "feelings' that this time is very similar-
This market recovery does appear to be based on the Fed manipulation of 'easing' the markets and not on the fundamentals of economic growth/ true job growth-
Indeed, I am finishing "Aftershock" which suggests that we are on the verge of a market/financial meltdown - that will become catastrohic in the next few years.
It is an interesting world we live in today- Gov'ts are able to manipulate their debt/currency vaLUES, and determine ways to increase or decrease their currency, and manipulate an unsustainable debt to productivity ratio- It certainly seems a game of musical chairs, that will leave more than one player standing-or so we want to believe.
Puts should be relatively inexpensive insurance-and likely a prudent expense to sleep well at nights-
The notion of "tight stops" seems to be appropriate-
but if we put what has actually occurred, a relatively minor 5% or so market pullback after an exceptional run higher in 2013, and the markets now breaking out to new highs-into the proper context, it suggests that we may be smart to be cautious, but that if that caution is keeping us out of the markets, we are missing a period of strong market momentum trending to the upside- Again, in this period of market history- "Don't fight the Fed" has been the correct trade to embrace the market momentum....
|
|
|
|
Post by sd on Jul 16, 2013 8:35:36 GMT -5
added a position in CURE this am-
BIB has been my best performer the past week+
|
|
|
|
Post by blygh on Jul 19, 2013 13:51:45 GMT -5
That move borders on the brilliant and/or clairvoyant - let us know if you get similar insight - I am happy with my basket of HUM UNH WLP HNT HLS - my Obamacare bets
Blygh
|
|
|
|
Post by sd on Jul 20, 2013 11:01:32 GMT -5
LOL! Clairvoyant would have been to enter weeks earlier-As you likely did with your healthcare basket- While I have a position in RXL- I had been hesitant to enter into CURE- however, the sector is very strong- as your positions are indeed proof of. They are doing very well indeed! The issue with all of the leveraged ETF's is the possible considerable volatility- Attached is a 2 year chart of CURE- It has greater volatility than BIB- but both have been trending very similarly. In the most recent trend period since Jan, the trend momentum has been increasing, and the pullback was relatively small- It feels as though this market is indeed still the place to be after that minor market correction....So, as long as the momentum lasts, I plan to try to hang in there- As far as the chart goes, there have been 3 trending periods, broken with relatively benign- pullbacks- But sizeable % wise. I will be comparing several stop-loss approaches- and adjusting my stops accordingly. Thanks for posting- 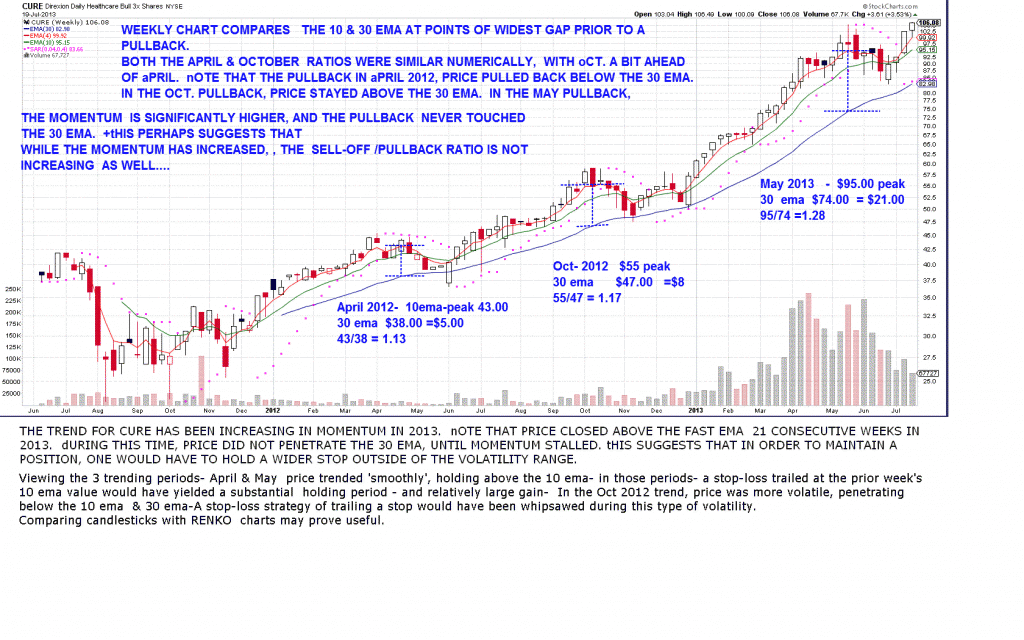 |
|
|
|
Post by sd on Jul 20, 2013 20:59:12 GMT -5
Trading for most of us is a mix of discretionary flavors of the day, and perhaps our personal bias thrown in for good measure.
And, we may have a system that we apply.....
In an effort to look at the signals contained within the chart itself, I started looking at CURE- a leveraged and sometimes volatile etf trying to discern what has historically been the result if one tried to apply a specific systematic approach with some basic rules of engagement.
I started with a look at a candlestick weekly price chart, and tossed in a few trend lines and support & resistance levels- I think this type of chart analysis lends itself best to the astute trader that has the sense to apply discretionary trade approaches to take profits at market high points, and to lessen exposure at times of market volatility.
I then looked at comparing trading signals by applying both a 10 ema as the signal focal point, and then a 5 ema as the same focal point-
As might be expected, the 5 ema generated more trade signals, but also significantly improved the net results compared to using the 10 ema.
While applying moving averages and interpreting price action around those moving averages can certainly increase a trader's awareness of where the momentum is going, ; and I tend to support their use as a graphic reference line on the chart-;
I have also felt that the key to maintaining a better view of the averaged price action of any instrument would be through the use of RENKO charts, which do not respond to the daily moves unless they push the envelope to a higher or lower level, activating the generation of a new price box.
What is 'sweet' about looking at renko charts, is that it simply stands still if price is in a sideways range- as long as it does not violate or meet the numerical price change of that time frame.
As I was bringing up charts of CURE, I was surprised to see that the renko charts showed a straight uptrend in CURE back to 2012 on the weekly charts- What I have found is that the charts i was ready to post do not reflect what actually was occurring at the time- The stockcharts program takes today's present weekly price and average volatility and then applies it back in time- For CURE- today's present weekly volatility is $7.20 with CURE over $100 today- When I go back in time and plot the charts in 2011-early 2012, the average RENKO range is $2.90 - $3.40 .
In order to 'see' if RENKO charts actually have any long term
ability to achieve excess gains over another system, I will have to generate the initial price chart at the low point date, and then bring that date forward month by month noting that the renko weekly values indeed change- the larger question is- could i have applied a renko stop-loss system on the weekly chart s back then that would still be valid today- I expect that would not be the case- The actual system would have renko sell bars occurring on the weekly chart- is my estimation- by applying todays values, I am doubling what would have been the normal value ranges of the past era.
All of this is perhaps a grand exercise on my part- but it is a desire to adopt a more systematic approach - and understanding price volatility ranges- which the Renko chart provides- may offer a base for longer term positions.
In doing a basic chart signal analysis- price action around a 10 ema weekly underperformed using the price action of the 5 weekly ema. The faster time frame generated better entry and exit points with reduced losses, despite including an additional extra trade entry/exit.
What may be different here, is that I did not try to apply a fixed stop-loss to any position-
Essentially, I ran the trade as having an initial stop-loss at entry , and only moved the stop-loss when the price action showed signs of breaking down lower below the fast ema.
The advantage of using this approach, is that it stayed outside sometimes large price swings intra week that did not materialize in actual price closes.
However, one may want to consider that any fixed stop- could be hit and executed by a 15 minute market flash crash as occurred in May -11
Both the 5 & the 10 ema charts allow the trend to continue without raising stops until there is a closing bar below the ema.
intraday spikes do not matter- A weekly bar that closes below the fast ema is a signal that the momentum may be ready to go into decline, and the stop-loss should be raised to just below (1%) the low spike range of that bar.
The end result in CURE suggests that more profits will be generated, and losses will be lower on a retracement if one uses the 5 ema vs the 10. More trades are generated- but the results are worth the cost of the commissions incurred.
I think that the likely end results using the Renko daily vs the Renko weekly will also prove beneficial to applying the faster time frame charts- The faster entry and exits net greater gains and lower the downside risk during periods of sell-offs.
Will try to get some charts up supporting this thesis-
|
|
|
|
Post by sd on Jul 21, 2013 19:04:54 GMT -5
I did not get the opportunity to go as far with different charts as I had intended. A price action only chart to start, followed by charts with the addition of moving averages ...... As noted in the previous post, using the 5 ema improved the net results considerably over the 10 ema - A longer term holding period is certainly desireable- Can one stand the large drawdowns that come with a Buy and Hold approach? However, one never knows when the trend will finally roll over and enter into a substantial decline-Thus, having a plan in place to exit on weakness and to reenter on the resumption of the trend seems to reduce potential losses- Until recently, I had not considered weekly charts as my primary charts- Bankedout's approach with the weekly charts illustrates the advantage of not getting whipsawed out on short term price action. The charts below illustrate some different ways of viewing price action with a weekly chart. Besides my short term trading account, I actually went ahead this week and made 5 initial purchases for my longer term-as well as 5 trades for my wife's account- in a separate account with TD Ameritrade using commission free ETF's- I think the 5 ema approach is a good starting point- There are no stops in place- due to getting an intraday whipsaw price action that hits the stop on a low spike- however, a sell signal will be reacted to This post should likely be contained in the other Swift thread 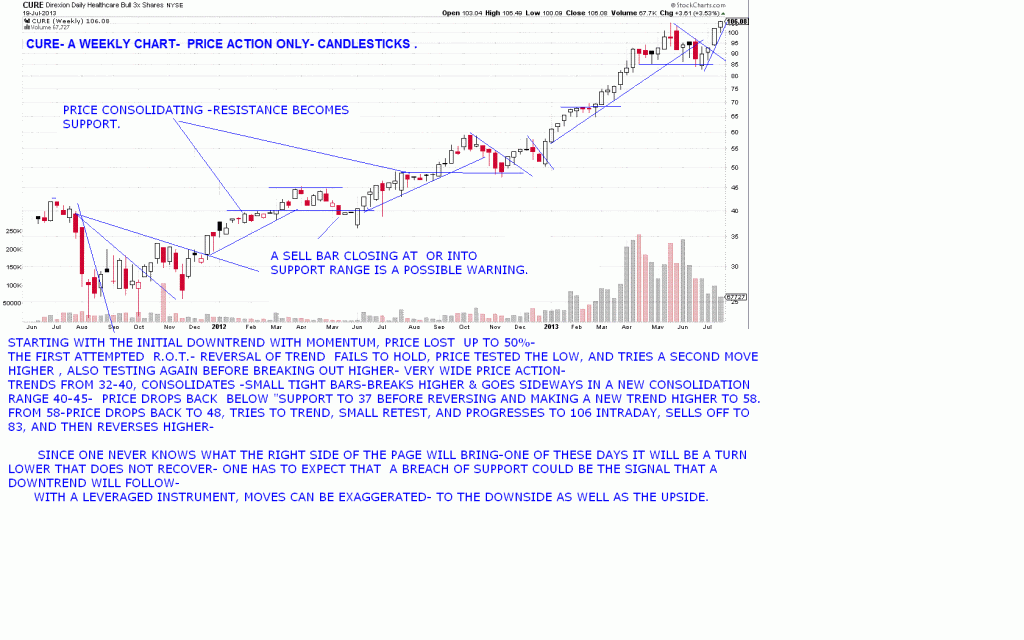 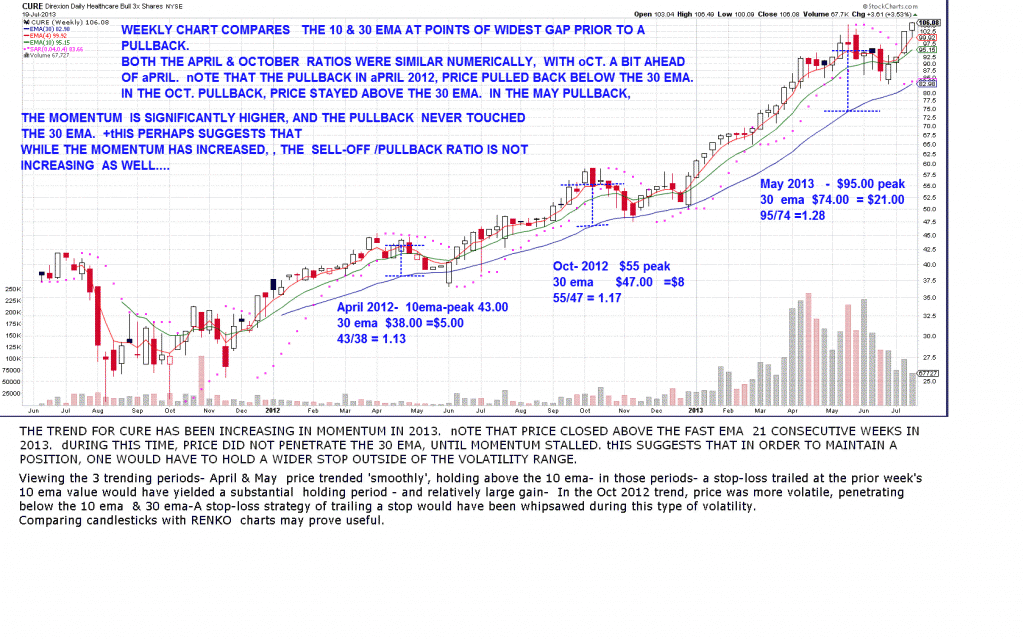 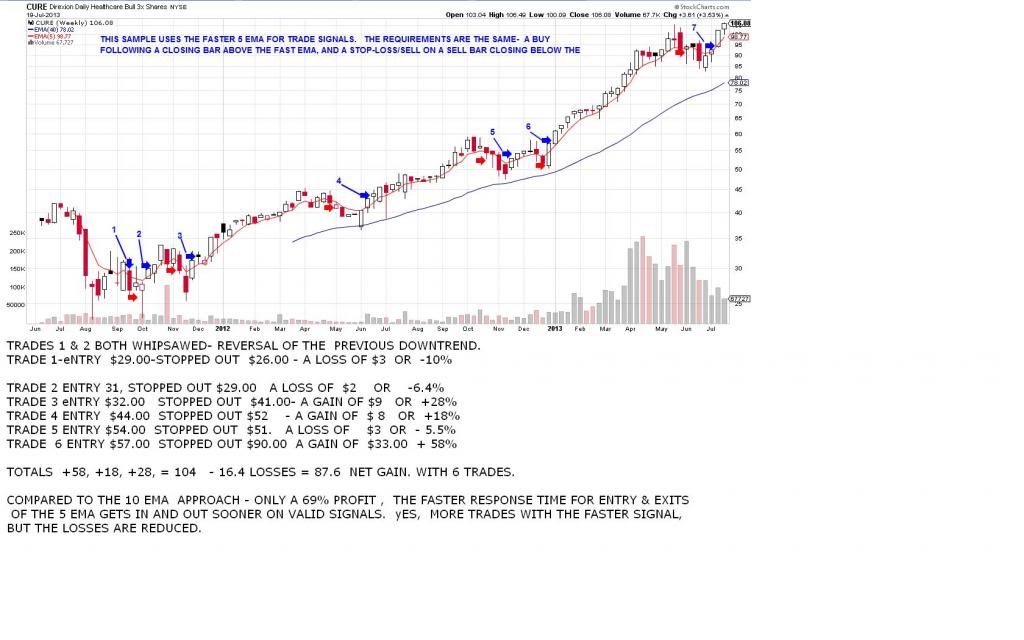 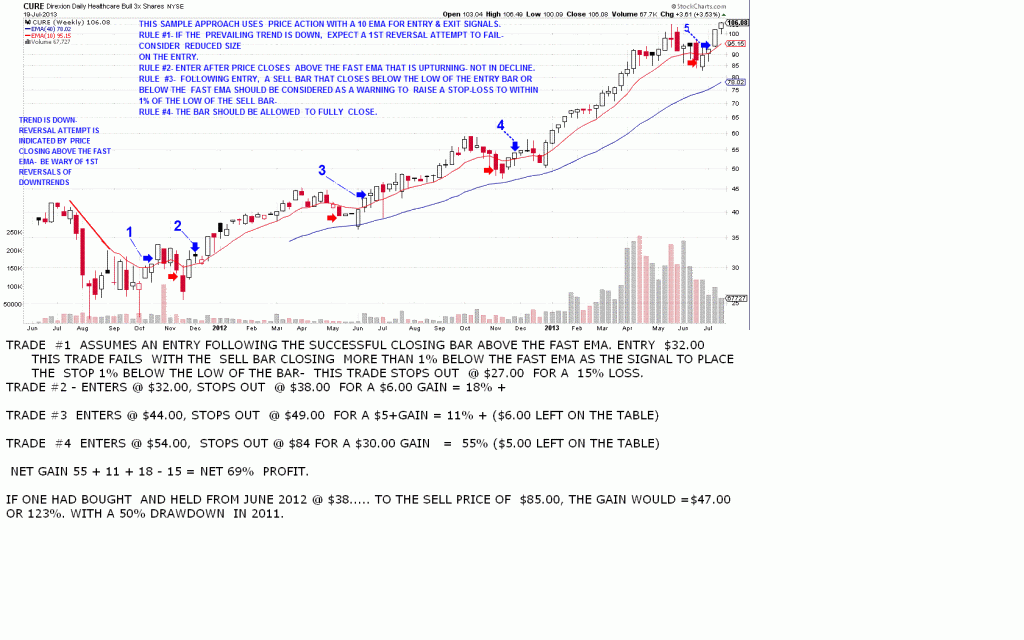 |
|
|
|
Post by sd on Jul 22, 2013 20:41:31 GMT -5
Added a bit to the TNA & Fas position-as price moved higher and hit the buy-stop- effectively increases my average price of ownership-
Stops were tweaked up today using the 2 hr Renko -
Acct value $9574- If the market will continue to deliver an unexpected summer rally a bit more, I will be pleased-
All stops are in net profitable territory- except CURE is only just now at B.E. I was tempted to keep the initial stop-loss based on the 60 min chart, but decided to try to consistantly apply the 2 hr Renko to this group of trades.
|
|
|
|
Post by bankedout on Jul 23, 2013 10:46:46 GMT -5
When deciding whether to use the 5 ema or 10 ema, or whatever, besides looking at which would have historically offered superior results, also think about which would make you feel the most comfortable.
Meaning, if you like to be out quickly on any weakness, find a method that will allow that.
If you prefer to ride out weakness in hopes of a larger gain, find a method that will allow that.
How do you know which method you lean towards? Think about when you would go in to manual override and stray from the system. Where would you say my 'discretion' is telling me to get out here, or my 'discretion' is telling me to get in here. If you find a method that closely matches what your discretion or intuition is telling you, I think you will be much more likely to follow that method and feel comfortable in doing so.
When thinking about draw downs on longer time period charts such as the weekly, consider using a tighter stop on entry than what your 'system' dictates. Figure out what percent loss you are willing to lose on that trade if you are wrong. Find a spot to enter that you think the time is right. Make your line in the sand, and stick to it. If you are right, the market will move in your direction.
Keep your losses small, and let your winners ride.
Please keep sharing your thoughts and ideas. Best of luck to you!
|
|
|
|
Post by sd on Jul 23, 2013 20:16:32 GMT -5
You are making some excellent points- and good advice as well.
I've actually debated with myself about the merits of trading vs investing-- and what has prompted my recent postings is also the desire to "find' a method i can be comfortable with for the longer term that i use in my IRA-
I also wanted to try to post something using different methods of chart analysis that might be of interest to others- CURE seemed to give a good example (perhaps exaggerated) for illustration.
I was indeed perhaps emboldened by your method of viewing the weekly charts and then applying your trading method to them- This has been a gradual transition in what had been my shorter term trading over the past year to gain longer holding periods.
When deciding whether to use the 5 ema or 10 ema, or whatever, besides looking at which would have historically offered superior results, also think about which would make you feel the most comfortable.
Meaning, if you like to be out quickly on any weakness, find a method that will allow that.
for me, I think I prefer a method that reduces losses quicker-or even consider the option of taking partial profits with a portion, perhaps allowing a wider range for the remainder.
If you prefer to ride out weakness in hopes of a larger gain, find a method that will allow that.
How do you know which method you lean towards? Think about when you would go in to manual override and stray from the system. Where would you say my 'discretion' is telling me to get out here, or my 'discretion' is telling me to get in here. If you find a method that closely matches what your discretion or intuition is telling you, I think you will be much more likely to follow that method and feel comfortable in doing so.
I have found that I am prone to be WRONG- often -as to what the market will likely do- If I rely on my intuition- it is likely to be detrimental- I went against my intuition by going long in this recent rally- and am only comfortable with it because - While I feel everything is well over-extended- the momentum is still to the upside-Hear the music -still? By applying a relatively narrow stop-loss, and with most trades well into profitible territory, I can allow these trades to continue until stopped out-
When thinking about draw downs on longer time period charts such as the weekly, consider using a tighter stop on entry than what your 'system' dictates. Figure out what percent loss you are willing to lose on that trade if you are wrong. Find a spot to enter that you think the time is right. Make your line in the sand, and stick to it. If you are right, the market will move in your direction
An excellent point- To jump in all at once with a full position- is assuming that this moment is the right moment- To step up as the trade progresses in your favor indeed allows the Risk to be reduced- I think this is prudent trading- particularly if one wants to cultivate a longer term position.
Keep your losses small, and let your winners ride.
ALWAYS good advice-
Please keep sharing your thoughts and ideas. Best of luck to you!
My final idea to mention, Which I need to illustrate better- at another future time- is that I believe the RENKO charts indeed offer a very different way to get a perspective on what is occurring, That can help balance a perspective.
I have been managing my present series of trades with 2 chart styles- A candlestick chart and a Renko chart- By viewing both charts, I get a sense of short term price action with the candlesticks, and with the RENKO, I get a progressively raised stop-loss.
Renko boxes are based on the 'average' volatility of price action- at the present period of time.- renko boxes are either a buy- or a red sell- In my present trades, I am using a relatively narrow 2 hr Renko chart with a stop -loss using the 8 period Renko ema- I am also using a 60 minute candlestick chart as a counter reference-
The criteria of trailing price action with a fairly tight stop-loss , also requires that one is willing to jump back in and reenter the trade long if the signal is generated- and the uptrend is intact.
What is convenient about applying RENKO charts, is that if price halts the uptrend and goes into a sideways consolidation,
The Renko charts also stop- until the time that price exceeds the previous bar size to the up or the downside- In a sideways range, The Renko chart can sit still for weeks- possibly months- on daily charts-
As a final note- If anyone is interested in viewing Renko charts,
I would suggest that they also view the Renko chart at a next quicker time frame than the traditional period chart that they normally use.
Toss in a couple of moving averages, you have to allow for the Swing range of a full box size- Therefore, one cannot look at a chart and simply say I will place a stop-loss directly below the present box, They will get whipsawed- Renko charts generate a new box only once price exceeds the present box by a full box value-
If a Renko box in the time period one is viewing is $1.
and the high value of the present box is $99.00, a new buy box will be made when price exceeds $100.00
Conversely, a red sell box will only be generated if price breaks below the low of the present box range -98-99 by the value of the box $1. Meaning, a sell box shows up when price is below the $98.00 value.
If anyone is interested, there are a few videos on Youtube- Type in Renko.
By going to a faster time frame, I am essentially narrowing the stop-loss range- which also means that price can whipsaw me and reverse and then promptly go higher- typical occurance if one views a faster time frame chart
As I view some of the prior charts, a one or two sell box is common and stays above the ema, price continues to trend higher.... When price rolls over though, multiple red boxes often occur- and the RULE is to not buy during a Red bar on the fast time frame- Just wait it out- see the uptrend resume with a buy-stop 1 box above the red bar.
Since my "intuition" tells me that this market rally should not last- but it has- applying a stop-loss with the Renko charts allows me to periodically update the stop-loss and to stay outside of what is a normal volatility price move.
The bigger question- is that suppose the uptrend does continue for months more- If I had bowed out and applied the next slower time frame to my charts, would i have continued to hold into a longer term large winning trade with a slower time frame chart, or is the shorter term faster chart just my fear of loss ultimately reducing my potential gain-?
If this was October 2007- I'd be getting an Attaboy!
If it was March 2009- I'd be getting whipsawed and sitting on the sidelines.
Present trades-I will apply the short term approach .
In my IRA account, no stops are in place-
Thanks for posting ! SD
|
|
|
|
Post by sd on Jul 24, 2013 20:48:54 GMT -5
sold 28 tna $58.00; 25 fas $74.49-
initial entries were at $53.64 ; 65.82 had just added to both positions so the net inital gains are lower from the entry- no time to calculate this pm-
Had just added to TNA $ 59.11, FAS $76.66 so that reduced the net profitibility .
Bib actually closed higher, Cure down less than .55 - may be some potential upside there.
Lost several hundred -in value $9319.00 acct value.
|
|
|
|
Post by sd on Jul 25, 2013 20:04:13 GMT -5
Both CURE and Bib hit my stops, and I believe both closed higher-
In viewing my RENKO charts, I found that my present RENKO boxes did not perform as I expected- Price exceeded several box values , hit my lower stop-loss, and then - of course- closed higher-
I found that in the chart attributes field box, one can have several selections- A box can be selected to only occur if the close exceeds the value- or one can select Field- to reflect intraday price action as it occurs. This is a fundamentally important distinction- and will cause me to review the FIELD selection as the most appropriate to reflect actual price action-
No wonder the darned charts looked so clean and simple!
CURE- Sold at 104.96 BIB sold @ 109.20.
Only remaining position is RXL- waiting for cash to clear.
|
|
|
|
Post by bankedout on Jul 26, 2013 10:02:46 GMT -5
That is frustrating! Similar things have happened to me at times. We always pay our tuition with trading.....
|
|
|
|
Post by blygh on Jul 26, 2013 18:52:48 GMT -5
Agreed - tight stops seem to hit - sell me out and then the stock rebounds to finish higher - it is almost as if they know where they can pick up stocks cheap by driving the price down for a few minutes - and I think they do know.
Blygh
|
|
|
|
Post by sd on Jul 27, 2013 8:14:23 GMT -5
Yes, frustrating - In several aspects-
I tightened the stops in all positions and was stopped out on all levereged positions- TNA,FAS,BIB,CURE over 2 days of a market pullback-Still holding rxl.
A simple glance at the 60 minute Chart - I should have given the trade a bit more room, and kept the stop just under the 103 level- That would have made a very tight stop-where priced had moved up from on my entry.
My application of the renko chart needs review- I indeed like the simplicity of viewing price through volatility that RENKO offers, but it needs more work.
Final note this am- The only advantage of faster time frame charts is the potential for early entry and early exit on perceived trend change- hower, the faster the time frame, the more numerous the signals will be.
My reluctance to adopt a slower time frame chart at this point, is my own psychology - about the market perhaps being more vulnerable now to a pullback- $vix- is at a low and starting to show some upswing- and the desire to retain a majority of my recent gains.
Getting stopped out in FAS, TNA, at the level I did may have been a good thing ($74.49; $58.00) as price did not immediately rebound higher as did BIB,CURE.
We'll see what things look like-next week - May look to split the stops with a portion wider- as long as it is above the entry.
Thanks for the comments!-
|
|