|
|
Post by sd on Jan 4, 2013 19:27:39 GMT -5
Dec 31 -2012 account value- $8751.00 What happened?
This year, I obviously need to make changes in my market approach , in an effort to outperform the market and to hang onto profits- I underperformed the mkt by a considerable amount this year.
I did not "Get 'er Done" in 2012 - as my prior thread anticipated. I am disappointed in my poor performance, and it serves as a wake-up call that I need to be capable of making changes in my strategy.
I plan to have a longer term diversified strategy in the "Swiftly" thread- dealing with longer term trends.
Within this thread there will likely be some overlap of the other- but I'd like this thread to focus on how I deal with the "active" trading account- .
The difference between the 2 accounts is the one continues to grow larger, while the active account churns the waters.
As always, Anyone is invited to comment, critical or otherwise-
SD
|
|
|
|
Post by sd on Jan 4, 2013 20:43:21 GMT -5
The memory of where we were on this date will soon fade - The issue de jour was the "fiscal cliff' and the inability of the House and the Senate to reach a timely accord so taxes would not be massively increased on all . "Fear" was the watchword- as the House struggled and eventually passed a resolution said to "comprimise" on tax levels. The Senate failed to embrace the House's bill and there was great discourse and photo opportunities - And finally the senate reluctantly agreed and the President signed the accord - preventing hell fire and brimstone from falling on the populous. And , the sun arose and the markets saw it was good and then rose to the occaision. The coffers were filled and it was good. The sounds of Jubilee resounded across the land, and it was Good. BUT sayeth the soothsayer- What of the Cloud of the Great Debt upon the Horizon? Those nagging words were barely spoken, but were loud enough to be heard on the 'morrow' Forgive the alliteration - if that is what it is- The point is that we are all held to the news of the day- and it seems that the news indeed focus's on that which can turmoil the market- To the extent that we trade based on our 'Bias' to what the markets "should" be doing, We show our personal pride and arrogance. When we trade against the market trend- our presumptuous self is exposed. This would be our "Hubris' the fatal flaw- the Achilles heel . Perhaps Paulson- Hugely long Gold- would be willing to be an example of standing by your Bias. The situation rattled me enough that I had gone to cash in my trading account as well as my retirement account-- I expected that a fall off the Fiscal Cliff would give a 5-10% drop at a minimum. During this period, the charts held within a consolidation range. there was not a huge sell-off - just a wait and see consolidation . I electd to go long FAS as the news improved. This is a leveraged Financial ETF 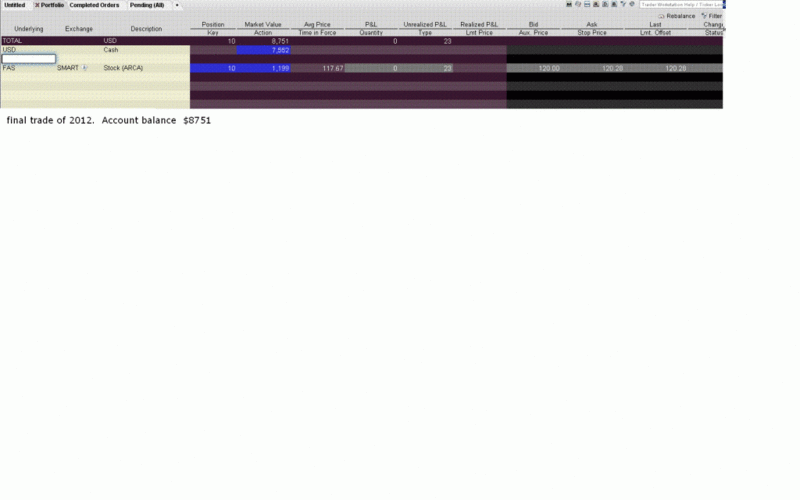 |
|
|
|
Post by sd on Jan 5, 2013 15:27:11 GMT -5
Short term Swing TRADING Can be difficult enough, but when the stock or ETF you are trading moves with the news, you are trying to not only trade the chart action as you see it, but you are making a judgement call on how the market participants will react in the days ahead. Not only are you assuming you can foretell the psychology of the crowd, but also the probability that such and such an event will occur as you expect. I took a breakout trade in FAS in Dec that was promptly smacked down by the market- Price had broken above a resistance level and I jumped in, and had to sell a few days later- As price weakened and pulled back, It provided an opportunity to take a reentry with a small Risk to a stop-loss. I took that entry, The market news looked dicey, and at the 11th hour, the Fiscal Cliff was postponed- The price gapped higher, and I chose to add an additional 1/2 to the trade, believing the good news would keep the market up- I was prepared to Sell on the pm "news", but the futures were up and the Asian mkts were in gains- So , I removed the market sell. FAS rallied higher. The question now becomes what will the markets do, when will the news take the bloom off the rose, and "profit taking" will be the rationale for a market correction. Sharp Momentum moves always run out of steam and revert to the mean- The daily chart gives a good picture of the recent gap higher momentum compared to the prior days of paralleling the daily ema-- Notice the prior Sept momentum move saw a significant pullback and change of trend as the move was exhausted. It is nice to start the New Year off in the right direction. 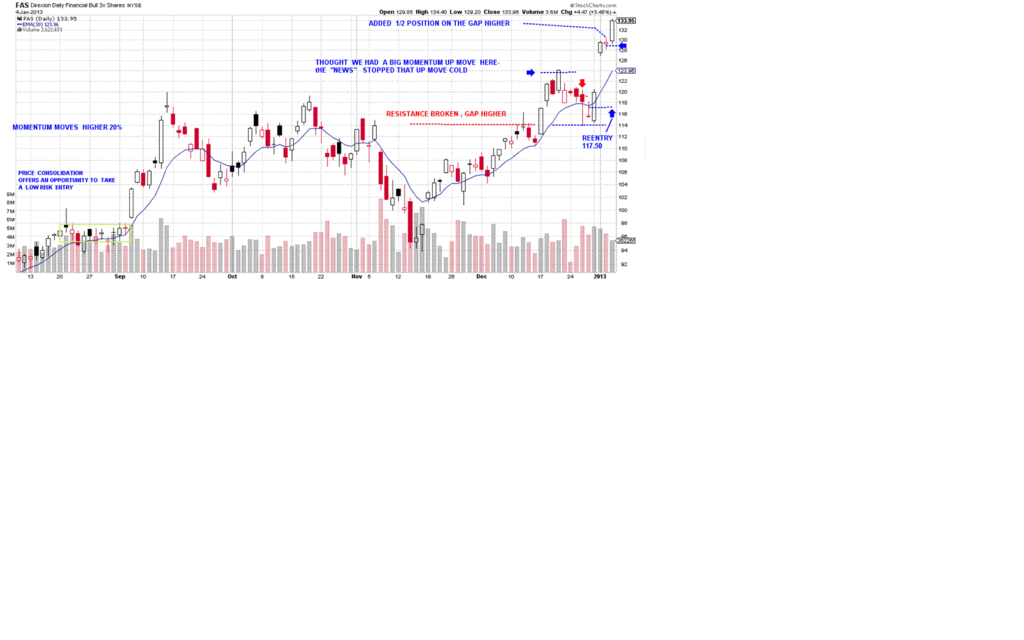 Several items can be seen in the price action when viewed through the hourly chart- or faster charts, that are not easily discernible when one only uses the daily charts. In the first trade, Price had increased it's velocity as seen by the sharper upwards angle within the channel. Price exceeded the top of the channel trend line, had a sideways consolidation, and I entered on a move above that consolidation. The evening " News" of a lack of FC agreement killed that trade. I realized I would have a losing trade the next am, but was able to watch the trade develop in real time- Had I simply kept a fixed stop- I would have been taken out at the open on the low of the gap down. Normally, I would not have the opportunity to view trades in real time-intraday- I sold for a loss on that trade. Price broke lower and exceeded the bottom of the price channel- I had the opportunity to have the annotated chart in front of me intraday- The price pullback to the 114 or so formed a dbl bottom and then price rallied higher on Optimism. I took the entry. Bankedout has illustrated a very well defined entry & stop-loss on his charts for his trades- He also takes the perspective of understanding where Price is relative to the time frame, and the larger time frames- This has been very instructional. This is an excellent method to gain that lower Risk entry - But at some point, short term trading is indeed short term- The price fluctuations that would be "normal" will take one out of a trade unless one indeed steps back and views the bigger picture- I think Bankedout used the example of "handing off" the trade -once successful - to a larger time frame- ideally developing the opportunity for greater gains with a longer holding period. - I would subscribe to that approach- The difficulty is that one becomes exposed to greater price swings on the larger time frame trade- Right now, the recent hourly price action seems extended, and so I want to maximise the potential gain on a good portion of the position- Here's the Hourly chart 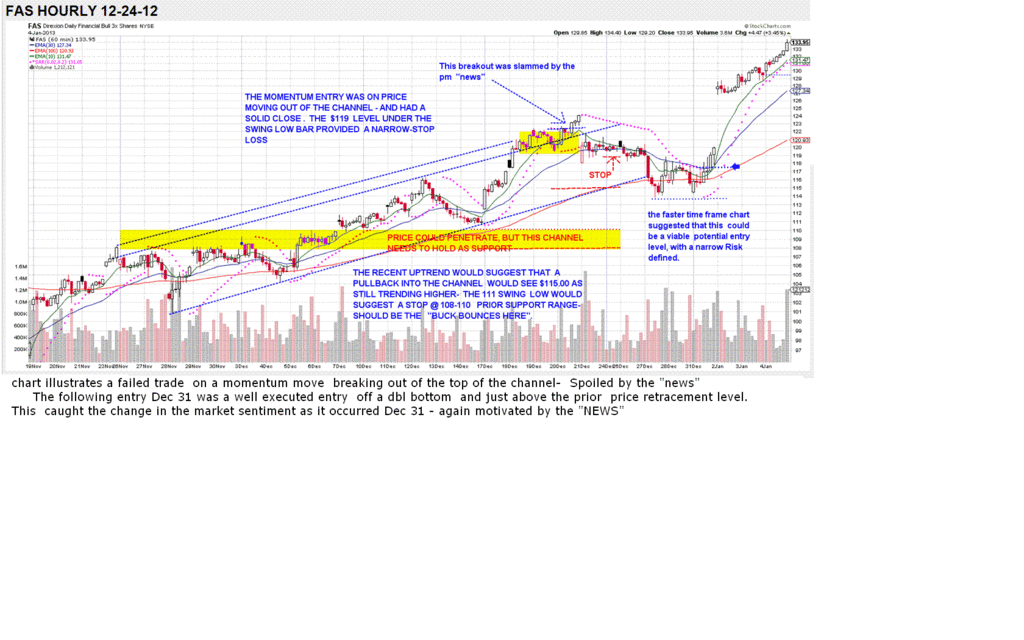 |
|
|
|
Post by bankedout on Jan 6, 2013 9:08:25 GMT -5
If you did end up 'handing off' to a longer time frame, you would want to consider changing vehicles as well. Meaning, you may want to switch to an unleveraged ETF if you plan to hold longer than "X" amount of time. Whatever you determine that to be.
|
|
|
|
Post by sd on Jan 6, 2013 11:58:48 GMT -5
Yes, one would need to compare the performance- and the volatility swings- Since we know that many levereged ETFs do not accurately follow the underlying over time and are best for short term trading.
Note that since the low made in June, FAS has yielded a 100% return -
Looking at unleverged ETF's IYF,IYG returns were 26% & 34% so IYG -FAS over 6 mos appear to track 1:3-
Good point to compare - and consider shifting to longer term charts & unlevereged funds.
Also, the volatility swings of the unlevered funds would be more sustainable to sit through in a longer term trade.
|
|
|
|
Post by sd on Jan 6, 2013 12:59:32 GMT -5
At the present time I am "lucky" in that i am long on this trade coming off a retracement I took a loss on. I took a reentry on improving price action on an hourly chart-Had I not entered on the early chart indication, I would have missed the larger move. The question becomes- What happens next? We should stay with a trend - until it ends..... In viewing price action and momentum moves, one has to consider what the "normal" volatility may be- This most recent move is an above normal momentum higher- and so the question becomes- what should one expect, and how does one maximise the short term trade- We don't know when a trending move will stop, but a look at the recent chart shows that excess momentum moves ALWAYS revert back towards the mean-In the recent prior 2 occaisions where price exceeded the "normal" range, the pullbacks exceeded 50% of the momentum move- If this 3rd excess momentum move is similar, a pullback of a 20% move will settle in for a less than 10% gain- and then see where it goes from there- The first chart is a daily chart- with Keltner bands surrounding price-Keltner bands are based on the ATR of price movement- You can adjust the time periods etc to identify and highlight excessive moves. As price pushed above the bands- it is on "excess" momentum- momentum above the "normal" I also have a relative strength indicator - RSI-showing both when price is at "oversold" Notice the pullbacks that occur from the "overbought " levels and bring price back into the channel. I have already decided I will "lock-in" some gains by using the hourly chart to establish some stops- and perhaps profit levels. Note that I added into this trade after the gap up move 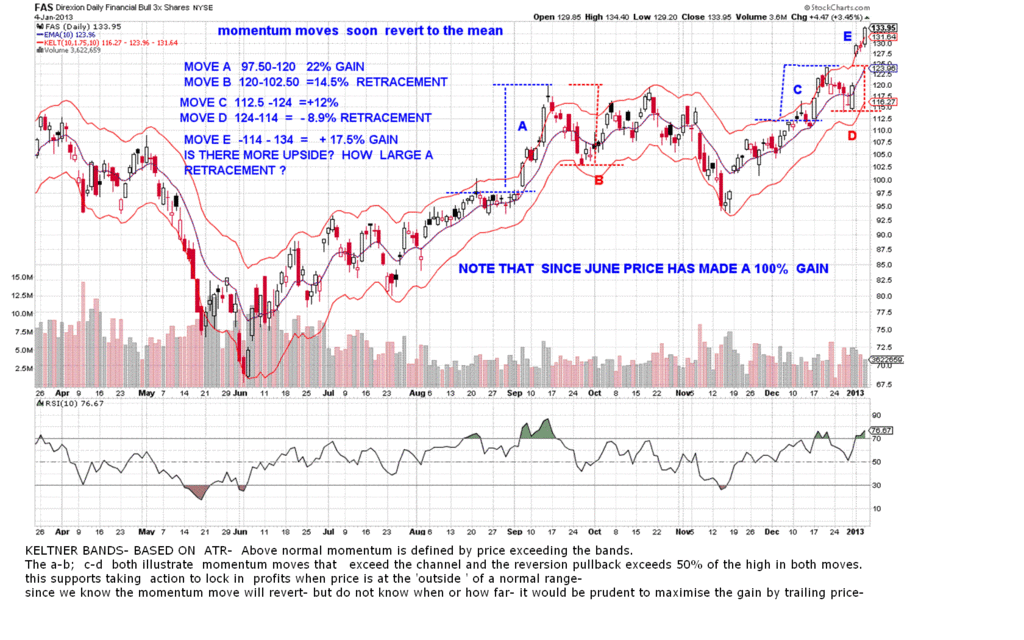 |
|
|
|
Post by sd on Jan 6, 2013 16:14:57 GMT -5
The recent price action in FAS has held above the top of the channel- On this time frame, it is technically "Overbought" - That's not to say that it cannot possibly move higher- I will split my stops- and the position - Prive has a Average True Range on a 30 min chart (14 periods) of $1.35- Therefore, I will set a trailing stop at 2x the atr. ($2.70) On the remainder of the position, I will use the daily ATR ($4.20) - If I have the opportunity to get online Monday, I will monitor the price action. I think understanding what the "normal" volatility swings are in one's time frame can be an asset in reducing whipsaws- I will start viewing the price action with the keltner channels, and the RSI indicator over the next weeks to see if it can assist in getting better entries , or withstanding some "normal " volatility. 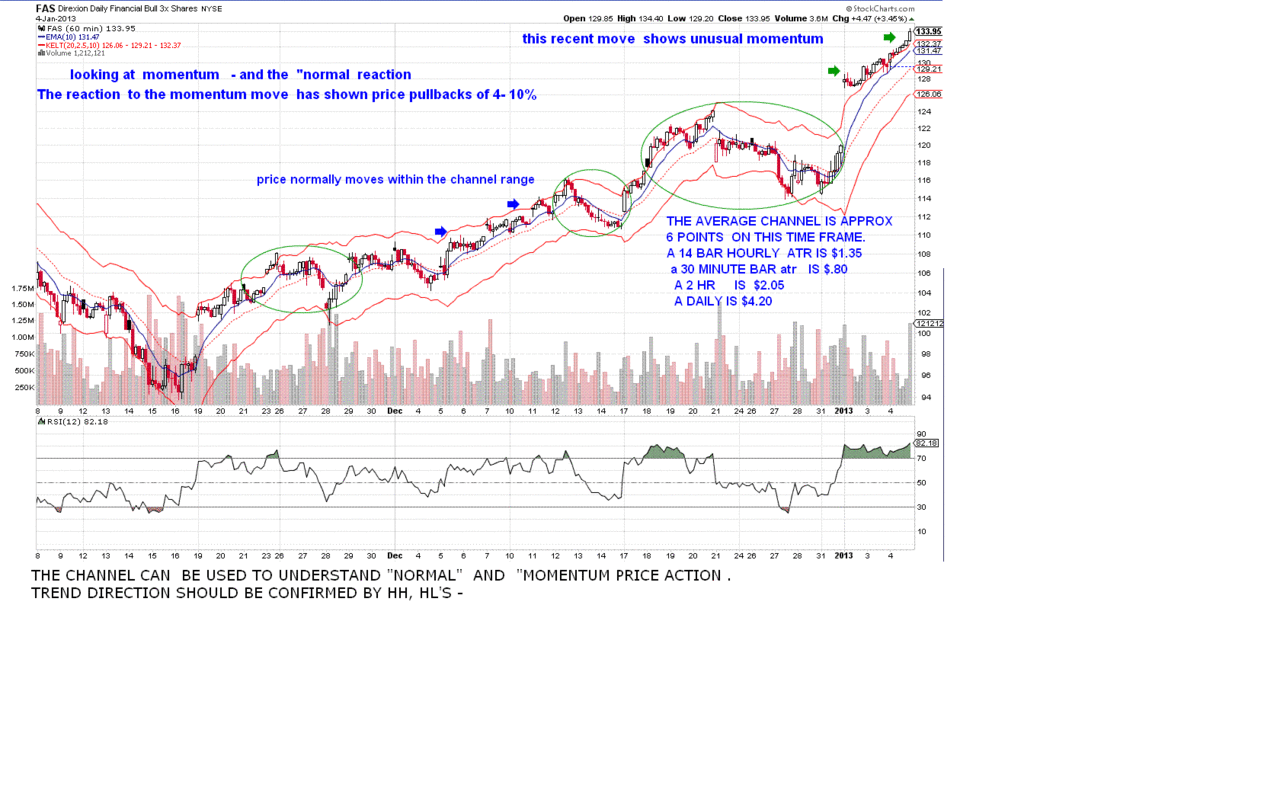 |
|
|
|
Post by sd on Jan 7, 2013 10:08:00 GMT -5
I cancelled both stops this am-I will get to monitor the trade some intraday-
|
|
|
|
Post by sd on Jan 7, 2013 13:20:47 GMT -5
FAS-I had cancelled the stops to give price a chance to settle out after the open- price was weak, and i chose to sell 2/3 (10 shares) @ $131.64. Reportedly, all market segments are weak- seeing some profit taking from last week and perhaps nervousness about waiting for earnings. I have kept 5 shares of FAS - and will let it ride as a "core" position- with a stop @ 122.00- just above my entry cost- I plan to monitor Fas and take a reentry and add back to the position- ideally after a pullback below where I sold. I am floating on the other positions without set stops- I have purchased 200 shares of TVIX- a 2x volatility - Since volatility has been trending down, and the recent market strength pushed it down further, this is just a short term trade should the market get more nervous- I think it would have made sense to buy options-instead of the trade- I need to learn how to do that...... The technical reasons are both the momentary market nervousness, TVIX is attempting to base here and has made 1 prior upside move previously- I am able to place a well defined close stop and a second wider stop that I expect I can adjust higher if needed. 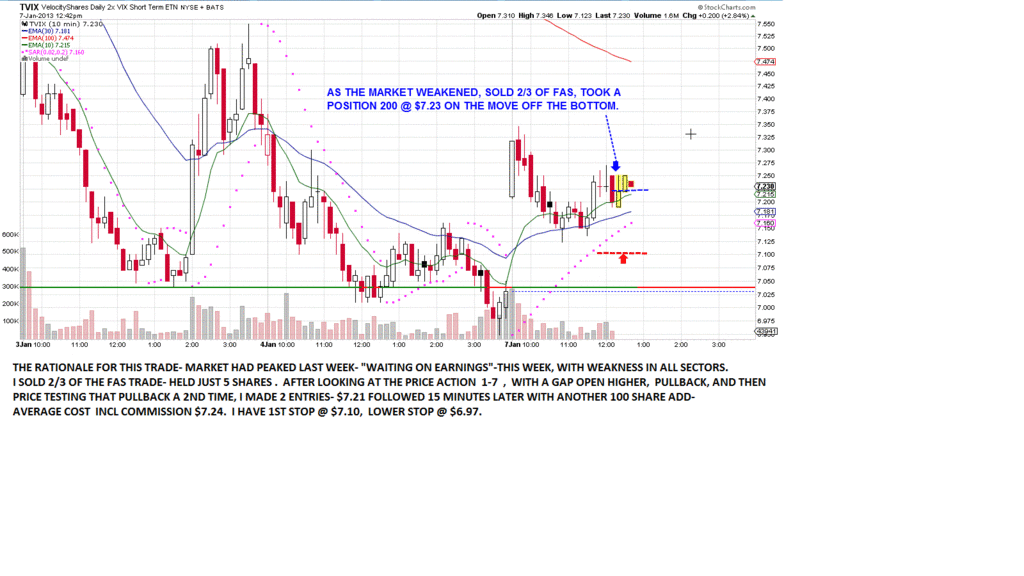 tHE END RESULT OF THE DAY- FAS did not weaken further, My sell point was at the very bottom of the pullback- The TVIX trade also lost momentum as the day closed, hitting my first stop and closed within a few cents of my lower stop-The indexes all closed lower, and so I was surprised that TVIX closed down as far as it did- I was too confident that the trend for TVIX would increase at the end of the day- I also need to be prepared for a reentry on FAS should it resume the uptrend. 1-08 Update- All indexes closed down today, but the TVIX trade hit an all time low-As did the VIX. My remaining position in TVIX stopped out- Futures are up for a higher open Wed- I think the market is resting- consolidating the relief rally, and just waiting for good earnings- |
|
|
|
Post by sd on Jan 10, 2013 10:08:58 GMT -5
I did reenter FAS and it has moved slightly higher-
Position is only 13 shares, and has now raised my average cost to $129.08 with some cash taken out on the prior sell- mkt value is $1740.
At lot will be riding on the markets interpretation of earnings as they come out and the impact on business- I think BAC was downgraded yesterday based on valuation concerns.
I will likely consider the recent pullback level off the gap @130.50
as a significant HL- Yesterday's price action- Gap open higher, but sell-off during the day- indicated weakness. Today's open, while higher, looks tenative, @ 10 am. I will raise my stop to the 129 level-
That gives it some wiggle room below the 130.50 pullback.
|
|
|
|
Post by sd on Jan 11, 2013 21:51:43 GMT -5
The FAS trade is still active. It actually moved up to 137 yesterday, and pulled back today . WFC reported better than expected earnings today premarket , and sold off- We seem very top heavy here, Vix is pushing a historically low range, and the market is complacent. Isn't this where they claim the "smart money" exits? While i'd like to hang in and see the FAS trade move up and test the prior highs. my cost basis after the partial sell & reentry is now 129.08. Stop is set at 129.00- Mixed feelings about how to handle the trade- As long as the trend is still in effect, I need to allow it to continue. Issue is, I'm not prepared to "hand it off" to a slower time frame or to allow it to become a losing trade. There is a narrow range between my cost basis and the present price- About $6.00. In rationalizing the pros and cons of trading with a short term chart, and trading with a longer term view, I looked at a monthly Line chart, with a 2 ema- And Eureka, I have found the Holy Grail of technical analysis- ! ! ! Unfortunately, the line chart fails to show the erratic price action that would have made numerous whipsaws. If trading was as simple as a straight line between highs and lows! Regardless, I am including the chart here- because as inaccurate the picture the chart represents- the 155 points between the buy and sells vs the 16 for a buy and hold would suggest there is some middle ground that could be exploited to one's advantage. The other chart is the hourly Renko with Keltner channels- bracketing the "Average True Range"- Notice that the other 'swing low' pullbacks in price action have pushed the Keltner channel lower, with price causing the RSI to drop through the mid line- These could be considered actual "Higher Lows" and should have some significance relative to the hourly chart- The other minor pullbacks within the channel should be considered as normal fluctuations. Useful if one is fast trading the very short term momentum. but cannot be counted on as a 'significant ' support level - One is interesting here, Is the price is making higher highs, but the RSI is showing a divergence with a declining RSI- This is a sign of a decline in the support of the upward momentum move, suggesting a retracement may be in the very near future- We'll see if this forecast comes as expected. Along those lines, one can see that 1 & 2 box pullbacks are the "norm" . The larger pullback represents a multi box pullback- In this 2 month period, This would tenatively suggest developing an exit on a pullback of 3 boxes, and a reentry on the first up box- followed by an immediate trailing stop of 3-4 boxes. The plus of this strategy is that one is taken out of the trade after a 4-5% price pullback from the high- fine as long as the trending periods are substantial enough . 2 months is just a snapshot in a trader's time frame, and so following this same thesis back in time to discover how this approach would have worked during the past 20 to 40 -2 month periods would perhaps yield the greater probability of the strengths and pitfalls of this approach. No time to develop this line of thinking further- Charts for the fun of it: 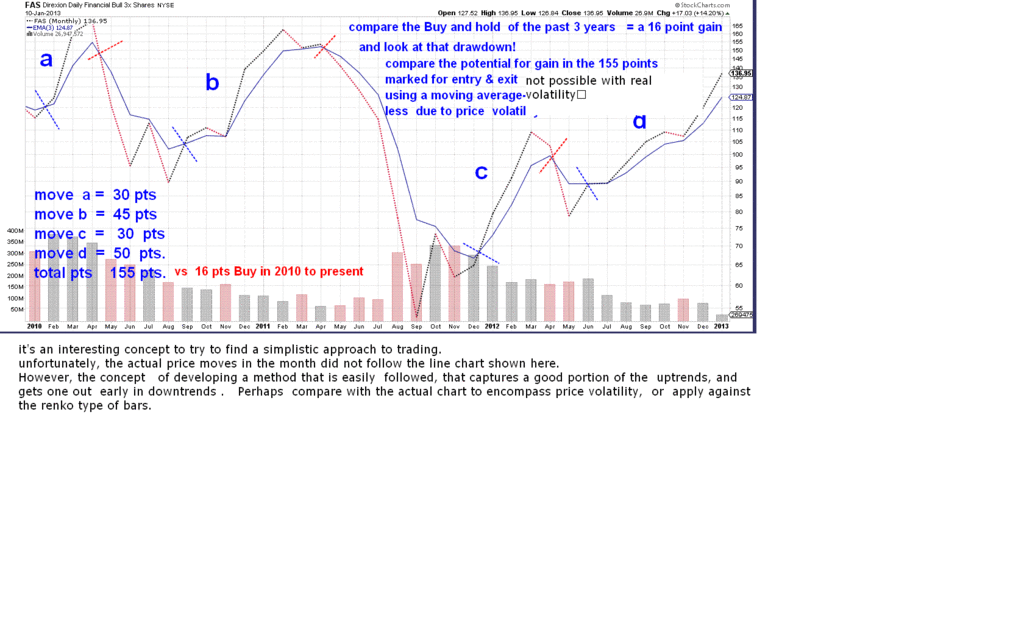 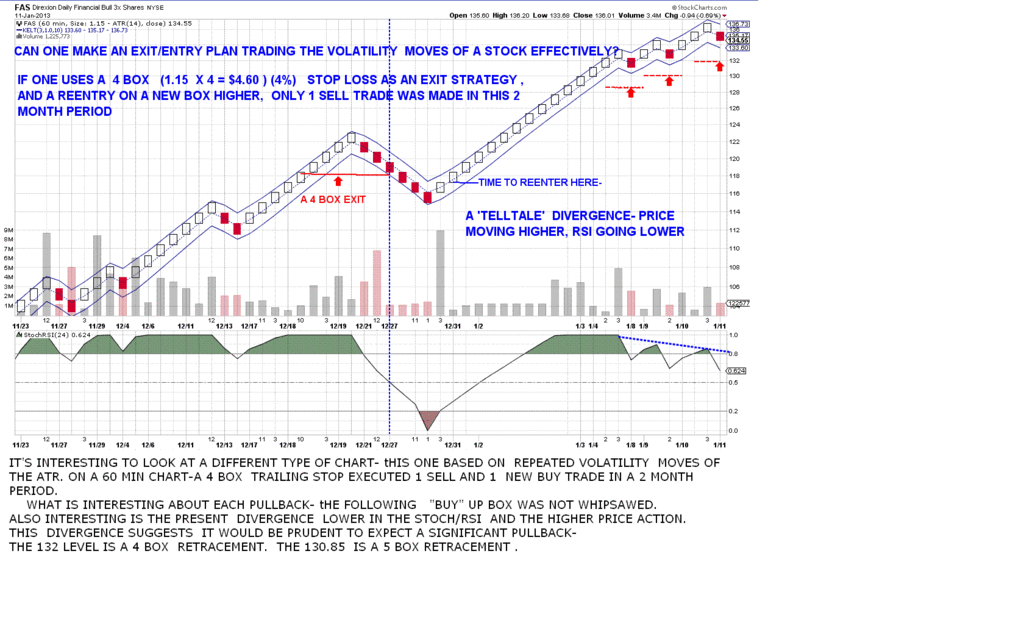 |
|
|
|
Post by bankedout on Jan 12, 2013 9:15:51 GMT -5
I once thought the line chart was the holy grail also. In the end I had to abandon it.
I guess one has to consider if you want to win the game by hitting singles consistently or dinging them out of the park.
To hit the home runs, you first have to find a product that has home run potential. Then you need to get in on one of those moves. At that point you need to believe in the move's potential and find the willingness to hang on tight. Eventually you have to realize you cannot be married to the position and start looking for an exit point. That may be actually exiting in to a strong move in your direction, not a move against you.
|
|
|
|
Post by sd on Jan 12, 2013 12:22:44 GMT -5
I once thought the line chart was the holy grail also. In the end I had to abandon it.
I guess one has to consider if you want to win the game by hitting singles consistently or dinging them out of the park.
To hit the home runs, you first have to find a product that has home run potential. Then you need to get in on one of those moves. At that point you need to believe in the move's potential and find the willingness to hang on tight. Eventually you have to realize you cannot be married to the position and start looking for an exit point. That may be actually exiting in to a strong move in your direction, not a move against you.
Yes, I understand the line chart does not cover the actual swings, but that straight line smoothing sure does make it look appealing- It is useful though , in seeing the major trend movements, without noise,or volatility- .It also suggests there should be a methodology that one can develop to repeatedly apply that includes the price volatility- the Renko bricks smooth the visual aspects of volatility- I'm going to look further into Renko brick charts .....
Finding that instrument to trade that can deliver home runs comes with a lot of RISK- However, one needs to embrace some Risk to achieve Reward- I think it makes good sense to exit in a momentum move higher if it is going 'parabolic' and the opportunity is to see a pullback /consolidation- That said, a better batting average would likely be developed with consistancy. Babe Ruth was famous for hitting so many home runs- but he struckout much more trying to get the big hits.
What I am now trying to do with the FAS trade is to discipline myself to not sell on the minor pullbacks. This is in an effort to allow the trade to potentially continue higher- Perhaps get to a point where I would not be reacting to an hourly chart, but more concerned with the daily- The "hand-off" as you termed it.
I presently have doubts that that will occur- but I need to not second guess the future -
ALSO, I think having the willingness to add to the trade- Or- taking that larger position earlier if it looks warranted -*** keeping a manageable stop-loss- all are aspects of improving one's results . Things I will try to work on .
Thanks for posting-
|
|
|
|
Post by sd on Jan 17, 2013 20:04:32 GMT -5
As FAS has been in a consolidation, but creeping higher, I tightened the stop today, 132 - with the close above 136.
The consensus is the market is 'oversold' and with the future gov't policies expected to be a battle, it would seem prudent to not add on to positions. However, one does not know when this correction will occur, so that is a case for trailing any position with a tighter stop-loss should the market get reactive.
|
|
|
|
Post by sd on Jan 17, 2013 20:08:49 GMT -5
Germany reportedly wants to take personal possession of it's Gold from The US & France reportedly- This was a "news" item on Fast money tonight.
|
|