|
|
Post by sd on Jan 25, 2013 17:33:15 GMT -5
The markets are moving higher this week. The S & P actually nailed the close above 1500! I have been "holding" all long positions- this month, FAS has been a single substantial gainer of the month % wise. XBI is finally moving higher and is now net profitible. The recent TNA trade has simply moved higher-should be close to a B.E. on the stop. My EM focused positions have not moved up with the US markets- I'm getting close to getting stopped out on the DVYE position. 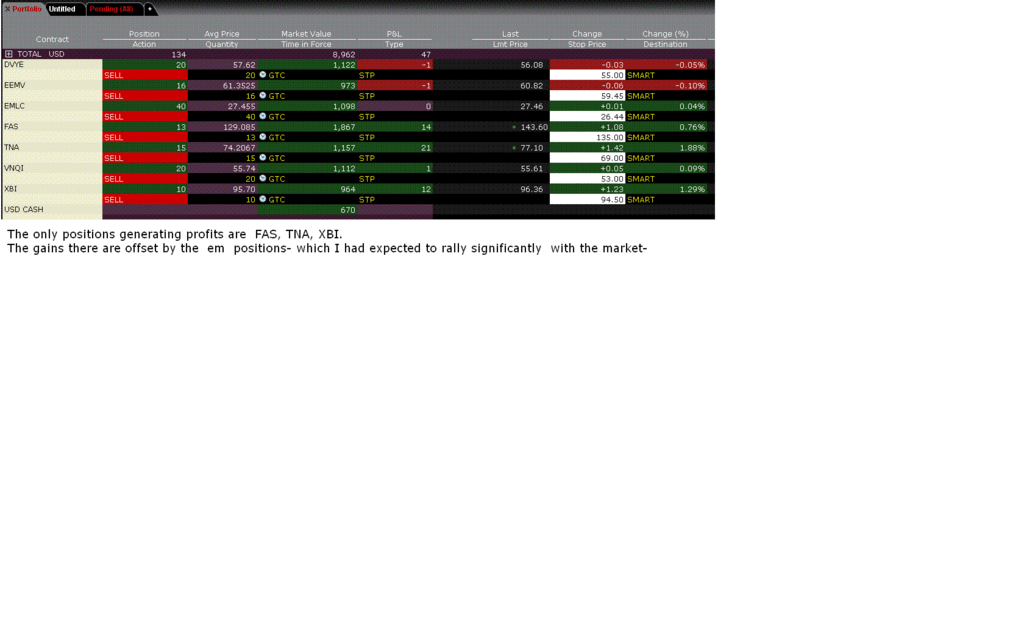 |
|
|
|
Post by sd on Jan 27, 2013 21:05:26 GMT -5
As I looked through the RENKO charts, several things became apparent- The Renko boxes are continuous, and do not reflect gap moves- either up or down. The advantage of the RENKO charts is they are not time based- they do not change daily if price does not move outside the limits of the range of the box. This gives a succession of inclining or declining boxes- or 'bricks' as they are termed. I have 2 charts attached, one is a 2 hour Renko and the other is a 30 minute Renko- Each has a separate amount for the generation of a new box. What looks apparent, is that one should consider the prevailing trend direction, and adjust the entry order to be more aggressive when stopped out on an uptrending market and be more cautious on an entry in a declining market- This can be determined by the number of Reversal bars, or perhaps on a crossover of the moving averages The advantage of the 30 minute Renko, is the narrower price spread reacts quicker to the upturn in price, and would signal an entry perhaps ahead of the gap move higher- Since Renko charts do not show gaps, this is an important lacking feature - on both an entry and exit consideration- In the present FAS trade, price appears to have just been in a sideways consolidation- I am splitting the stops on this trade 1/2 will be @ 139.50, the other 1/2 @ 137.80. The requirement of this method is that I will need to be ready to take the next long trade that Renko signals generated by new buy bars following a pullback- 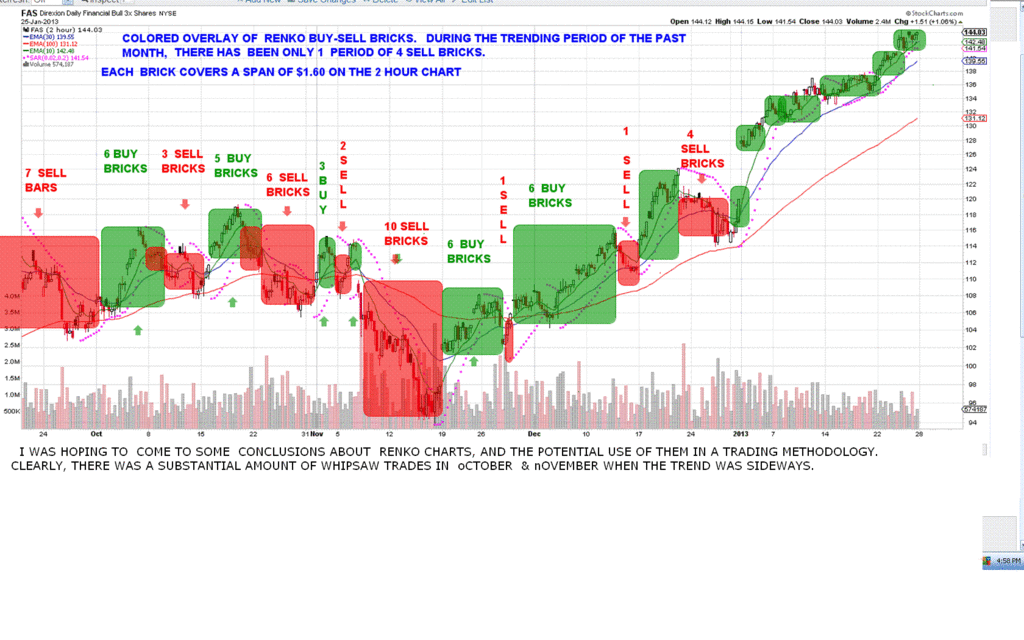 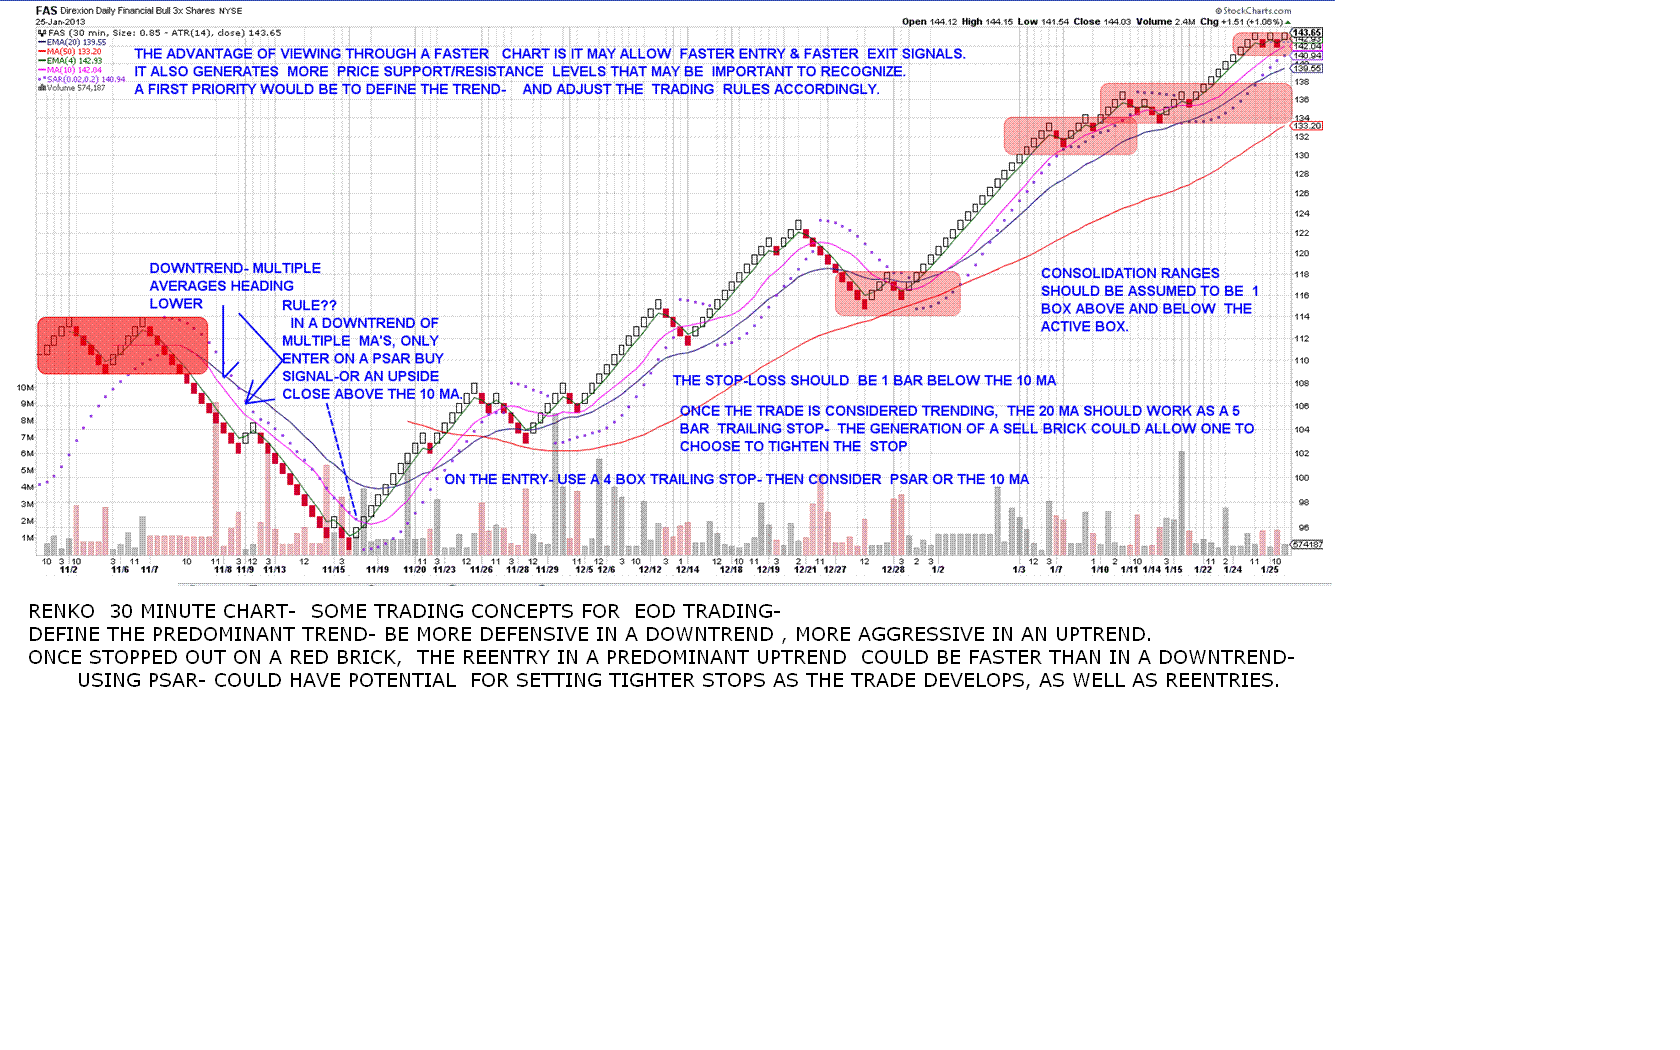 |
|
|
|
Post by sd on Jan 30, 2013 19:51:41 GMT -5
Stopped out on TNA -Sold $75.01
Painfully, I also had a waiting order to purchase more that I had not cancelled that then filled $77.40 - I have a market sell on this filled order-No excuses for carelessness.
TNA has broken down & Rolled over on the hourly-
The fas trade has weakened, but is holding in the sideways range-
I am splitting the position with stops adjusted higher $140.75, $139.50.
This feels as though the overbought complacent market is going to get a shake me up call though.
XBI also stopped out
|
|
|
|
Post by sd on Jan 31, 2013 19:22:57 GMT -5
Sold 1/2 of the FAS (7) 140.70, as well as the remaining TNA $74.59
|
|
|
|
Post by sd on Feb 3, 2013 10:22:39 GMT -5
As i posted in Bankedout's thread, I don't know how well I will adjust to actually sustaining wider losses on a wider time frame chart.
I think the levereged trades are suited for trading on a tighter leash-
The FAS & TNA trades- stopped out n TNA, and a 1/2 portion of the FAS.
The raised stop on FAS caught the swing low pullback by $.12.
I now have to consider a reentry with price now $7.00 higher-
It was my desire to protect a higher profit that caused me to tighten the stop as I did- Since I am fully invested in my account- I will have to wait for some cash to clear before reentering trades. iT APPEARS THAT MY ORDERS FOR mONDAY ARE BEING TAKEN. I will be adding to the FAS position, , DVYE, and EEMV .
Yes, it appears we are overdue for a correction, and should be prepared for that to occur- But since we cannot predict the future, the present up trend should be the focus.
|
|
|
|
Post by sd on Feb 5, 2013 21:10:48 GMT -5
THE FAS trade - I had stopped out on 1/2, added back Friday, saw the market sell-off Monday, and FAS try to close back at the recent high-
I have gone ahead and squeezed all position stops higher-- Looking at the 2 hr Renko chart for FAS- The position will still be net profitible for the entire position, ideally we see more upside-
The sentiment overall is that we are well overdue for a market pullback, and we have pending issues once again in Europe worrying some-
I have been net disappointed in my emerging mkts positions- I truly expected they would rally along with the us mkt- but that has not been the case.
In a contrarian defensive move, I have a buy-stop on SDS if it moves $1.50 above the present levels, with a 2.5% trailing stop- Just a small position-
Conversely, I will add more to the FAS position should it push higher, and trail a tight stop-loss. It looks like a dbl top today- so I want to see a $148.40 entry, with a 3% trailing stop
|
|
|
|
Post by sd on Feb 6, 2013 20:38:54 GMT -5
My Buy-stop to add to my FAS position was filled today as it closed higher and hit my Buy-Stop-I elected to add to the position IF price managed to break above the present top level. IT Did.
At this point, I now own 17 shares with a $2500 mkt value at the close. The 5 shares I added today were at a 148.42 cost, and my average updated cost is now a much higher- $140.50.
This also works technically as a stop-loss for me, below the recent basing range. This is not a bad method to increase a position- as long as you anticipate a higher potential move and can keep the stop-loss a reasonable distance away.
The FAS position is now 27% of my port value, With the stop-loss essentiaslly at breakeven and below the prior hourly consolidation range, I am comfortable with the exposure. It could roll over and likely I would get filled on the stop near my new higher cost basis.
It's getting interesting for me on a personal level to be in this position at different levels for over a month now-. I'm pushing the envelope with this -in spite of my belief that the mkt is ready to pullback with some vigor- because I need to be concerned with the TREND first and foremost-
My normal psychology tells me that we are indeed overdue, We will see a market wide sell-off any day now that takes us back a sharp 10%- 15% - That could occur- If not this week, then next week, or most certainly in the following week ...........god knows there's a lot of things out there that "should" concern us- and that eventually WILL be the reason for the sell when it does occur.
It is the CNBC news, the 'Fear' the Hype, The TV Wisdom......
What if noone watched TV, just the charts?
Conversely, MY Bond fund is going up, My small cap World mutual fund -SMCWX is hitting an all-time high -
It appears there are market segments that haven't decided it's time to exit the trade- YET.
Will try to ride this one higher.
|
|
|
|
Post by sd on Feb 12, 2013 19:52:30 GMT -5
The market has been choppy and undecided., I've been holding an overweight FAS position, and it saw fit to move higher this week.
I was also filled on TNA today - 20 shares -buy-stop $79.65
I had placed a buy-stop in the event the market chose to push higher one more time.
I also went short Gold today 300 DZZ $4.65. This was also a buy-stop on the recent move higher of DZZ.
I am actually quite surprised that this market has continued to try to push higher- When I listen to the bears- the Sequester, The rebounding issues in Europe, The political stalemate- There seems to be a lot of reasons investors should be worried-
The "bond" trade is supposedly running out of steam,, the economy is sluggish, unemployment is an on going issue-
I am not getting complacent- stocks are reaching 5 year highs, "New Money" is joining in the market looking to get some gains-
The Fed is still proactive in keeping the cheap money flow- It all feels like it should be time to get defensive-
State of the Union speech tonight- A lot of dissention between the Republicans and the Democrats. The Republicans sound determined to allow the Sequester to go through- Fiscal responsibility- The Democrats reportedly want to not rush into fiscal responsibility-
The Republican platform surely seems to be more pro business.....
The fiscal policy that comes through may disrupt the mkt-
I'm trying to stay with the trend and looking more at RENKO charts for the following stop-loss guide.
As long as the trend stays positive and doesn't rollover, I'll try to give it some elbow room.
If the mkts digest the State of the Union in a positive fashion (Unlikely Imo) and move higher, I may play the upside move with adding to positions with higher buy-stops..
|
|
|
|
Post by sd on Feb 17, 2013 13:07:14 GMT -5
114% GAIN, & A 2.8% LOSS- 19 TRADES- 1 LOSING TRADE. Just send $949.00 for your introductory subscription to this amazing method !Your credit card will be billed monthly- this offer comes with a 30 minute guarantee! Don't Wait!!!  OK Guys- LOL - But- that's the generated results of appling a 2 hr Renko chart on Fas since last Augest- The actual results would be considerably different - significantly less in fact due to a number of factors- Trade execution, gap moves in pricing, both higher gaps on buy-levels and gap downs on sell stops, The Renko bricks show a continuity in price that does not exist; cost of commissions, and last but not least, operator error. With all that said, and acknowledged- viewing price through what is considered "normal" price action- Candlesticks, BARS, - and viewing it through blocks based on averaged price volatility ranges (Renko Bricks) gives a different perspective. The Renko Volatility bricks would lend themselves to an unemotional- somewhat automated type of trading approach- and could likely be easily fitted into an automated type of approach. Bars and candlesticks are open to the viewers interpretation, with individual bars or candles perhaps being interpreted as having greater import than the prior bar/candle- If one views bars or candles, one sees the exact price action at the end of each day. Renko charts do not show the extent of the price action- only that portion that meets the ATR criteria that would generate a new "brick" In the attached charts, a daily Renko brick has a range of $3.70, a 2 hr $1.55 , a 1 hr $1.15, a 30 minute $.80, a 15 min $.55- The attached charts just show daily & 2 hr. Renko charts don't lend themselves to being intuitive of price action. The various time frame Renko bricks get closer and closer to reacting to smaller and smaller price moves- One may find that a Renko daily chart is too unresponsive, and want to use a Renko 2 hr or a renko daily. To get a closer view of what the price bars are saying, one can drop down to a fast Renko time frame- I'm going to continue to look at candlestick charts, but I am also keeping one eye on the Renko charts - it smooths out the price action, and I think will allow me to stay in a trade longer and not be reactive. I think this can be helpful in trading on one time frame and investing in another- Since staying with a trade or investment as long as it is performing makes the most sense, the different perspective may be an asset. As an example- Since Mid November When the Renko buy brick occurred, There has not been a single sell brick generated on the daily- Yet price had some swings on the daily that I indeed reacted to since I entered in Dec. With the FAS trade this "long in the tooth" , it may be prudent to divide the position stops based on a faster Renko chart- perhaps the 30 minute- perhaps look for prior swing-lows on a faster Renko chart time frame to represent support in case of a pullback. This could also be a possible method to "hand-off" the trade to a longer term position. keep in mind, that a faster time frame will generate a reversal brick closer to the actual price movement- while eliminating some price action noise. This could be an advantage (with more whipsaws) of getting in on a reversal of trend move prior to a price gap higher- Finally got some free time this weekend- Snow in NC! SD 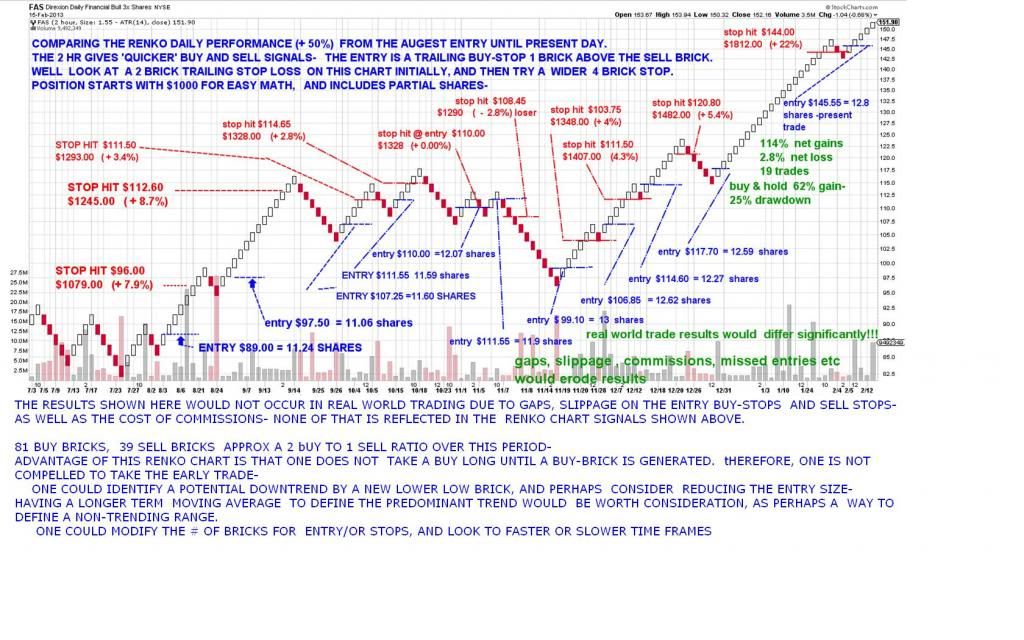 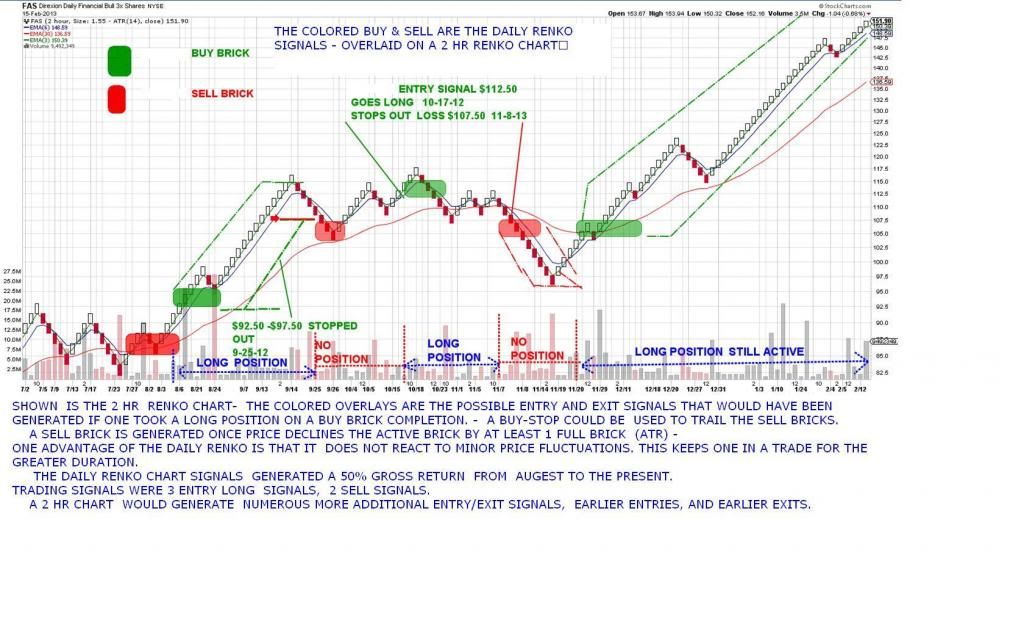 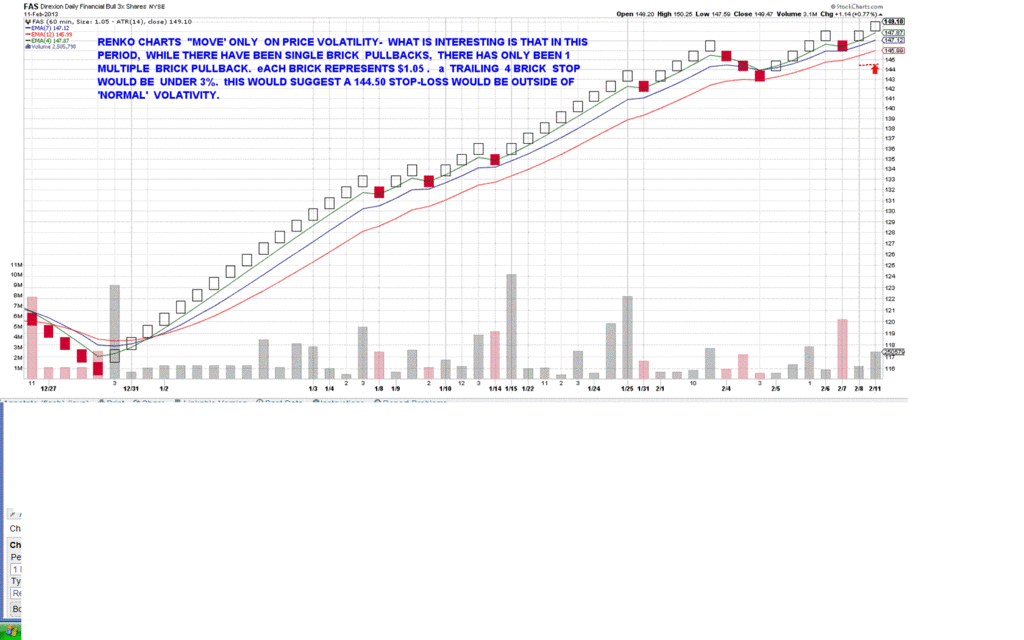 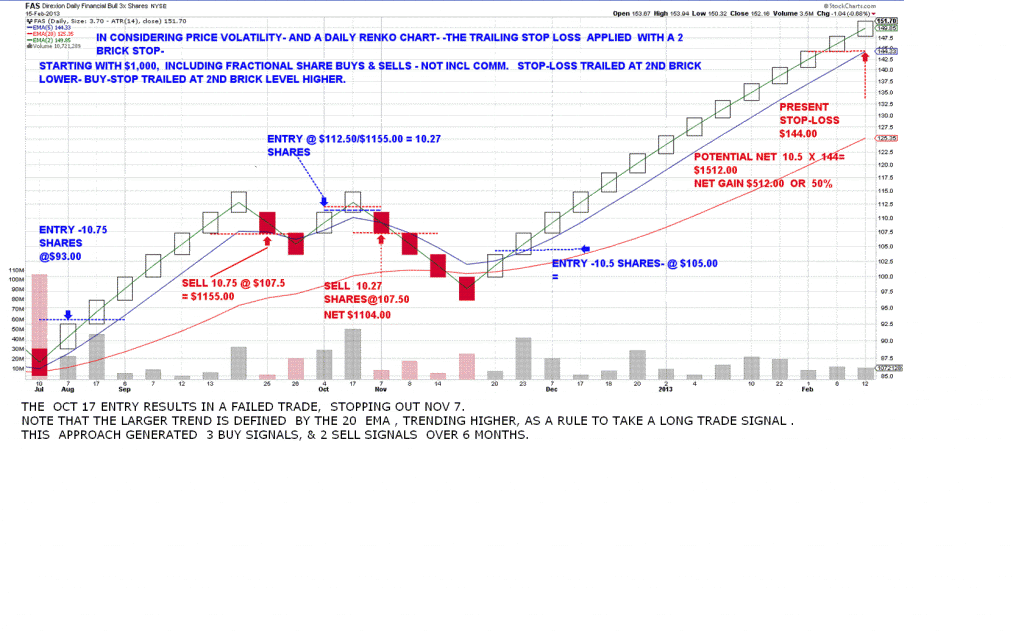 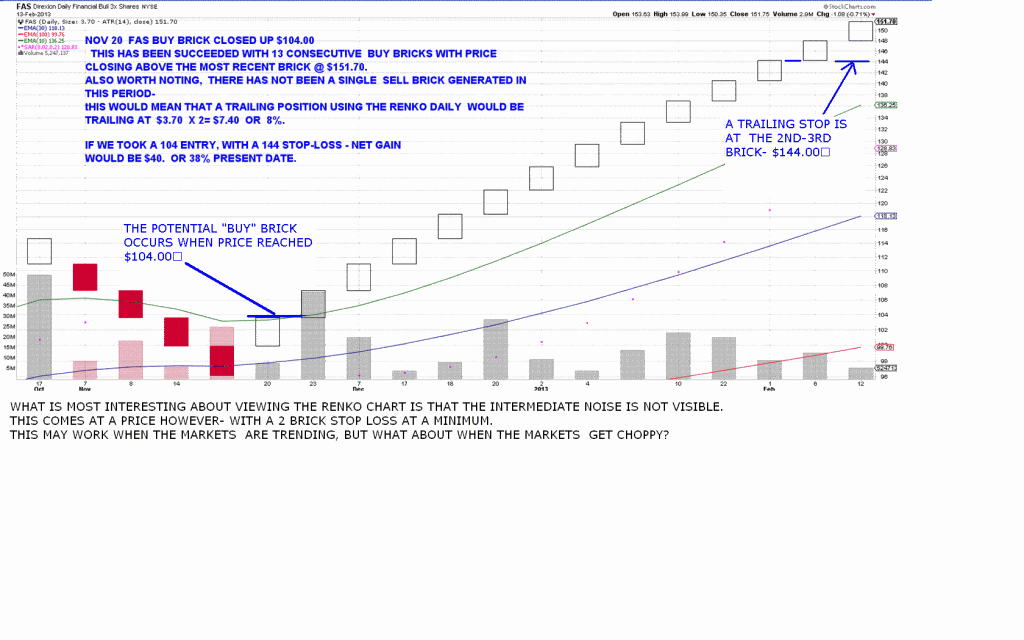 |
|
|
|
Post by sd on Feb 17, 2013 16:59:50 GMT -5
This example is the fas 10 minute chart. Price pushed up & made a new high, and is consolidating in a relatively narrow range. The temptation is to set a stop much closer to lock in a higher gain. Price hit a 154 high, and the next lower perceived minor 'support' is 144-148.00. Since consolidation is "normal" , and I would like to see price trend higher- I am setting a split stop $147.70 & $144.70. I am overweight this trade, and will likely set the higher stop to bring me back to normal weight. I will revisit the higher entry when stopped out. Considering that a daily brick is $3.70, and 2 daily bricks = $7.40, price had almost hit $154. 154 - $7.40 = $146.60. The actual daily brick is at $151.70 top, with a 148 bottom, and price has closed above the brick. My stops based on the 10 minute chart fall just below the present daily brick and the 2nd daily brick bottom. 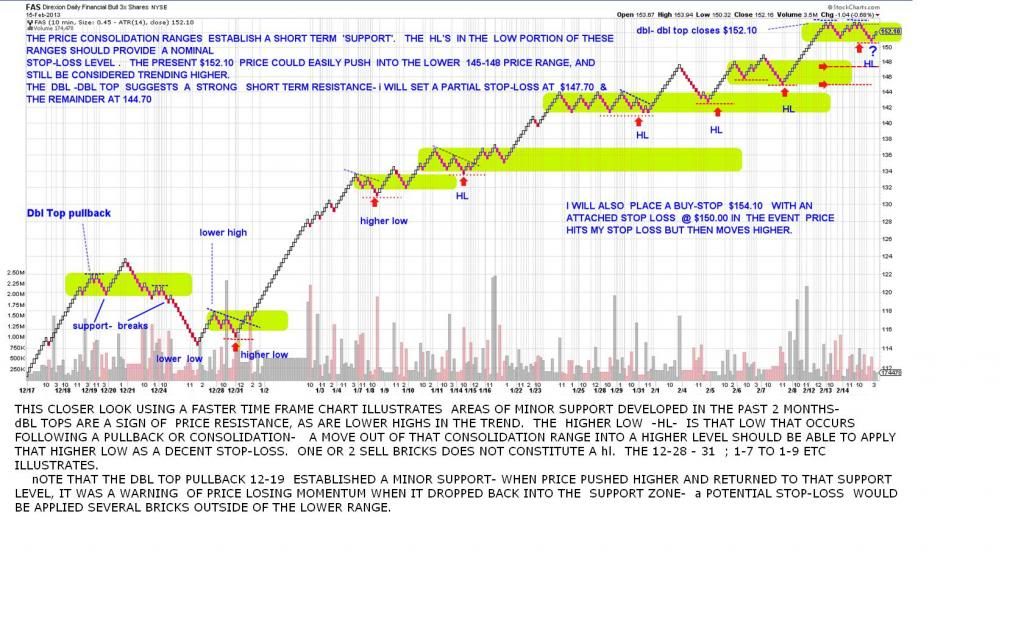 |
|
|
|
Post by sd on Feb 17, 2013 19:32:15 GMT -5
I was always bad at simple math
Here’s a simple math problem for you: A candy bar and stick of gum together cost $1.10. The candy bar costs $1 more than the gum. Quick: How much does the gum cost?
|
|
|
|
Post by sd on Feb 20, 2013 19:18:33 GMT -5
MY entire TNA position sold today at the split stops -
1/2 @ $80.69 and 1/2 @ $79.60-
MY entry was 20 @ $79.65 and 10 @ $80.55 , so the trade just covered costs and a happy meal at McDonalds.
MY Gold short trade gained some traction with GLD dropping nicely today- It is the opposite of what one would expect- I still have a mindset as Gold being the "alternative" safe haven play-
At one time it would have rallied higher on equity weakness. It hasn't correlated that way in some time. That said, I have tightened my stop-loss on this trade to $4.92,, $ 4.85 to lock in the majority of the gain. Should the trade continue in my direction, I will continue to ratchet the stops higher- just giving some elbow room.
This market action response to the Fed's statements today indeed seems to be the catalyst to give the market a reason to embrace an overdue correction-.
I want to simply place a market order to SELL the FAS position-
but I will stay the course with a split stop- However, today's action- even with the RENKO chart perspective- is more bearish than we've seen in 2 months.
I will be selling the 2/3 at a 149.00 stop- just beneath today's pullback low- The remainder will sell at 148.00.
I 'expect' that both stops will be taken out tomorrow.
I would consider taking the flip trade- SDS, or TZA (up 5% today) with a tight stop- waiting for some cash to clear.
However, the uptrend is still intact until broken- but it feels like this may finally be the motivating straw that breaks the uptrend's back- Along with Housing appearing 'weak" ......
I will be swinging some active $$$$ out of the retirement account into more defensive allocations-
Thought this shouldn't happen until MAY- but consider the over extended rally we've had.....
|
|
|
|
Post by sd on Feb 21, 2013 20:51:49 GMT -5
Sold 11 FAS 148.20 & 6 @ 148.00.
The overextended run indeed reached it's peak near term.
This feels like it will be a roller coaster ride lower vs a straight drop.
But then again, my sense of what the market should do is usually not the reality of what occurs.
My raised stops on the Gold short trade were not hit-although gold closed higher today- I raised the stop on 1/2 to $5.01 and 1/2 @ $4.92. I expect that as money flees the pullback, it will temporarily support Gold . My stops are quite tight, trying to lock in the larger part of the move as a profit.
|
|
|
|
Post by sd on Feb 22, 2013 18:31:47 GMT -5
The market rallied back today, with the Dow making a new close There seems to be a reassessment of the significance of the fed minutes -. Some mkt pundit suggested that business mergers are good, profits are up, the Fed will be restrained in tightening appreciably - and when it does start , it will be a sign of the economy is improving and coming off life support.
Conversely, Consumer discretionary is weakening, Walmart guided lower, several retailers as well. Gas is jumping higher beyond historical price levels for the spring-
Noise from Europe- Tightening in China- US Housing starts are down in Jan as well- -The Upcoming Sequester will cause job losses-
Doesn't sound like a foundation for the market to move higher - does it?
Will continue to try to stay with the trend direction- yet defensively with fairly close stops-
I will likely reenter the financial trade Monday if it has the momentum to push higher-This week's pullback , with today's rebound higher sets a solid swing low to apply as a marker for consideration as a final wide stop-
1/2 my DZZ position hit my tightest stop, and I repurchased 1/4 with my remaining free cash, While also taking a 20 share $1087.00 ZSL. silver short.
The dollar is gaining strength, and that erodes the Gold trade , as does a trending mkt-
Gold moved higher as the market slipped lower this week-So I assume the reaction will be the same with the next market sell-off.
While my expectation is this should happen sooner than later, I will stay with the present trend- I was thinking to see a continued weakness and take a short position-
That will wait until the swing low gets taken out.
|
|
|
|
Post by sd on Feb 22, 2013 20:16:42 GMT -5
|
|