|
|
Post by sd on Dec 16, 2012 19:22:36 GMT -5
SWIFT is a friend that I have exchanged some ideas with post clear station closing to the public.
He or She is a fundamentalist first - believing in the ultimate investing mantra- that if you Invest in a "good " company, and the price declines, as long as you are willing to hold it long enough, and to perhaps add to your position , you will eventually be well rewarded.
That Peter Lynch and Warren Buffett- outstanding examples of a certain investing approach, indeed have it right for all history-
While I don't agree with my friend's assumptions about the benevolence of the market place, I do have to agree -based on personal experience, that I am likely better suited as an "investor" than I am as a short term trader.
The function of this thread is that I will look to discover ways in which I can apply a TA focused approach on some longer term trades-
Please feel free to add to the discussion at any time-SD
|
|
|
|
Post by sd on Dec 16, 2012 19:47:53 GMT -5
One of the criteria to understand where the future may go is to understand where the past has been. We discussed several stocks for consideration-among them was GE- I elected to use GE as a guineau pig to start to develop a strategic approach using a weekly chart- Instead of the typical chart, I elected to employ the Renko Bricks- and to use some moving aveages -crossovers as the signal to respond to-This seems to be a good method to view less emotionally, the variations in price over time- The initial chart looks back 6 years, and so includes the large 2008 drop- which will skew the results in my favor of an active approach. Will we ever have another 2008 market drop-? We can only hope not- However, this approach seems to work to get out of a position on weakness, and to reenter- There is a 4 box price variation needing to occur - Possibly a daily chart could be applied to tighten the signal. 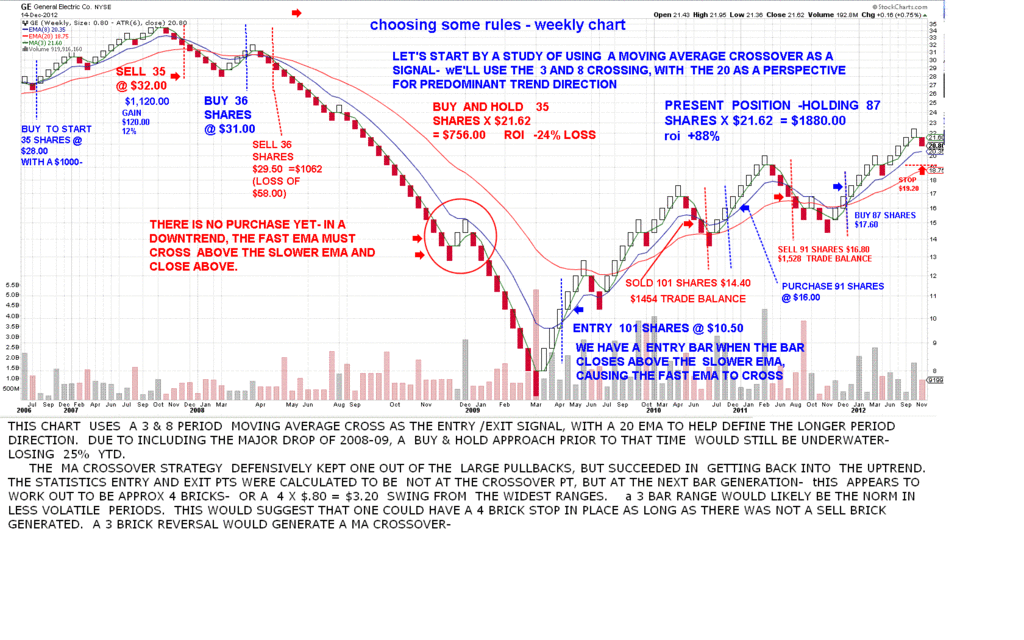 |
|
ira85
New Member
Posts: 837
|
Post by ira85 on Dec 16, 2012 22:39:32 GMT -5
|
|
|
|
Post by bankedout on Dec 17, 2012 0:01:07 GMT -5
I have to strongly recommend that you stay away from individual stocks for long term investing. My recommendation is to trade an unleveraged index etf, such as SPY, MDY, IWM, or EEM (or all of the above)
|
|
|
|
Post by sd on Dec 17, 2012 10:49:50 GMT -5
SD, I may be off topic for this thread, but I wanted to pass along something interesting about leveraged etf pairs, one leveraged long and one leveraged short. This study says shorting both the long and the short result in big win. seekingalpha.com/article/1066111-....tf_daily&ifp=0 -ira That is an interesting article Ira- There have been a lot of follow-up articles to it that have the author reevaluating his thinking it was almost "risk free"- I cannot borrow to short in any of my accounts as they are conventional or Roth Iras and not allowed- The concept of the article was interesting, and many of the follow up comments and suggestions-added concepts to it- and are over this country boy's head. Don't have any concerns about being on/off topic- thanks for posting-SD |
|
|
|
Post by sd on Dec 17, 2012 11:28:48 GMT -5
"I have to strongly recommend that you stay away from individual stocks for long term investing. My recommendation is to trade an unleveraged index etf, such as SPY, MDY, IWM, or EEM (or all of the above) "
Thanks for the suggestion Bankedout-
ETF's with a longer term view - Ultimately, that is where this thread will take it's focus.
I hope to develop a core group of 4-5 ETF's to provide diversification- The major etf's have plenty of liquidity-and the ability to swing short through corresponding etf's- are allowed in the Ira-I may however include GE within that selection-it is a widely diversified international co--and one of Swift's lt holds.
Ideally in the next few weeks I will have some ideas around selection- Your comments and suggestions are always welcome.
Thanks , SD
|
|
|
|
Post by sd on Dec 20, 2012 21:09:15 GMT -5
I was getting ready to shift some allocations- out of bonds and saw that this was still trending higher- bond and similar funds are relatively slow movers and yield less signals- in discussing how best to not be reactive to a price chart, the Renko chart smoothes out price action- but can it be used successfully as a entry/ exit- for a position- As I look back at a 6 year chart of AMHIX - a long term buy and hold yielded 6.5%- with a 25% drawdown or so in 2008. The renko chart - if we exclude the major drawdown period and resulting bounce higher returned just between 4-5 % / year with very little drawdown (not calculated) However, if we include the omitted period, the annual return exceeds 13% - with a smaller drawdown. This supports the thesis that using a timing approach can lessen the risk and increase the return- and this becomes particularly appropriate in periods of larger volatility- This approach simply keeps investors OUT of the market during the majority of periods of decline- a lot of study needs to be done, and perhaps the 08-09 big volatility move will not occur again in an investors life time (Yeah, Right) - In the event of just 1 such event, this approach yielded a 200% outperformance- with a minimal drawdown% relative to the gain. It yielded a sub return in markets less trending- This was a very superficial eyeball study- but the initial results appear to be worth further analysis. This approach also generates relatively few trades. 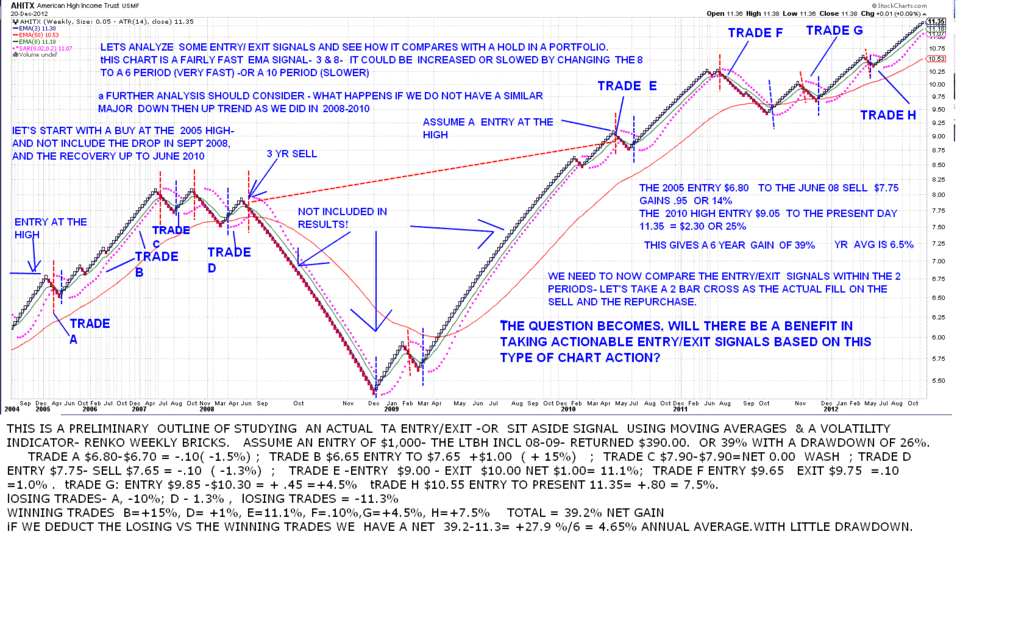 |
|
|
|
Post by sd on Dec 22, 2012 13:46:10 GMT -5
First, Caveat Emptor- Instead of jumping into this thread with some untested TA approach illustrated on one equity,clearly this is a Case of putting the cart well ahead of the horse-optimism on my part- that this is worth researching a timing technique for a longer term investment approach. Not having any backtesting software to verify the thesis- and doing it manually will likely yield optimising the results based on past performance a probability.That said, I will see what develops in the months ahead.... . There's a lot of available references on portfolio construction, asset allocation, and rotation, and market 'timing'. "the Ivy Portfolio" by Faber studies the large -Yale-Harvard as they construct their investment models-,David Swenson's change to Yale's investing model, and how investing has changed today. Seeking Alpha- is a great resource- One of the frequent contributors on portfolio development is Lowell Herr seekingalpha.com/article/1078221-rethinking-asset-allocation?source=email_etf_daily&ifp=0itawealthmanagement.com/itawealthmanagement.com/2012/10/20/investing-102/Those interested can follow his articles, or sign up for a $5/month premium membership- seekingalpha.com/article/1077051-positioning-for-2013-guide-to-the-series- a new series of articles will be upcoming |
|
|
|
Post by sd on Dec 22, 2012 19:13:37 GMT -5
Itawealthmanagement.com/2012/02/17/ita-index-making-it-work/
uNDER THE "blogroll" category, should be a link to the TLH spreadsheet download. this page shows the various indexes
employed in this strategy.
I have to install excel on this new computer yet- but
I wanted to post the link while I accessed that URL.
|
|
|
|
Post by sd on Dec 22, 2012 19:48:59 GMT -5
Swenson initially proposed a starting portfolio - VTI 30%; VEU 15%, VWO 5%; VNP 20%, TLT 15%,, AND TIP 15%. Reportedly he modified the starting portfolio in 2009- See this article seekingalpha.com/article/146731-david-swensen-changes-his-portfolio-allocations FROM THERE FABER EXPANDED TO A 10 POSITION PORTFOLIO- MADE UP OF EQUAL % VTI,IWN,VEU,VWO,BND,TIP,VNQ,RWX,DBC,GSG, - LOWELL HERR DEVELOPED AND ANALYZES SOME 8(?) DIFFERENT ACTUAL PORTFOLIOS WITH DIFFERENT MIX RATIOS- USING ACTUAL $$$$- AND UPDATES THEM ON THE iTA MEMBERSHIP.the $5 fee certainly is worth a look inside .... Herr's models not only calculate historical performance, but extrapolate some future data such as Risk - An investor could simply select one of Herr's actual portfolio models for his/her portfolio- There are various elements to be considered- #1 -Portfolio selection- diversification is important- correlation #2 Weighting- equal % or some way to favor overweighting an index ? Momentum etc. #3 Timing signals- Faber took a 195 day moving average- and selected that as the crossing point to enter or exit- and included a 30 day -could not react- after the action to eliminate whipsaw entry/exits. Faber also felt additional investments would improve the returns and lower the Risk. Let's keep this simple, and start by analyzing how different technical signals compare - and we'll do some analysis using the Swanson Basic 6 portfolio. We can initially start by applying a simple price chart and adding a moving average-say the 200 ma to start We could then add various moving average combinations , and determine what signals improve performance in what type of markets- Lastly, we can determine if Renko charts - or moving averages of Renko charts can yield any improvement other than the visual lesser signals. Let's start with VTI.-In the next post |
|
|
|
Post by sd on Dec 22, 2012 21:17:54 GMT -5
In putting up a chart of VTI , several things come to mind. The outstanding performance of the past 4 years is indeed outstanding! BUT, step back and look at a 5 year performance- and the performance looks poor- certainly not near a market average of 7%..... But, as we step out to the 10 year, the performance once again improves- Go back a bit further, and the annual performance will decline. But let's concern ourselves with the recent 10 year and see what we can learn 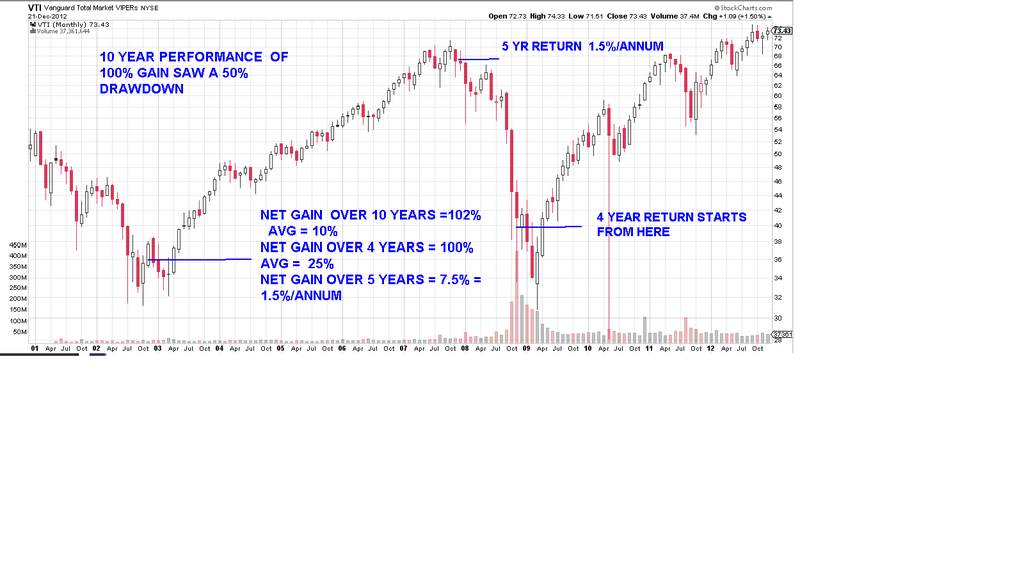 LOOKING AT A 10 YEAR weekly CHART with multiple moving moving averages- While looking at the 10 year chart, the left side of the screen shows a relatively smooth uptrend for 4 years, then the crash of '08, and then a choppy uptrend the past 3 years- it would appear difficult to fit a set of rules on timing exits and entries that fit all phases of this chart- a closer look at the individual major trend periods might provide better insight to a common approach . 10 yr chart-multiple ma's 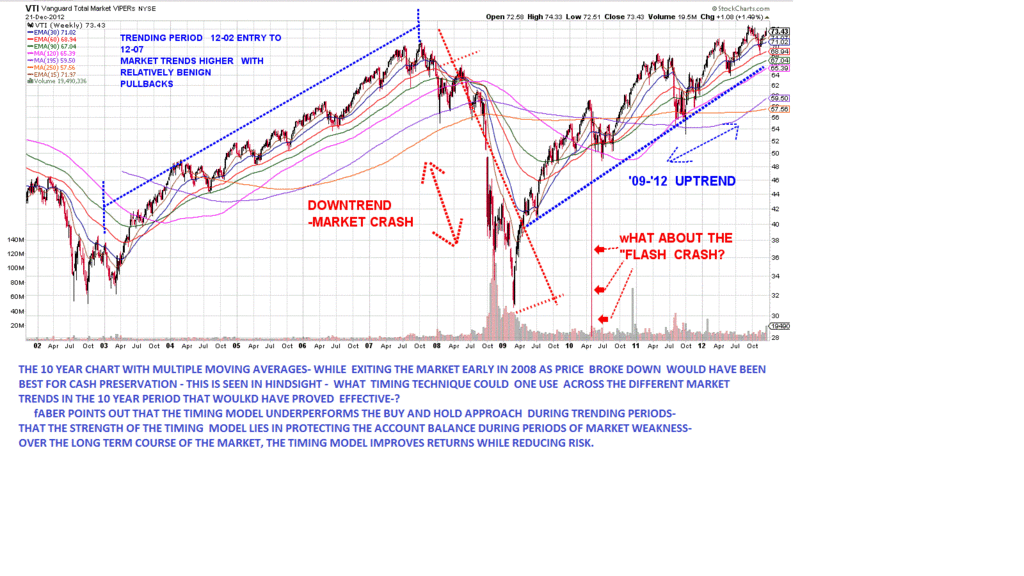 12-23-12 I'm modifying this thread and adding charts within this particular post to keep things related-chart wise- The prior chart was simply too noisy to try to make any conclusions- I have taken a smaller snapshot view of the first 5 years 03-08 of VTI . When one knows what the outcome was, one is optimizing the chart- I purposely chose a MA that would have been wide enough to clear the pullbacks within the uptrend that was occurring- and that "optimising" has indeed proved educational- It is comparing a Buy and Hold entry vs a TA entry/stop-loss - My initial conclusion is that - because of the unexpected market crash,in '08 - the trending market was interrupted and a reality of what is possible occurred for the second time this past decade +. Unfortunately, on both the entry and the exit, the delayed MA approach was whipsawed, reducing the net end results. That first 5 years of the market was a relatively smooth and benign market- generally uptrending, with periods of sideways consolidation. One could try to add some rules - and that may be necessary- that suggest waiting for a price bar to actually make a close before taking action on it- There should also be a consideration of a way to identify a market trend condition, and if the market is consolidating, modify the entry rules - stagger the entry /exit off of that type of condition. 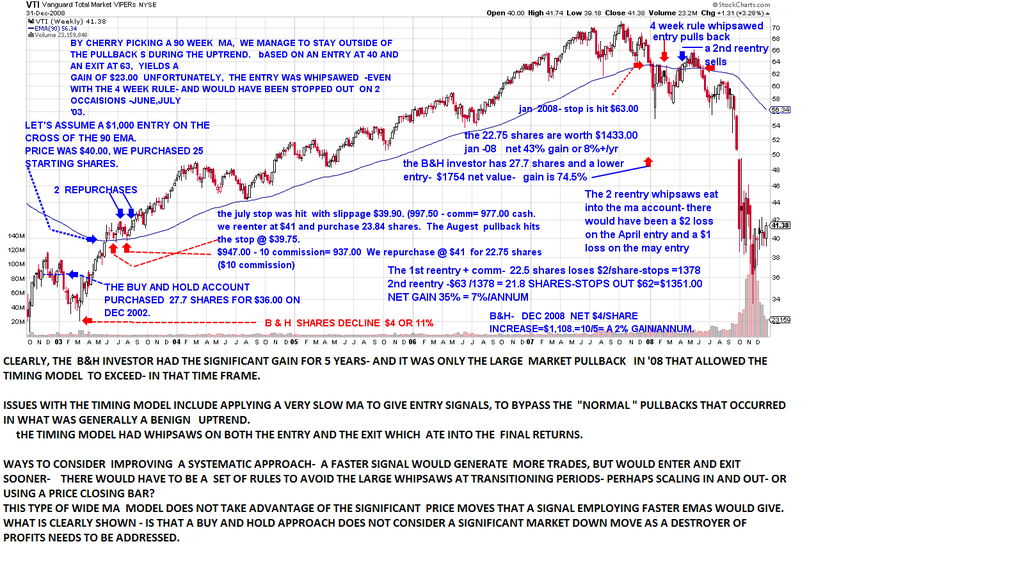 |
|
|
|
Post by bankedout on Dec 23, 2012 9:44:05 GMT -5
I guess one question you have to ask yourself is how long are you willing to sit on a position?
It looks like the average holding time in this time frame would be at least 3 years.
Can you sit tight that long?
I suppose there is one way to find out....
Remember that you are not going to catch the bottom or the top. You will only get the 'meat' of the trend.
If you want to catch the bottom and the top, you will expose yourself to whipsaws.
|
|
|
|
Post by sd on Dec 23, 2012 11:21:33 GMT -5
"I guess one question you have to ask yourself is how long are you willing to sit on a position?
It looks like the average holding time in this time frame would be at least 3 years.
Can you sit tight that long?
I suppose there is one way to find out....
Remember that you are not going to catch the bottom or the top. You will only get the 'meat' of the trend.
If you want to catch the bottom and the top, you will expose yourself to whipsaws."
You are correct-I do not think I would have the temperament to sit tight that long, nor sit through the potentially large $ swings-
Faber pointed out that his approach would underform in a trending market, but eventually succeeds- due to major market declines- He doesn't get back in at the bottom, nor exit at the top- One has to be aware that the next pullback in the market could be substantial- or we could go into a protracted multi-year slow decline. I'm trying to work through the exercise of reviewing the concept that Faber suggests- understand it's application- and and then get it down to a method that would be focused on ways to trade trends within a weekly chart- Perhaps the best analysis will be to focus on ways the relatively up/down market volatility swings of the past 3 years could have been traded to an outperformance vs a buy and hold-approach-
For one to think an approach will work , it needs to have a degree of success across different market conditions- So , I'm going to look at different wider methods, and then narrow the focus to more timely-
Thanks for the input-
|
|
|
|
Post by sd on Dec 30, 2012 8:02:15 GMT -5
I spent some time on etfreplay.com this weekend.
While it has a premium membership site, some aspects are available for free.
In the backtesting tab- You can look at SPY, EEM, and several others-
I played around with backtesting spy- both on the simple entry/exit crossover of a monthly average (with a action taken only at the end of the month following the cross) the 195 day sma cross proved one of the more profitible periods-
I then toyed around with ma crossovers, starting with a 5 day crossing a 10 , and various combinations up to 5/80. going back some 12 years.
the 5/10 daily cross underperformed the spy with a large -54% drawdown
Interestingly, almost each daily period I checked had improved results when the entry was not on the day of the cross but at the end of the month following the cross. more later-
|
|
|
|
Post by sd on Jan 19, 2013 19:00:37 GMT -5
As I started this thread, I had figured i could do just a little focused research and then come up with a workable investment plan that I could then extend to include my IRA mutual funds as well.
The large number of SA articles, and some portfolio examples
proved to be a continuing source of inspiration & education, as well as the ETF focused sites- ETFreplay.com, ETFdb.com etc.
The more I read, the more I find out that there's a lot I simply wasn't aware of.
When considering to primarily focus on ETF's- I chose to start with my trading account -Trading 1 active position, (FAS) but looking to expand into what should directionally develop into exposure to the foreign & emerging markets.
Investors typically have a home country bias, but The US has underperformed in GDP growth compared to many of the world's economies. Investing some monies where the growth potential is strongest should offer a greater potential upside-
One of the tenents of a good portfolio includes diversification, to not put everything into highly correlated investments-
We are now definitely becoming a global economy, and so there is a large correlation between foreign markets and the US market, but there is still a growth factor to consider that we may not get here in the US markets.
Yes, there is Risk as well, so it's important to have some diversity, and a trading plan one can sleep with.
As I've done some reading these past weeks, I've learned there's a number of different ETF's available today that one needs to consider-
First, one may want to consider equal weight ETF's vs cap weighted- Equal wt gives an opportunity for the smaller caps within an index to propel forward, vs being overweight in a few large cap names.
The various index- Example the S & P 500- is often beaten by the midcaps or the S& P 400-
There are funds out there that are not stagnant- they rebalance their holdings periodically- This is an important item that many investors do not give much consideration to-
Interestingly this past year- the value componenets of small-mid- and large cap funds outperformed the growth funds.
Dividends are an important component of long term wealth-
There are dividend funds that may be slow and steady (companies that have consistantly raised their dividends for the prior 10 years) may be filled with JNJ, P&G etc- while on the other end there is a rebalancing fund that takes the best 10 of each sector, and rebalances- There are the Hi-Yield dividend funds, and safer -
Bonds- One should have a component in Bond funds- Again, Bonds are not the inverse of holding stocks per se- depending on what one is looking to achieve- One can choose their level of Risk in the various Bond offerings out there-
There are trend following etf's- that take a position in an index , , and then automatically exit if the index drops below a certain average, go into a "safer" T bond- and will then renter when the index climbs again-
There are funds - like Credit Suisse that has a 130% long and 30% short fund- CSM- that has outperformed the S & P , as has the RSP.
In the end, one needs to hold a core strategy- and many core ETF's have extremelow expense ratios, and can be traded at virtually no cost through some brokers- If one can eliminate a commission cost, it allows one to build a position in small increments over time -
but as I learn more about some of the various offerings out there, the higher expense ratio may be worth the increase in performance.
I had funded another account last year with Scottrade, and had not made any purchases- Scottrade offerred a few "free" etf's at that time, but no longer try to compete with that - I will likely look to transfer those funds to a different broker that would allow some "FREE" trades in ETF's-
At the present time, I am holding DVYE ( EM dividends),
VNQI (Ex-Us Real Estate) , EMLC - (em. mkts Bond) diverse world wide holdings.
These were the first investments i took to give me some diverse exposure in a global sense. They may very well change as I learn to qualify my investment decisions going forward.
However, i had wanted to make a start in this direction- and took these positions the 1st week in Jan.
In my IRA, I have also made some larger shifts into foreign/emerging mkts via the mutual funds offered there-
The Spectre of the US markets & corresponding issues that are unresolved make one want to put the head into the sand- and to listen to the soothsayers of gloom and doom- And, indeed we may see a pullback- at some point- But do we have a market crash? Not likely- The entire world economies are trying to expand their economies- Perhaps someday, economic doom will indeed befall us, but in the interim, we should invest and trade the charts in front of us-. Not naievely, prepared to take defensive actions only when warranted; not prematurely because of a fear of what might happen some day in the future.
|
|