Continuing Bankedout's concept of using multiple ema's and instead of reacting to price volatility, react to what the ema does.
The ema/ma automatically smooths price action.
If price is removed from the screen and only the emas are left, the trader following the position does not respond to the ups and downs that occur in each time frame- Price action is smoothed out by the math in calculating the emas.
One thing to keep in mind, is that trending price is always higher than the emas, which trail. Price may bolt much higher , but the ema will only have a gradual turn. Thus, when the final turn does arrive, price could potentially retrace 15-25% from the price high before the ema crossover occurs.
While that seems like a lot of give-back, if that approach had kept one in a choppy uptrending stock that gained 90% and then gave back 20- not many would mind.
The issue becomes, since not all stocks turn into trending plays, (don't we know!) how does one develop the bigger trending plays without sustaining big losses on entries that don't work out.?
I would say that I would not expect any trade to become a trending trade until it had passed the BreakEven threshold- where the trailing stops could gradually be widened.
This is not a unique concept - Landry suggests a similar approach in "the layman's guide to Trading Stocks" as do several other trading authors - (let your winners run) by giving them some room is the conventional wisdom. However, it's important that the winners prove themselves before being given much leeway.
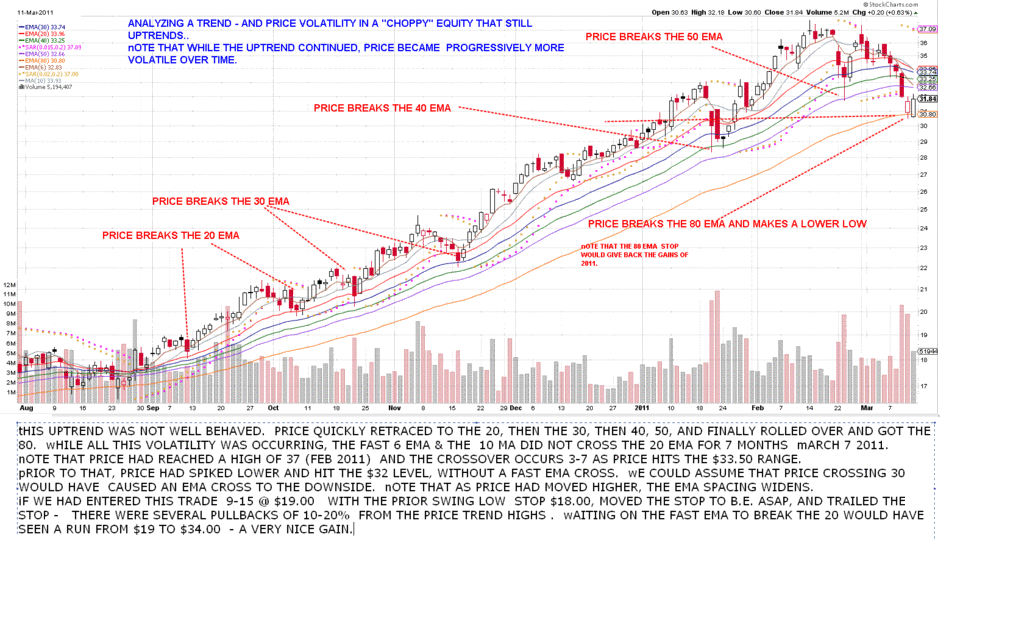
I do like the concept, and have a daily chart to post of a choppy uptrending stock . I took the name off , because it doesn't really matter what the stock is- just what it did .
I included a very fast 6ema with a 10 ma. The premise was to analyze a choppy price chart , and find the best way to enter, exit, reenter etc. on the daily- But this potentially could be an hourly or weekly chart with perhaps different emas.
I was actually very surprised, because price moved high and lower, but still uptrending, and the emas kept the action smoothed. Several times there were some close calls - I expect the fast ema to cross the 10 sma and the sell signal is a cross of the 20 ema. this approach of following the emas would have kept a trader in the position for 6+ months.
The 'weakness" in this , is that it requires a trend following trader to assume a lot of volatility in price action- up to 25% give back on this chart- off a 90% gain.
So if a trader jumps into each trade expecting it to be a 6 month trender, and gives that much leeway to his stop, he will be much the wiser and poorer .
I like this part- it fits my present thinking:
So, since we will never know if today's trade is the next big trender or the next sad story , an approach to the market that
"graduates" a trade as it progresses in the proper direction is called for.
I like taking a trade with a tight stop. If the trade heads in my direction, I'm in good stead. If it falters or turns, I'll be exiting- perhaps at 2 different levels- one very tight, and one a bit wider-
Never 8, 10,20 percent though! Usual Risk is 2-5%.
I will also scale my stops , with the first stop being larger than the remaining stop.
Let's assume the trade progresses higher where we feel comfortable in raising all stops to the Break Even (B.E.) level.
If the trade continues to move higher, I tend to break the trade in 50%, 30%,20% with the 50% part of the trade aggressively following price action. I'm wanting to lock-in some gain after a point, and by closely following price with that portion, expect to see a nice profit there, and more modestly in the remaining staggered stops.
Using the 60 minute chart, a little price move is a big thing.
The daily chart less so, and the weekly chart even less.
How would one graduate/hand-off trades from a faster time frame (60 minute) to a daily time frame/ to a weekly time frame?
Only by being willing to back off the stop levels if price continues to head in the direction intended.
Or simply add longer emas on each chart reflecting a value from the next higher chart.
This ema crossover is a great way to view a longer term holding in my opinion. In my IRA account, it is the way I want to review my holdings periodically-
This should be a daily chart that didn't trend near as smoothly as the SLV chart - A lot more volatile.
At the end of the trade , price moves 20-25% before we are stopped out, but we wouldn't mind due to the substantial gain we had accumulated over 6-7 months. It also gives back 2-3 months worrth of recent price appreciation- HMMM......
We can't start the trade with a 25% stop-loss, because we know that will put us out of business in short order- Can we evolve an adaptive approach, that starts with minimal Risk to begin with and gradually gains flexibility as the trade proves itself as going in the right direction?
How many potential entries will actuall become long-term trending positions?
Interesting questions- I'm actually thinking that recent past years suggest that the "go away in May" thesis may best be started in April. before Tax selling occurs- So I don't know if a "trending approach " has much time left this year?
But that's another perspective alltogether- SD
