|
|
Post by sd on Feb 28, 2011 22:09:31 GMT -5
I'm essentially restarting this thread . Due to the mechanics of previously posting a large screenshot, it affects the continuing thread page size and makes it larger than a 'normal 'view should be. I was going to copy/paste the prior few initial posts incl Ira's response/comments. but I'm now concerned that that would also be in the wider format since copied from the origional. Therefore, a fresh start to try to maintain a "normal" screen size that should work for anyone trying to read this on a 'normal' sized screen.
This thread is starting off as a 'blog' of sorts, some personal thoughts and some charts - and since "THEY" proclaim that a great deal of trading success/failure is predicated on the psychological elements of being a trader or a person who makes a decision to occaisionally trade......usually biased on emotional elements or "beliefs".....and those bias's usually undermine whatever trading system one has .......IF one has any system at all.......I hope to comment on some of those elements periodically as I strive to put some perspective on employing a more disciplined approach vs discretionary trading .
Caveat Emptor- "Buyer Beware"-
What I am sharing here is not a 'proven' approach. It is what I am employing at the moment and is subject to future change. It has happened to work well the last month or so , but that does not mean that it will work going forward.
I would encourage any readers to feel free to comment and challenge- We hopefully learn by our experiences, and the market is a dynamic teacher, daily presenting a different pallette .
Since I don't have but an hour or two in the evenings to assess the day's events, others will have an entirely different view.
How true it is that we actually Trade on our BELIEFS. about the market. The direction, The "Where" the market should find value, and price appreciation. When we think we "know" what the market should do, we are asking the market to succumb to our interpretation of what should happen. We open ourselves up to failure if we have a strong belief system of what "should" be.
Price action is the ultimate dictator of "What Is" as decided by the market participants on any given day. Any number of random events can affect how the market chooses to interpret the value of any single equity , on any day. Certainly equities in similar sectors seem to share direction as the market paints with a wide brush -generally.
I have been fortunate this past month that we have had an amazing continuing bull market in some sectors, and wonder how well this approach will work in the weeks or month ahead as the market has a 'normal' retracement. I think it's the right approach because it is designed to minimize loss and protect profits-particularly in an extended market- We'll see- SD
|
|
|
|
Post by sd on Feb 28, 2011 22:15:19 GMT -5
DG- This initial post takes up 90% of my 20" screen size, and seems larger than what may fit a 'normal screen. Is this first post -without charts- too large? Thanks, SD
|
|
|
|
Post by dg on Feb 28, 2011 23:29:15 GMT -5
It fits okay on my screen.
|
|
|
|
Post by sd on Mar 4, 2011 18:18:44 GMT -5
Friday, Mar 4- summary-
For the past month + there has been turmoil in the middle east, with the latest ruler of Libiya-Kahdafi being the source of protests, and potential overthrow of his regime.
The steady up Bull market we had in the fall, started hitting some turbulence. Of course , I had decided about that time that I should give my stocks some additional stop room to "stay" in the trade longer- assuming the uptrends would continue. I also took some trades supporting my view of the market being extended, and embraced some reversal trades.
As one can expect, this did not work out, my crystal ball was undoubtedly a bit fogged up with anticipation of jumping in the very early stages of an overdue market correction.
I know that one of my long time trading weaknesses is
to take profits too quickly on a small sign of weakness. And then not reentering the trade again once it resumed.
Perhaps it was all just poor stock picking, or sector rotation, but I entered a few trades in January that I gave some width with my stops and got hammered relative to my "normal " loss, and the stocks continued to go lower. I expect anyone that's ever traded has experienced this as well. I shed 5% of my account in a few weeks, and simply realized that I can't stand that type of loss wrapped around discretionary trading-
Positions that gain usually do so more gradually than stocks that decide to fall.
I actually went back and read my other thread from the beginning, and realized that some of my best trading gains years earlier were in volatile markets and I was making trade decisions on a intraday chart- when time permitted during the course of the work day.
That was a short lived period of time, and work duties got too pressing to allow much intraday computer time- even at lunch. However, this read prompted me to visit some of the daytrader threads at Elite trader.com.
Daytraders often take a very early entry signal on a price bar, and take a quick loss if price does not behave as it should.
They take this signal repeatedly, expecting the minimal losses will be overcome with a much larger successful trade.
Since I cannot spend any time intraday at a computer looking at stocks, and am limited to a few hours in the pm , I elected to adopt a trading strategy using a 60 minute chart.
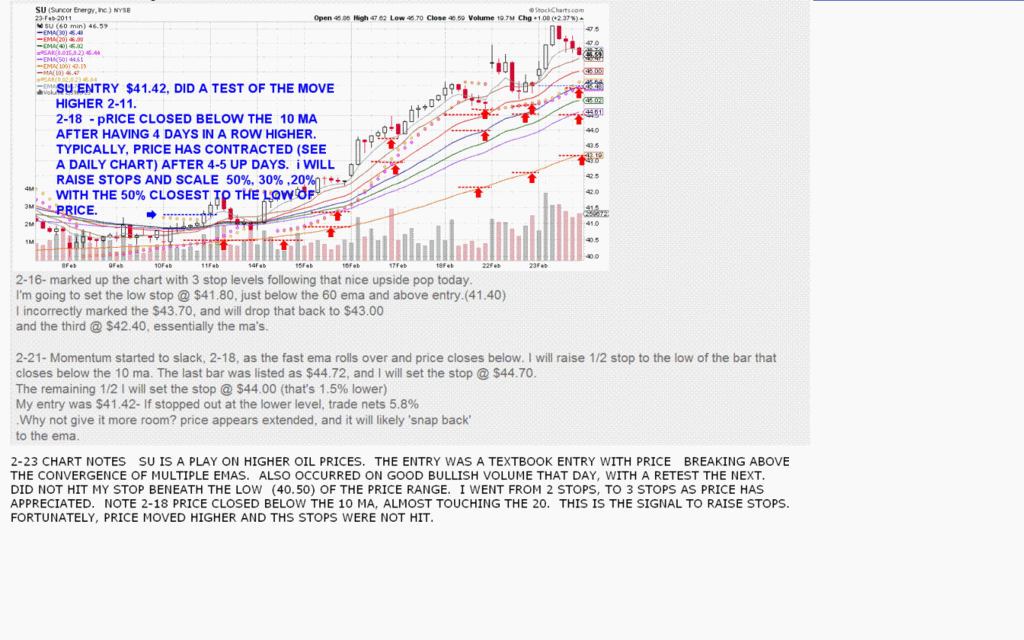
Surprisingly, What I thought would be a bunch of 3-7 day trades and sells, has turned into weeks and month+ trades.
The majority of this longevity is due to being in the right sectors- that allowed these trades to continue-=Gold, silver, and energy (oil). and taking reentry trades as parts of positions stop out.
Hope to get some correctly sized charts posted in some following posts. SD
|
|
|
|
Post by sd on Mar 4, 2011 21:12:51 GMT -5
USING THE 60 MINUTE CHART
I elected to use a 60 minute chart without any RSI, stochastic, macd typical indicators. I've put them away- However, I'm not a price action purist, in that I incorporate moving averages and also parabolic sar on the charts although I don't rigorously follow it's suggested signals. For years I tried to align the indicators with the moon and stars thinking that would ensure a better trade. Indicators actually lag price action, so their value is not necessarily in their timeliness- When I did employ them, I would usually speed up the time frame to make it closer to price action- which also increases the whipsaws.
The advantage of using a 60 minute chart is it gives one a snapshot of price action intraday- vs just a single daily bar.
Volume, and price can be looked out more closely than just the daily. It's easy to see what the price action was going into the close, at the open, and inbetween. Perhaps that can give a suggestion of what tomorrow could bring.
I employ multiple ema's-(exponential moving averages) and a single MA (smooth moving average) as points of reference-
These multiple ema lines are visually easy to see , and gives a graphic reference to compare price action with. I have a fast ema first, a slower ma next, and then various emas . One can use whatever one wants, there's no specific choice of one over the other except the faster the ema is (5 or 10) will be closer to the price action than the 30, 50, 100, 150,200 etc.
As long as price stays above the fast ema, price is uptrending. If price is below a declining fast ema, it is downtrending. If the ema's are clustered together and going sideways, price is likely in a trading range.
If one trades on the Monthly chart, you see few crossovers until a change in trend occurs. The daily offers more fluctuation, with multiple changes of trend suggested over time, although the monthly chart may say the trend remains intact.
The 60 minute chart shows many potential changes in trend as it focuses on more minute price action, even suggesting a decline in trend while the daily is saying the trend is intact., smaller time frame intervals will show this same feature- 30 minute, 15 minute, 5 minute, one minute etc.
The 60 minute chart will give faster signals- both for entry and for exit. Since I can only trade after hours, I still refer to the 60 minute chart to make a decision. The day's move is over, when I turn on the computer in the pm.
The 60 minute chart shows about 10 days worth of price action . Where the daily price may look like a relatively "smooth" upmove, the 60 minute will show daily fluctuations up and down intraday. The important thing is that price continued to move higher.
When the price fluctuations on a 60 minute chart cause price to drop below the uptrending fast emas, it is cause for concern. A short drop or intra day break of a fast ema is not a great concern, but if price breaks below multiple emas and closes below them, this is a cause of concern. This mean that momentum is waning, a possible top is being reached. If price actually rolls over and the faster ema's start to decline and price stays below, a potential reversal of trend is occurring. Just think of a rolling wave action. As price closes further below the various ema's, it illustrates it is being pushed lower as selling is occurring.
While I have multiple emas , and one can use any they think are relevant, it helps to compare the 60 emas to the counterpart on the daily.
Using trending SLW as an example, the daily 5 ema =43.43
the 60 min 30 ema= $43.45
the daily 10 ema =$41.74
the 60 min 65 ema =41.79
the daily 20 ema =39.35
the 60 min 136 = 39.35
While all the "technicals" are relative, how they are applied is up to the individual.
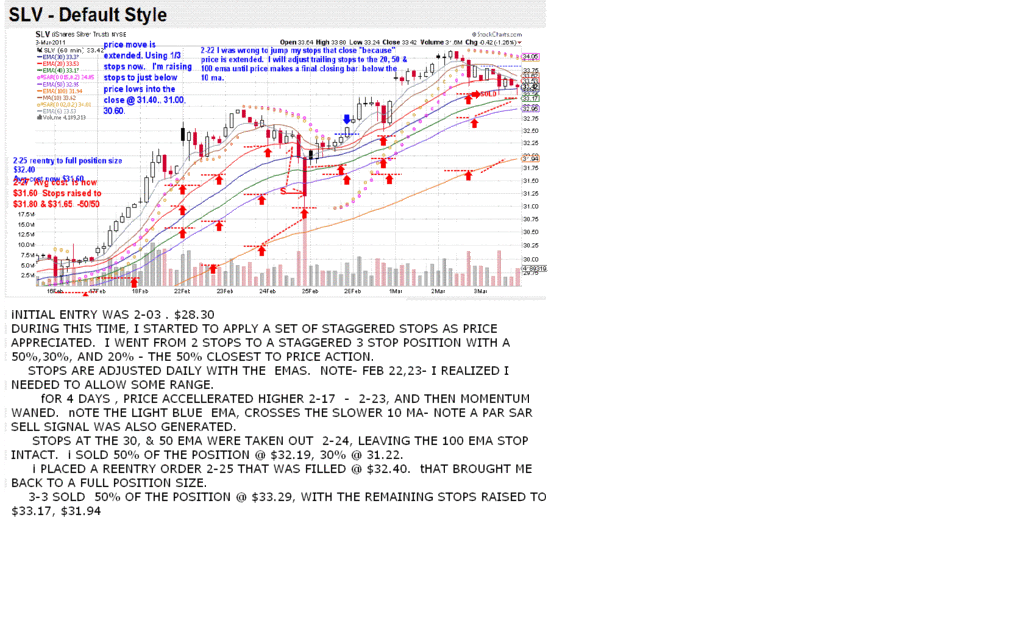
I arbitrarily elected to allow a winning trade to develop to 3 different stop levels on the 60 minute.. This occurs only after the position has developed in the direction of the trade, My initial stops are usually set at 2 levels, designed to reduce a whipsaw loss. Once price has exceeded the break-even level, stops aree adjusted further. The 1st trade stop takes 50% of the position, the second 30% , and the third 20%.
This weighting of the stops captures a large part of a momentum move higher,. There is no set procedure where the stops should be set- I have allowed stops to lag until price gives indication of weakness- usually by a penetration or close of the 30 ema. This is often the 30, 50 & 100 ema.
One criteria that occurs is a requirement to plan to reenter the trade once stopped out if price gives that indication it will move higher and resume the trend.
I hope to follow up this weekend with some charts that illustrate how this has worked out with a number of stocks.
sd
|
|
|
|
Post by sd on Mar 6, 2011 9:45:58 GMT -5
Jan 28 took a market reversal trade using EEV,GLD,VXX,BNO taken in the last hour that Friday- Market fear and unrest due to the middle east news and concerns about oil disruption etc. I was still long FCG.- 2-1 VXX and EEV stopped out as the market figured things weren't all that bad perhaps-I had used split stops on all the positions. EEV entry $34.78 -stopped @ $33.39 & $33.00- Painful! VXX entry $ 32.00 stop set @ $31.55 & $31- stops filled $31.18 & $31.09 at the open- Those 2 trades cost me $126.00 if my notes are correct. During the week, GLD, FCG, gained , BNO flat with raised stops. Bot SLV $28.34 & WY (extended) $24.30 2-07 BNO sold on the raised stop $66.25 WY sold gapping down at the open $22.75 Losses much larger than my wins; acct down to $9763.00. 2-08 Slv entry $28.34 2-09 VZ $36.60 stopped out 2-14 $35.91 2-11 SU entry $41.40 2-14- remaining positions up Acct value $ 9848. Seeing the larger losses of positions stopped out, my inability(comfort zone) to withstand these larger losses as as a requirement to get a stock that would trend higher- brought me to the point that i would be more comfortable by limiting my losses with staggered stop-losses, and also capturing some gains in a staggered manner . GLD has not been a rip roaring trade, and I felt it would likely reverse. I started off with 2 stops, and as price moved higher, went to 3 - with the first stop having a 50% weighting, the second a 30% and the third a 20% The desire is to get the stops to Break Even (BE) as soon as possible- If price stops me out and then moves higher, I can reenter. The cost of the trade $1.00 is small compared to the cost of losses, even if taken multiple times on the same position. Enough rambling- I have found that photobucket can resize the chart to a 1024- click on your photo to expand the picture, ,move your mouse over the picture and a menu appears across the top with resize one option. Some of these trades have lasted longer than this chart size allows as "live" charts on stockcharts. , So some of the annotations don't fit the time frame on the chart. I believe this approach works well in trending stocks, to capture gains if price weakens, and also requires the willingness to reenter. Once price has exceeded a certain profit level, I would potentially widen the stops or the weighting to see if it could be a longer term winner. Charts of GLD: 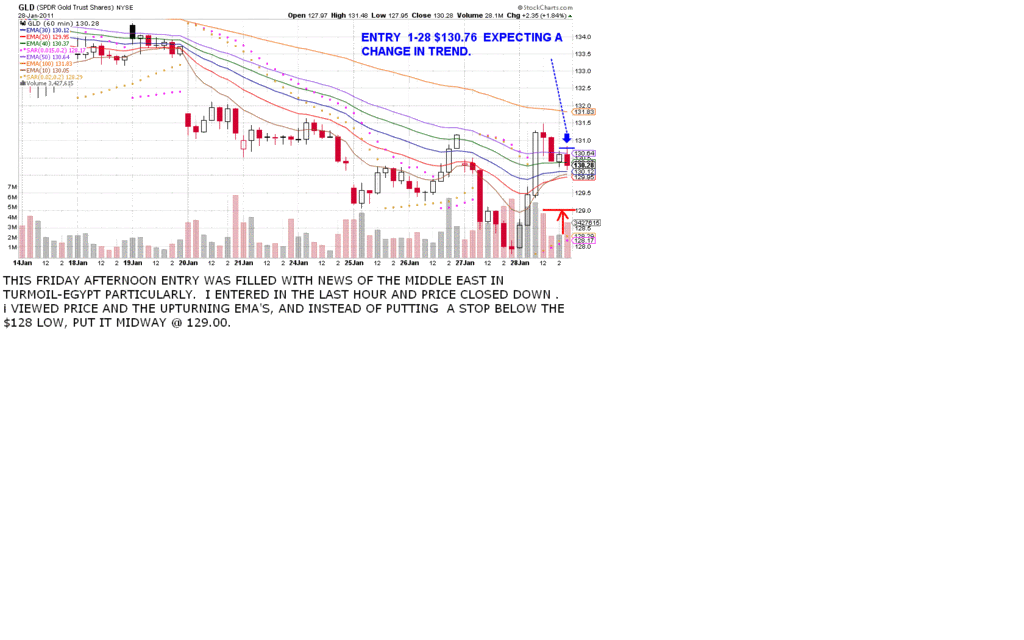 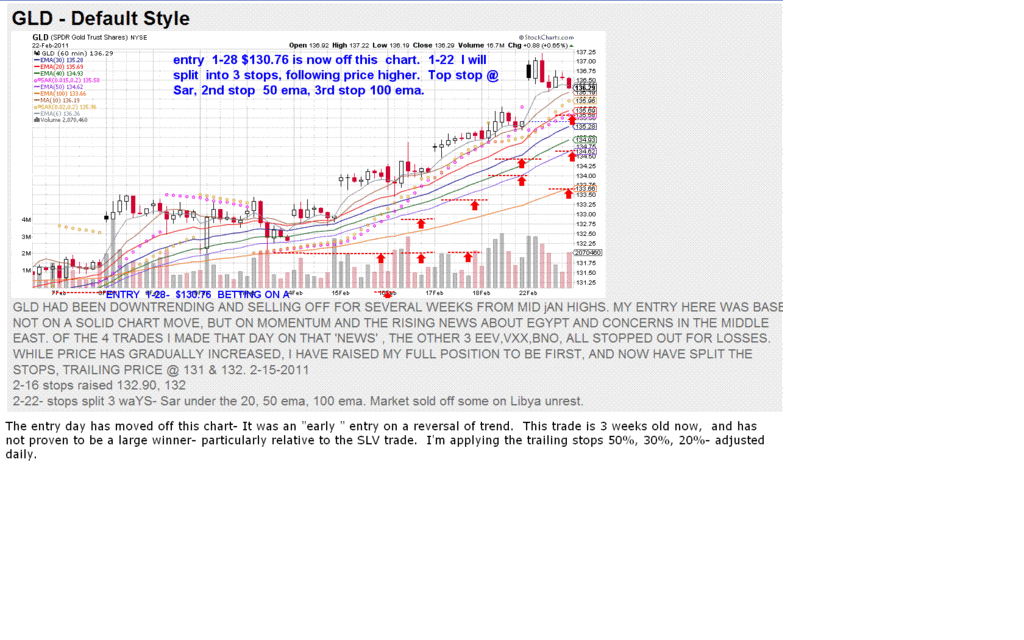 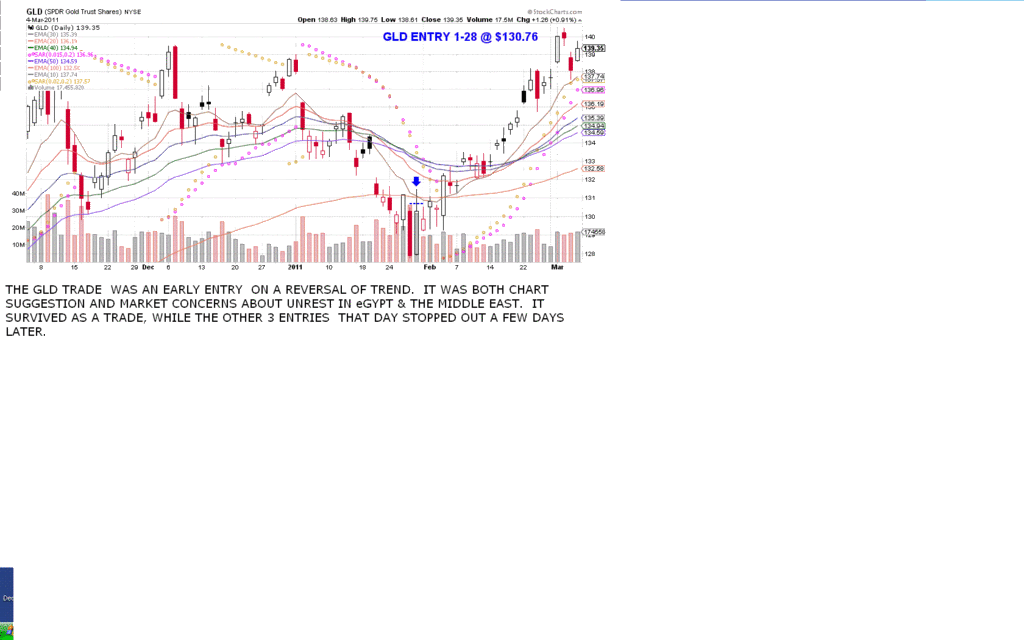 And I may choose to reenter GLD if trend suggests it goes higher. 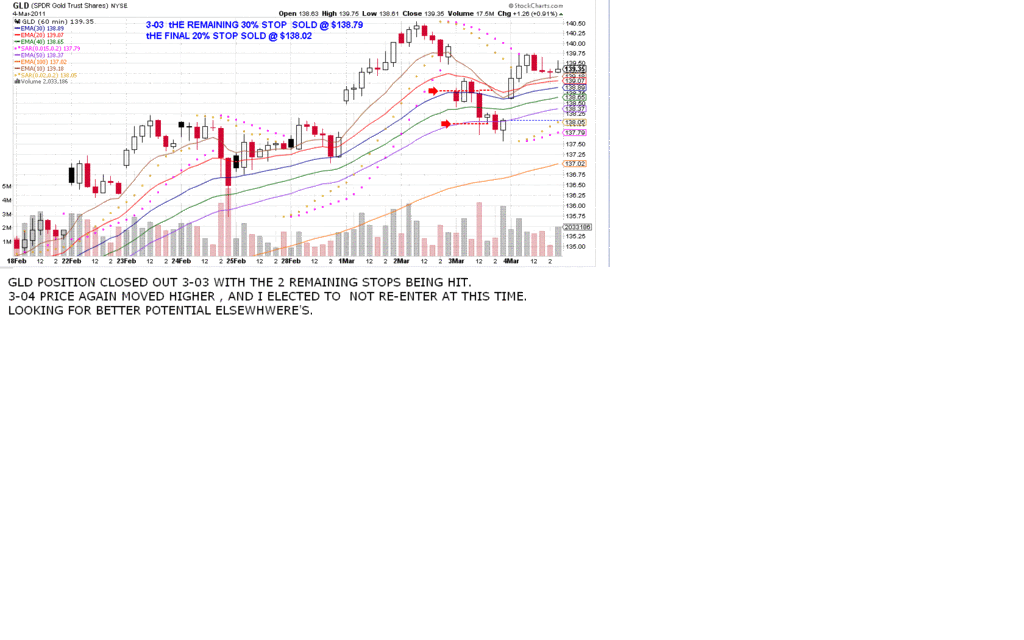 |
|
|
|
Post by sd on Mar 6, 2011 19:03:50 GMT -5
3-06 -2011 FCG - Nat gas trust - has been uptrending for months. I have held a position in this since jan 26 or 27 , and have been stopped out on portions of the trade (for gains) as price pulled back and I then reentered. My last 20% position at the 100 ema had not ever been hit- At the present time I just reentered to a full position size (75 shares) . The question will come up of course, would I not have been better off with the wider stop for the entire position- Likely so over the long term- however, one never knows when the trend will end. As I followed price with staggered stops and reentry, I did capture a nice profit and then reentry - with the reentry lower than the stop.... This won't usually be the case monitoring the trades after hours- but it does limit the potential downside. I've been pleasantly surprised to have been able to keep a position open this length of time- The reentry aspect of this type of approach with limited downside Risk can be used as long as the trend is intact on the daily. If energy concerns are abated, this trade will head South-SD 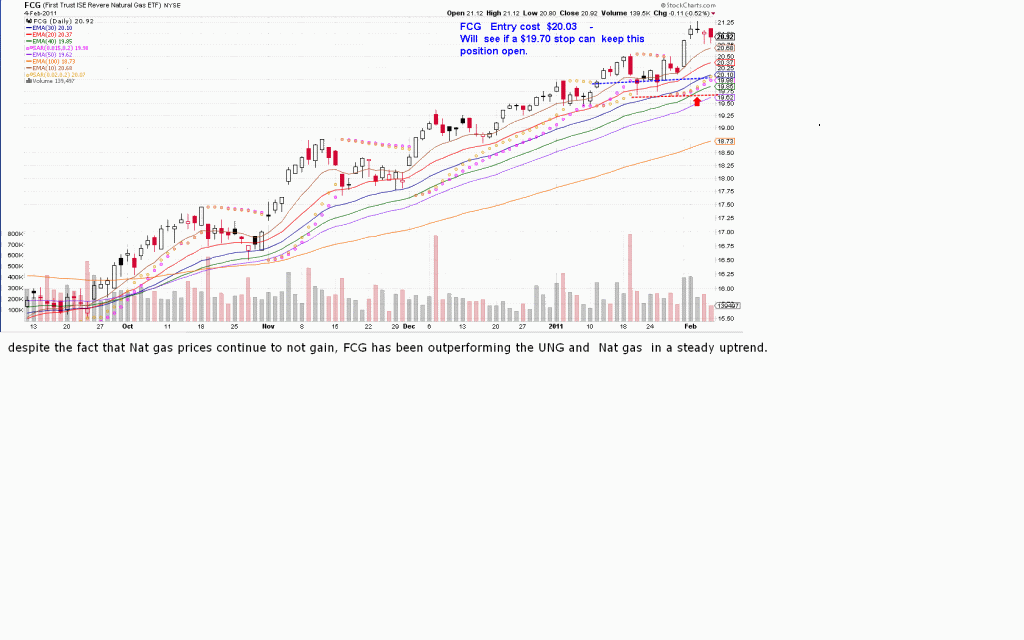 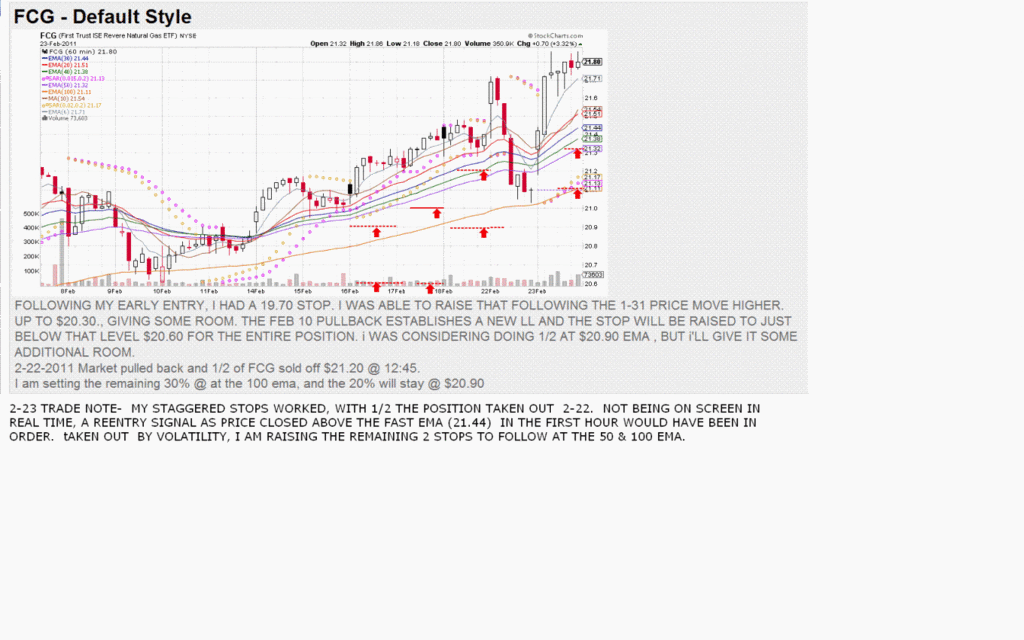 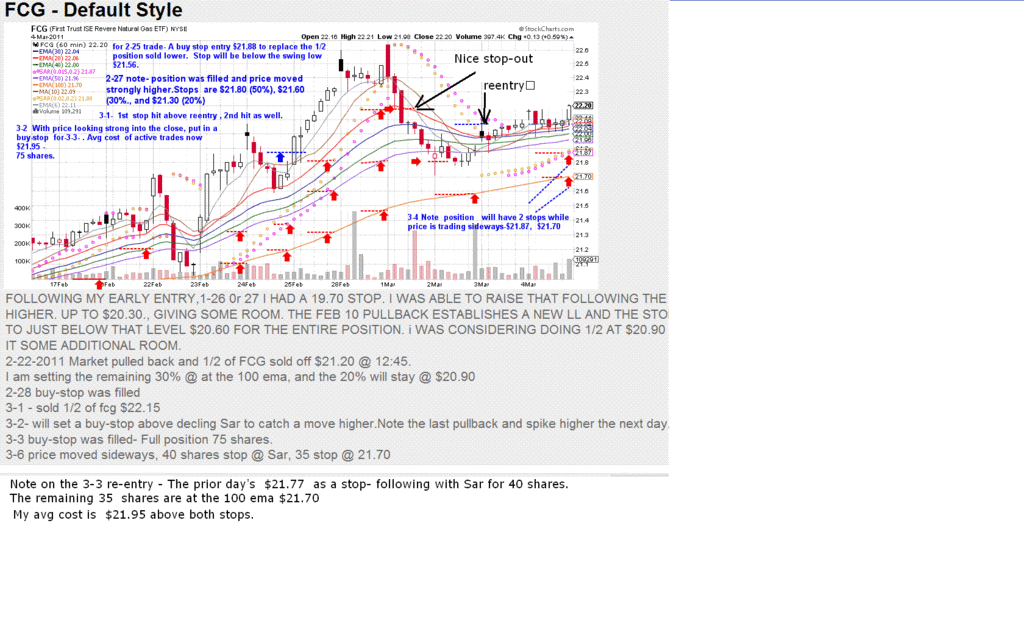 |
|
|
|
Post by sd on Mar 6, 2011 19:23:26 GMT -5
Thursday the market put in a Rally, and I was stopped out on both remaining stop levels on GLD, sold a portion of SU, and sold 1/2 of the SLV position.
Friday 3-04-2011 again the market pendulum swung -
Bought back the 25 SLV,
Refilled FCG to a full position with 65 added shares,
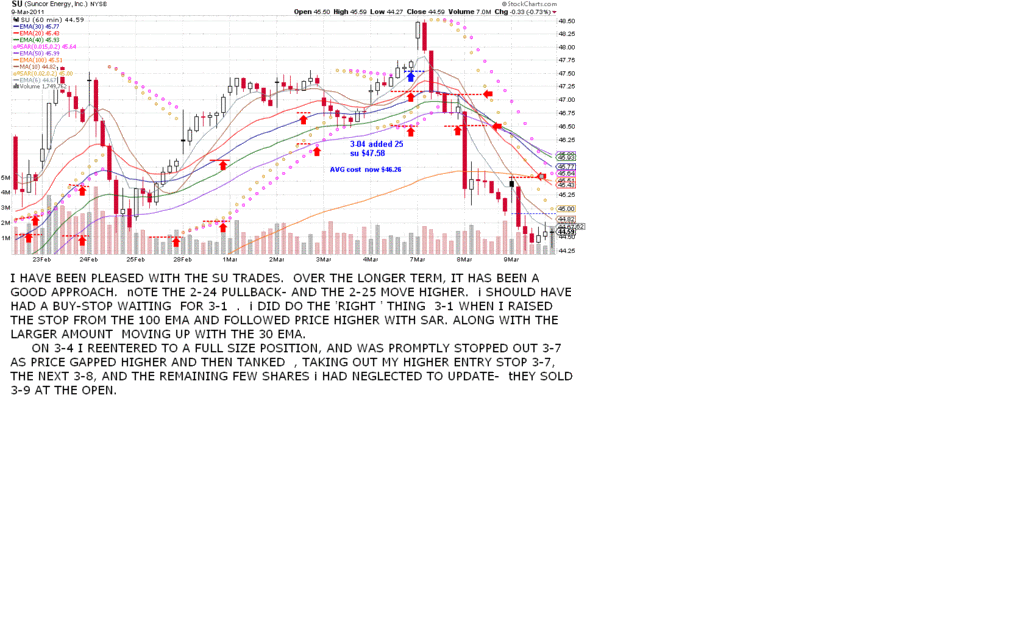
Refilled the SU trade with an additional 25 shares
Added 2 new trades-
30 SLW (silver Wheaton)
30 CNG
|
|
|
|
Post by sd on Mar 8, 2011 22:10:59 GMT -5
Monday 3-07 Both CNQ and SLW sold off and hit stops. 1st stop hit on FCG $21.87 taking out 40 shares.
SLV looked weak, topping here, hitting $1 above my reentry portion, but closing down after gapping up at the open. raised stops again as it appeared momentum , and SU- Saudi Arabia is reassuring they can make up the needed output in OIL and talk by the gov't that the strategic reserves may be tapped .
These forces at work are all interpreted by the market to calm fears and make one think things aren't that bad after all.
Tues 3-08 Market rallied, sold the remaining FCG $21.70
and the majority of the remaining SU $46.50
SU- oversight Only have a few hundred dollars (7 shares) remain - I apparently overlooked these and should have had a stop at the 100 ema or $45.60. This pm I see SU last pm trade is $47.20 and I raised my stop to $46.80 - believing the upmove is over.
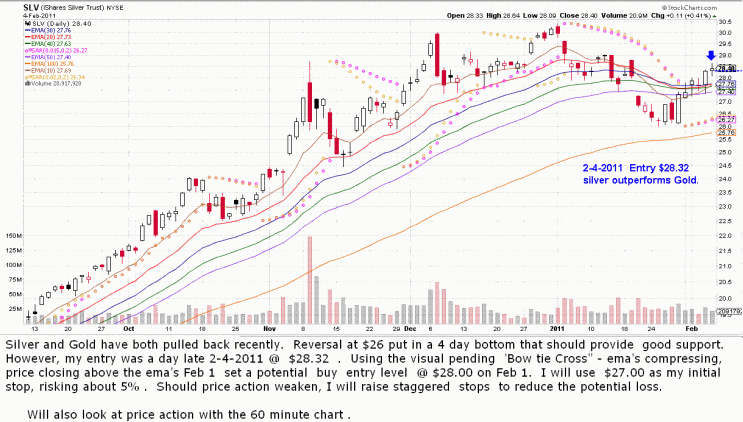
The SLV position. SLV has been a much larger winner compared to Gld, both trade as flights to safety type of plays, with silver having an industrial component as well. Silver has outperformed GLD substantially in recent months, and they seem to trade more or less congruently of late.
Friday I had repurchased the 1/2 position that had sold for a gain previously stopping out. I am now at a full position again,
and the issue is that GLD topped on March 2, and SLV has continued to move up this past week.
This is a divergence in what I interpret to be similar defensive trends, and I feel that GLD has indicated it had likely reached a peak, and I expect SLV is not far behind. Until Price actually breaks down, that will not be realized, but I think it's best to be aggressive with the stops.
Again we trade our "beliefs" about the market, and I believe we are entering a period of transition- volatility- where it will be difficult to see a long established trend develop. The market usually proves me wrong in my interpretation of what "will happen".
I'll try to follow with some charts later this week- SD
|
|
|
|
Post by bankedout on Mar 9, 2011 9:50:09 GMT -5
It is nice to have a readable thread finally! That side to side scrolling was a killer. It is fun to follow your progress and see your thought process in action.
|
|
|
|
Post by sd on Mar 9, 2011 19:08:28 GMT -5
Thank You, Bankedout. Please feel free to comment at any time, because this is a tenative work in progress I'm sharing- Success not guaranteed for a number of factors. I'm glad the thread is properly sized to fit on your screen page. I've taken a screenshot of what I see when I view this thread, and the printed word section is 2x as wide as the 1024 resized chart on my monitor. If the chart could be enlarged without pushing the printed words wide, I would certainly be glad to do that. If it's readable as is, that's the purpose of the thread, and I wouldn't want to jeapordize one post to cause everything to go wide scrolling again. SD 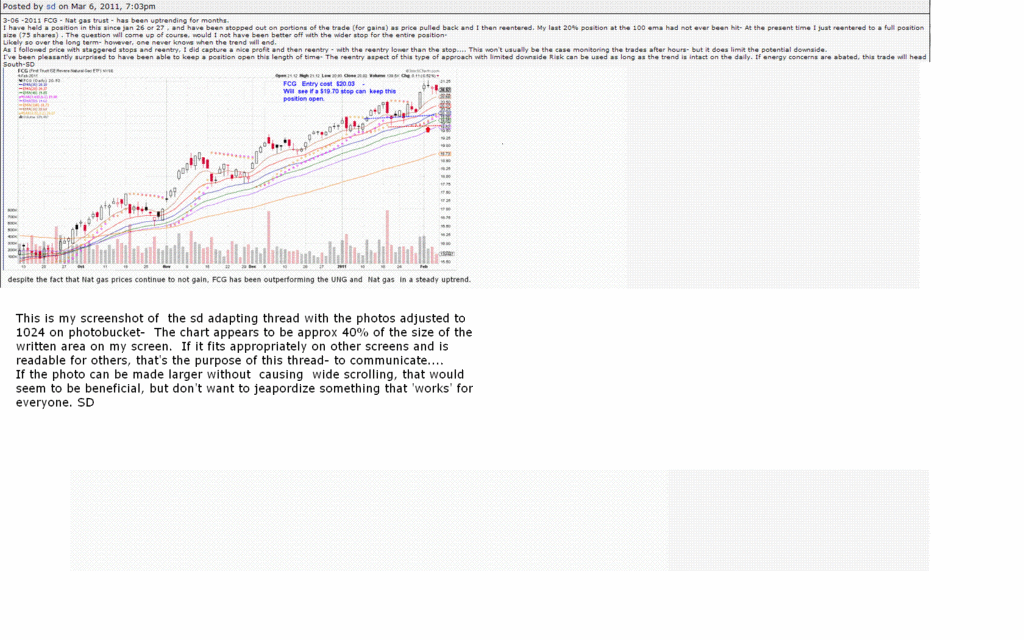 |
|
|
|
Post by sd on Mar 9, 2011 20:41:04 GMT -5
|
|
|
|
Post by bankedout on Mar 10, 2011 9:59:43 GMT -5
I like the idea of using a wide variety of moving averages on the chart. You can select a shorter period when price is extended and you want to lock in a gain. A longer period when you think more wiggle room will be beneficial. Dividing the position up in to parts helps you to see which works better for each particular trade. I think you will learn a lot from that in a shorter period of time. You could also analyze the industry group using the same time period chart with the same moving averages to see if the whole category is exhibiting the same characteristics as your stock at the moment.
|
|
|
|
Post by sd on Mar 10, 2011 19:08:16 GMT -5
Posted by bankedout on Today at 9:59am
I like the idea of using a wide variety of moving averages on the chart. You can select a shorter period when price is extended and you want to lock in a gain. A longer period when you think more wiggle room will be beneficial. Dividing the position up in to parts helps you to see which works better for each particular trade. I think you will learn a lot from that in a shorter period of time. You could also analyze the industry group using the same time period chart with the same moving averages to see if the whole category is exhibiting the same characteristics as your stock at the moment.
I agree - the use of multiple ema's or ma's can be beneficial for following price action on any time frame. And I employ stops on different levels pretty much as you describe- the tight ema locks in some profits (usually 50% of the position) , and then the remaining 1 or 2 stops can be distributed at wider ema's as desired.
I was actually very surprised at how long some of my recent trades continued prior to getting the first stop-out.
As you mentioned, checking the individual stock vs the sector is a wise idea- if the sector is also bullish, it adds credence to expect an uptrend to continue.
The other 'advantage' of this 60 minute view, is that it causes me to set tighter stops based on my expectation that price should be moving higher. losses (stops) are generally smaller,
which also allows me to be willing to take a reentry in the same trade a day or two later if i choose.
Referring to the past month + there were a few whipsaws where some stops were hit, but generally not all the same day, and price moved up- I failed several times to place the reentry - buy order- at the first signal-
In retrospect, I finally had aligned myself with the market with my positions reflecting the sentiments of the market-For that relatively short window- I don't have any misconceptions that I needed to stay in the trades for the longer term- i stayed with them as long as price told me to do so, based on the price action.
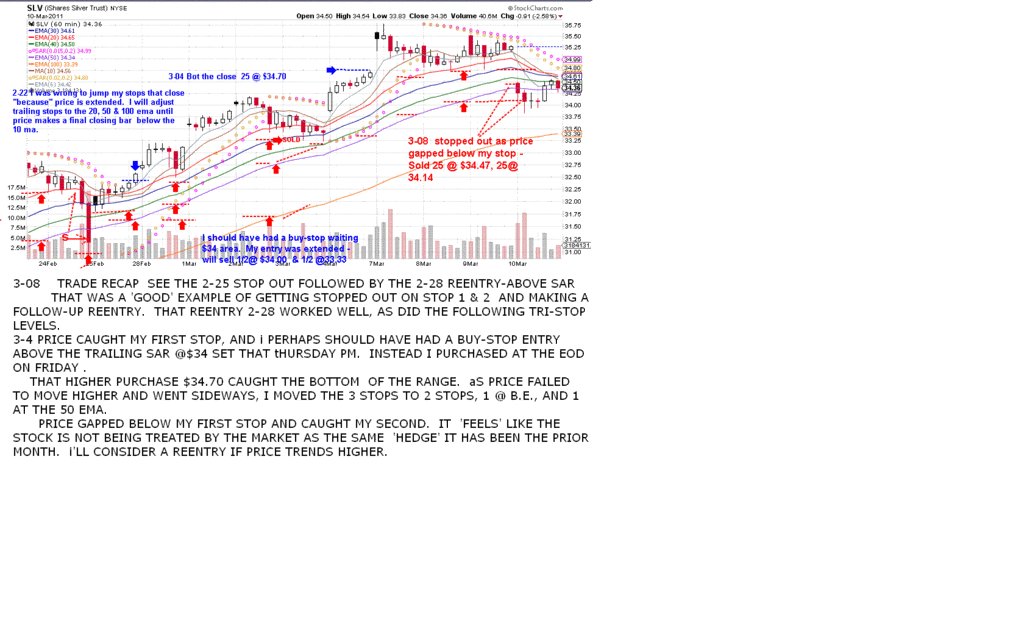
I actually had my remaining SLV position stop out today.
I was somewhat surprised, because GLD and SLV were both down, and have been gaining when the market had "worries" previously. I am now totally back to cash , with a modest net gain for the past month locked in-
Now if I can only not give this back on future entries!
Thanks for the input ! SD
|
|
|
|
Post by sd on Mar 10, 2011 20:02:56 GMT -5
|
|


