|
|
Post by sd on Jan 5, 2009 23:02:00 GMT -5
Jan -5 trades
Well, I had nothing but trouble with the first trade I tried to enter Sunday Pm on IB- The trade went to the standard 100 share pricing , and I was unable to adjust it easily on the trading platform. I spent over an hour trying to send e-mails to IB telling them I did not want to take a 100 share position, and eventually I had to make adjustments in the order area, and it went through and I was able to eliminate the order- It's seldom I have a problem with IB orders, and this got me very concerned so I did not attempt to add any additional orders.
i had hoped to employ some buy-stop entries with a trailng stop-;loss as a basis for an entry approach when I could not monitor.
to be candid, I wasn't able to put any of these orders in yesterday pm when I found a problem Sunday night- and it took forever to cancel the incorrect order and several reboots.I didn't place the orders I expected- was happy to get the one cancelled
I also could not access any 800 phone support- was left with a after hours message,
Long story short- The market had been uptrending- You have to look at the 15 minute chart to understand this trend-
I somewhat expected a pullback or lack of trend continuation-
My work didn't allow me to take a look until 1 pm or so,
and then I watched price in real -time- I set buy-stop for both QLD, and SSO , , and both of these trades got filled eventually-
I watched price move up 4% , and then some sell bars started to show- but I had to leave- I determined that I didn't care for the price action, and set the stop just above the entry price- off at my entry cost for anet 0 loss - but I could have locked in a 3% gain had I taken action.
Results are what they are-=There's always anotherday and anothertrade. Just keep those losses low!SD
|
|
|
|
Post by sd on Jan 7, 2009 21:31:45 GMT -5
Today is Wed -Jan 7- no time today-
Previously I had speculated on a what-if - using buy-stop entries with trailing stops- and I didn't try any of those trades- Issues with my orders. Of those buy stops- 2 would have been filled and one was not touched. Of the 2 that would have been filled, both moved higher and closed without hitting the trailing stops-I'm posting 2 charts as the example-
I did take one actual trade with SSO - not the buy-stop/trailing stop. As it would be, If I had taken and held those first trades, as a daily hold for a few days, they would have been stopped out today- (WED) when the market gave back 3%. The actual SSO trade was made thinking I would catch a move to the upside -
The trade indeed started that way, -I wanted to try to get an earlier entry-, looking at candlesticks, price action, and trying to step in just as price starts to make a move up higher- This will increase profits if the trade has legs- and will get stopped out m,ore often than waiting for a more proven entry.
Price moved up for a few bars and then started to roll over and I raised the stop to only take a minimal loss, but still left it below the slow ema- and it got taken out. In this case, I was fortunate , as price moved lower.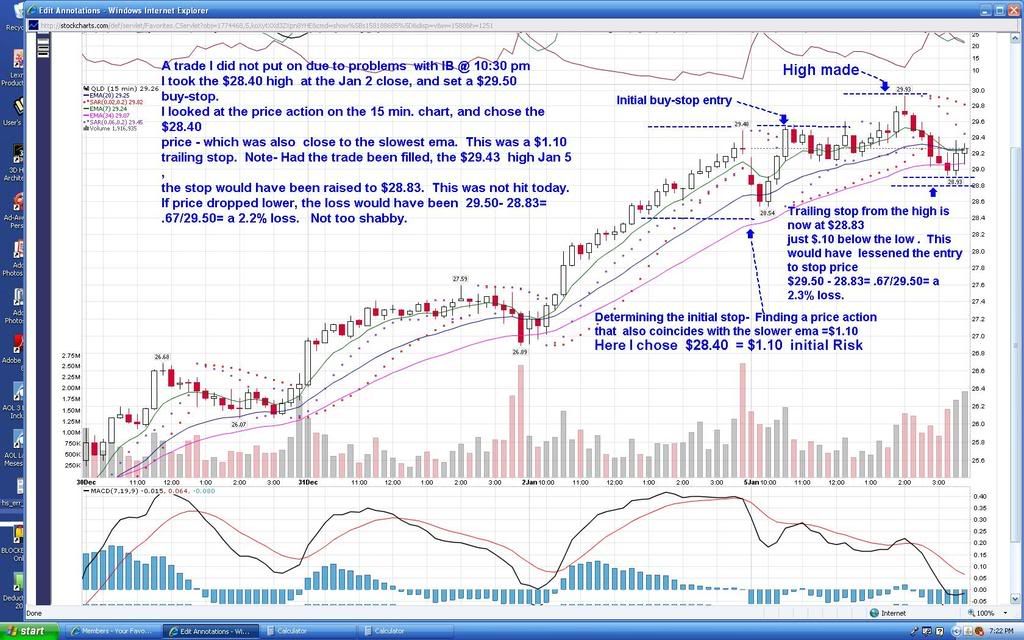 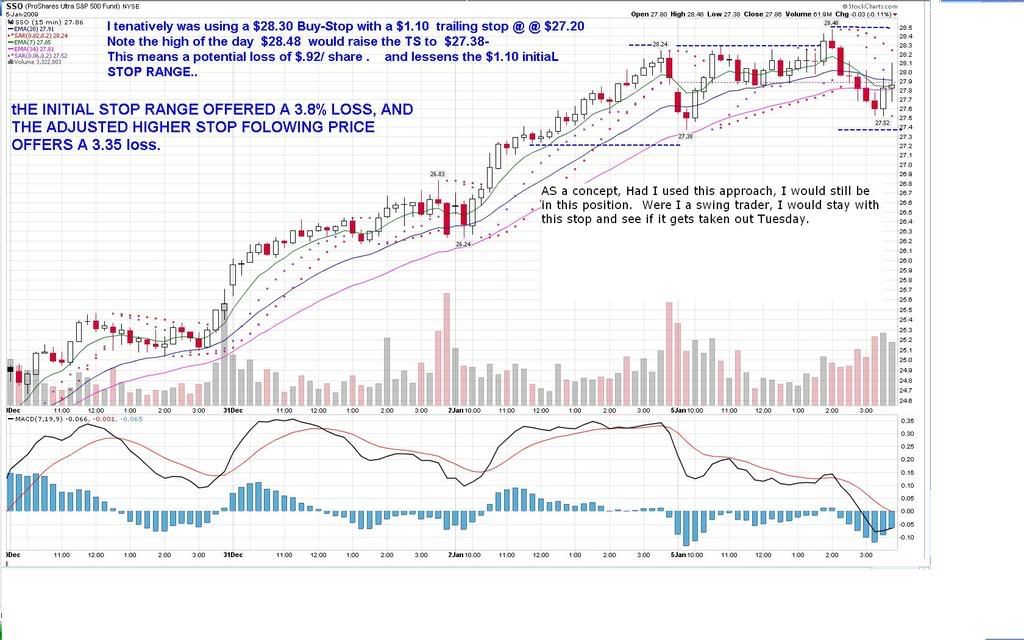 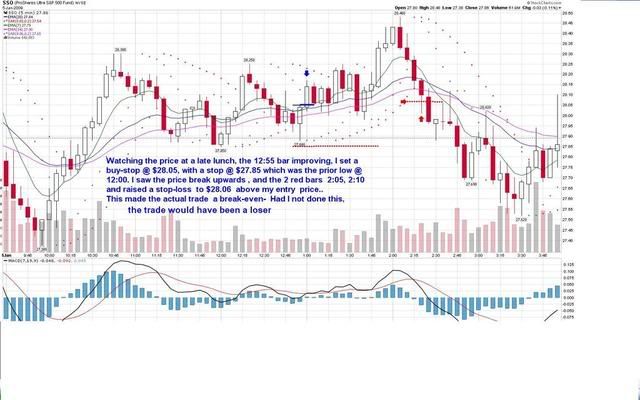
|
|
|
|
Post by sd on Jan 7, 2009 21:55:34 GMT -5
Tuesday was one of those days you just don't want to repeat. My timing was off on each entry I made, and I tried 4 times- 3x to catch a swing up with QLD, and then as that failed I snapped up the reverse trade-QID -which shorts-
The process of saving these charts and annotating them also gives me time to analyze what I did right or wrong, and to try to get an idea of how I can improve my approach in the future.
In a narrow range market, I'm trying to squeeze profits on the undulations of price. I wasn't there to catch the substantial earlier moves...I'm paying tuition here. If I would have moved my stop up even higher on all the trades on signs of weakness, I would have lessened the losses evben more than I did. I gave some leeway, hoping for a bigger move to follow. The losses were not big per se, but they could have been even less on signs of weakness.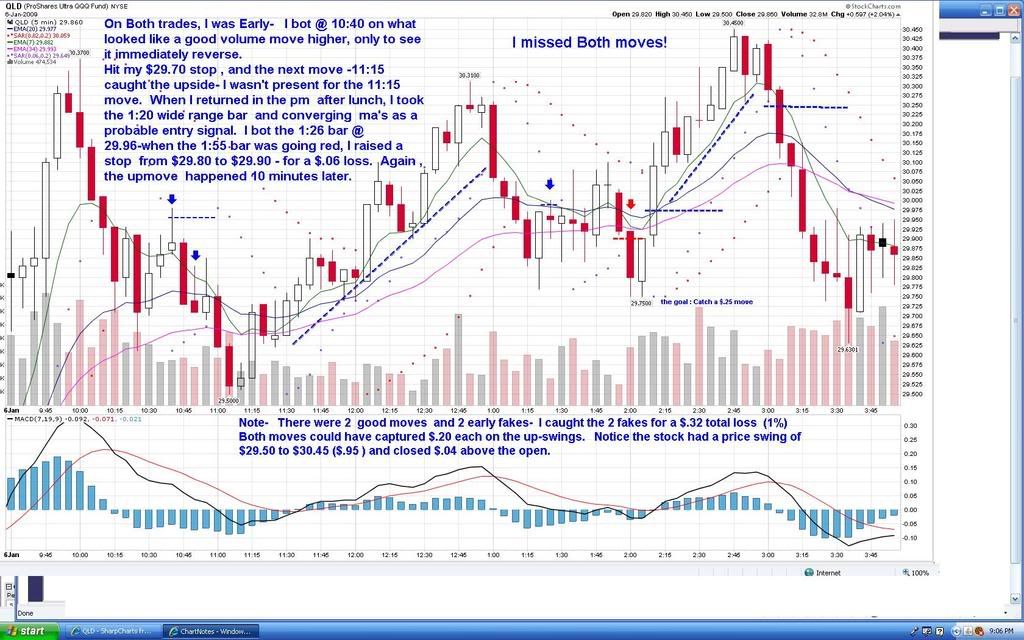 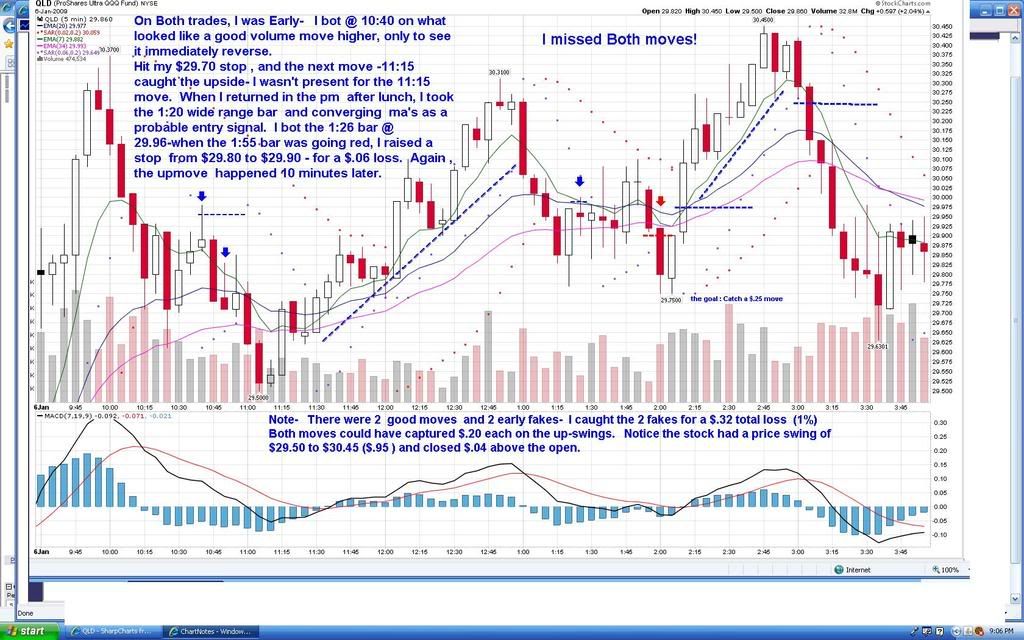 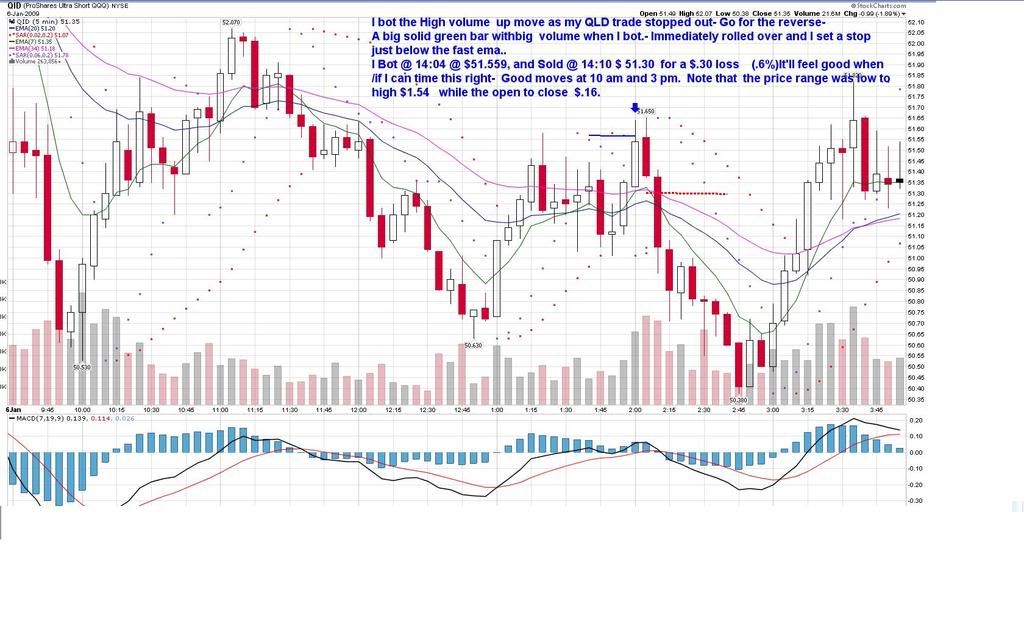
|
|
|
|
Post by sd on Jan 7, 2009 22:14:06 GMT -5
Wed- 10 pm -Market sold off 3% today- They claim the market looks ahead 6 months- So what's the surprise in some bad economic projections? S&P @ 600?
No time for the market today, and quite likely the rest of the week, and perhaps more.
Thinking back on the 4 past trades where the next upswing was the one I wish I had caught instead of the one I chose.
I need to review how I can improve my timing and if I can get a better read from Price, volume and the macd-
I don't want to wait for a macd cross, but perhaps closer-
Of course, one approach may work ok in a consolidating market, and fail in a sharp trend reversal- Stuff to think on-SD
|
|
|
|
Post by dg on Jan 8, 2009 10:59:36 GMT -5
sd:
Some folks use the MACD histogram instead of the crossing lines to signal trade times that are earlier. For that strategy, enter long one or two bars after nadir and exit one or two bars after peak (or before with other signals or requirements).
If using this strategy, I suggest that you use previous MACD histogram history of the stock you are considering trading to suggest exactly where on the histogram to enter and exit. I tend to prefer entering after 2/3 retrace from nadir and exiting at the first sign of trouble. BTW, I abandon the trade (long) if a negative bar goes deeper than its predecessor.
|
|
|
|
Post by sd on Jan 11, 2009 20:42:56 GMT -5
I rely on the MACD histogram as my one indicator of choice for timing entries, along with price and multiple ema's. I don't wait for the cross, - but in trending markets that would likely improve whipsaws.
At one time I tried to get multiple indicators in alignment, all the ducks in a row, and that only worked in strongly trending markets and gave a late entry to boot.
By the Nadir I believe you mean the largest histogram bar, with the next bar becoming smaller towards the 0 line. I'm trying to learn to get earlier entries, without numerous whipsaws. I definitely wait past the Nadir, and I recognize that as a signal that the present trend is likely to change. As a general rule, I think a declining histogram in an upmove is a great reason to set a stop directly beneath the low of the prior day and follow it up. I also try to pay attention to the divergences that the histogram demonstrates that may not be evident in price action. Thanks for the in-put.
i don't know if there will be time available this week - I tend to expect the worst- I would like to be able to develop a full-time approach to the market and see if it would work - However, I've got limited free time intraday to get a fair assessment. Due to my work situation, I should likely think about trying to apply an overnight strategy with a slightly longer time frame than one day, but I'm not willing to lose the control the real-time trading provides-
I digress- I think applying as few indicators and oscillators and focusing on price and trend will improve the trading. The macd histogram is well worth further study as a backbone indicator-SD
|
|
|
|
Post by dg on Jan 12, 2009 11:20:39 GMT -5
nadir -- largest negative histogram bar
|
|
|
|
Post by sd on Jan 13, 2009 19:26:53 GMT -5
My favored trading vehicles are the leveraged ETF's. I use them on daily trades- Here's a link to an article by Oberman that suggests that these leveraged ETF's d0 not perform 2x the underlying instrument over time. www.thestreet.com/story/10457663/1/oberg-the-perils-of-the-proshares-ultrashorts.html It would seem logical that these leveraged ETF's would simply do as they claim- but the article illustrates that over time they underperform. |
|
|
|
Post by bankedout on Jan 13, 2009 20:23:41 GMT -5
I always thought the short ETFs charts looked very strange.
One that does track pretty well is DTO which is a double short on crude oil. It seems to move in a logical way over time.
Thanks for bringing the article to my attention.
|
|
|
|
Post by sd on Jan 14, 2009 20:14:50 GMT -5
I think they may work on a daily basis- I will still continue to use them as a short term-trrading vehicle, but will compare them to their 1:1 counterparts.
On a second note- I had recently put some money back into the markets in my primary 401K. The weekly uptrend in those funds has broken down and started to decline.
I am now going back to 98% cash.
I'm not sure where i got this from- but "we trade our beliefs about the market" and not the market itself echoes in my mind every time I 'think' I can forsee where the market 'should'go.
My expectations were that there would be some enthusiasm for the new President elect, and the potential for the new policies, and that would be translated into a short term bear market rally- I hope we haven't had it yet.
This week's price action suggests that the market is finding excuses to sell-off - The market knew this quarter would be bad, and possibly the next even worse. Or was this not priced in?
Doesn't matter, I've got a breakdown on the weekly charts price action of the funds, and a good bit of downside to retest the lows- Not worth "believing" a bottom is in- I haven't had any time to follow market action this week in real time, but feel it's prudent to step back to the side lines at this point in my long-term holdings. Again, I'm acting on a "belief" that there is greater downside potential than upside.SD
|
|
|
|
Post by bankedout on Jan 16, 2009 15:40:41 GMT -5
I did some research to try and determine why certain leveraged and/or short ETFs track better than others over time. One key difference I found is that the Proshares ETFs www.proshares.com/are designed to track the day to day performance of the index. While the Deutsche Bank ETNs dbfunds.db.com/Notes/index.aspxare designed to track the month to month performance of the index. This helps to explain why some work better over the long term. I also found it interesting that it is possible for an ETN to reach the value of Zero, even when the index has not. Now I have to re-think which products I am willing to use for longer term strategies. |
|
|
|
Post by dg on Jan 16, 2009 16:45:43 GMT -5
bankedout:
Good observation. Sounds like these super multiplied ETFs work like margined investments. If the multiplyer is 3, a 33.33% drop in index price would result in a total wipeout of one's investment. Definitely something to keep in mind.
|
|
|
|
Post by bankedout on Jan 16, 2009 17:13:30 GMT -5
dg,
Unfortunately these products do not trade like margined investments over time.
With a margined trade your results are based on the price where you entered versus the price where you exit the trade. Whatever happens to price in between those points in time does not effect your results.
With these leveraged products, that is not necessarily true. Sometimes you can have vastly different results than what you would expect. Besides your entry and exit price, the price action between the time when you entered and exited effects your results. It is entirely possible to be very right about price direction, trade correctly, and lose money. Which would be extremely frustrating.
|
|
|
|
Post by dg on Jan 16, 2009 19:53:04 GMT -5
bankedout:  I guess I really don't understand how one's result can differ from the net difference on entry and exit price of the ETF. How can this be? Please explain. |
|
|
|
Post by bankedout on Jan 16, 2009 21:08:38 GMT -5
|
|


 I guess I really don't understand how one's result can differ from the net difference on entry and exit price of the ETF. How can this be? Please explain.