|
|
Post by bankedout on Jan 16, 2009 21:28:20 GMT -5
A good example to make you scratch your head in wonder.
Compare the charts of EEM (emerging markets ETF) and EEV (double short emerging markets ETF) Look at the trading history for the last 6-9 months.
|
|
|
|
Post by sd on Jan 18, 2009 19:49:30 GMT -5
I'm very surprised by the results-Great example
I actually had to simplify the comparisom by going to the weekly charts, and compared the Jan-08 price with the present close.
There doesn't seem to be any relation between the prices over the long term. I don't understand how a 2x short (EEV) with the underlying EEM can be so out of balance.
The EEM Price Jan-08 was 47.00 Closing price $23.25 about a 50% loss.
You would expect that a EEV would be a 100% winner -if it's a 2:1 short.
The reality is that EEV in -08 was 75.00, and closed @ 58.41. essentially a 21% loss.
This should have been a 100% winner.
If this is typical of the leveraged funds over time, there would seem to be a great disparity in the expected results. I don't understand why the daily rebalancing of the funds would produce such results , but it certainly is something to be aware of..Good example- SD
|
|
|
|
Post by sd on Jan 20, 2009 18:28:26 GMT -5
|
|
|
|
Post by bankedout on Jan 20, 2009 19:43:01 GMT -5
I think we might be able to use the Deutsche Bank ETNs: dbfunds.db.com/Notes/index.aspxFor longer holding periods since they are based on month to month performance. However they are commodity focused, so a bit limited in scope. |
|
|
|
Post by sd on Jan 21, 2009 19:27:57 GMT -5
Reply to post 89: dg,
You can get an idea from the following link:
dbfunds.db.com/Notes/Pdfs/DB_Notes_Gold_Offerings.pdf
Read pages 13-17
Also you can view the following link:
www.direxionshares.com/pdfs/Compounding_Article_ETFs.pdf
Maybe we should move this discussion to a new thread. I don't know how appropriate it is in sd's trading journal thread.
The hypothetical scenarios did play out in some of the ETFs and ETNs over the last 6-9 months. I don't mind or care if discussions occur in this thread, and actually prefer to encourage discussion and engage others. but I think Bankedout is correct in having a separate thread focused on the discussion of ETFs- These will become even more popular as investment and trading vehicles in the future- Present and future members might prefer to find more specific access to the subject of ETF's on it's own thread, instead of buried in this one- Again, I don't mind any discussions within this thread; but I think a general discussion of ETF's should warrant their own thread.- I plan to continue to trade primarily ETF's -1x as well as leveraged , mostly with an eye to short-term , until we see a market that can trend for more than 3 or 4 days. I hope I can get my nose above water work-wise in the days/ weeks ahead , and try to continue to develop a trading system, and to share it here. I presently am engaged full-time with a bureaucratic inspections entity that continues to pull new rules and regulations out of it's respective backside, without being able to provide me a finite specific list of regulations. This is an ongoing process of discovery, and it is beyond my past experience . Almost daily there is a new moving target, or new found interpretations of what should be very specific codes. AHHHH, there's a sip of the Contractor's Wine (Whine). I prefer the trading challenge-SD |
|
|
|
Post by dg on Jan 22, 2009 10:20:29 GMT -5
sd:
"I presently am engaged full-time with a bureaucratic inspections entity that continues to pull new rules and regulations out of it's respective backside, without being able to provide me a finite specific list of regulations. This is an ongoing process of discovery, and it is beyond my past experience . Almost daily there is a new moving target, or new found interpretations of what should be very specific codes.
AHHHH, there's a sip of the Contractor's Wine (Whine)."
Interestingly I just watched a show on tv last night depicting what happened to past comedians like lenny bruce and the smothers brothers when constantly battling the censors of their shows. A constant complaint was that the censors would never tell them in advance what they couldn't say; but once the act was developed the censors would come in and say: "you can't say that!" After a while, many comedians spent time in jail and lost their shows. Free speech in the USA is a joke. (even here on the website we must avoid discussing certain "adult" topics or risk losing the website; and although I don't particularly mind having such talk avoided in general, I do mind being told that I am not permitted to have it at all).
|
|
|
|
Post by sd on Feb 3, 2009 21:59:14 GMT -5
It's taken a while, but I now think I've got some breathing room to try to apply some short-term trading approaches. Monday , I took a long position in UGL @ $33.25- which means I'm not selling it off at the end of the day. This is a leveraged play on Gold, and underlying this trade is my belief that Gold will be a beneficiary of the fiscal policies that we see in our monetary decline- I agree with Blygh- By Long term, however, I only intend to hold as long as price doesn't retrace to where it would hit a swing trade stop-loss. I have no desire to allow my personal woulda-coulda-shoulda to result in a 30% loss just to be proved right.
It was later this afternoon that I found time to check the market- A look at stockchart's market summary page showed the financials heavily in the red- I decided to go with the financials, but using FAZ which is a favorite of day-traders. It is a 3x play on the financials short, while FAS is a 3x play on the financials long.
The stock had trended up in the am, about 8%; and was basing over lunch ,started to decline , then gave signs of trying to rally higher - I took the attempted return to the am trend as likely to happen, and I was wrong. Not just once, but twice.
In my first trade, 1:35 pm entry @ 54.29 stopped out 2:11 @ 52.62. I hit the high of the price move , expecting this was a sign that the prior uptrend would continue. Price was rolling over , and I caught the peak of the up move. I hope other traders can relate....
As price declined, I felt assured that this was a temporary pullback . I took time to watch the 15 minute chart along with the 5 minute chart, and took a long position when both histograms indicated price reversal to the upside.
i ENTERED @ $53.19 @ 2:55 PM, AND SOLD $52.51 @ 3:09 PM.
I looked to the improving histograms on both the 15 minute and 5 minute charts to provide the basis for entry.
Whilethese 2 trades did not prove successful, i would like to apply this same approach for the entire day from open to close for several weeks ./ I believe the opportunity is there to capture profits within a trading range-SD
|
|
|
|
Post by sd on Feb 9, 2009 21:41:36 GMT -5
I had made 2 successful trades Thursday long FAS,- for a net 7% , and could not witness Friday's rally.
I tried a TNA trade today -buy-stop entry with a trailing stop -I had a tight entry to the prior intraday price and was filled by $.03 . My notes had to take a $28.20 buy-stop, but I must have used $28.10. I was stopped out with a $1 trailing stop.. This is a 3.5% loss. I tried this approach because I don't have the luxury of the free time to apply and monitor short term intraday trading most days.
I'm on vacation the rest of the week, but instead of using that time wrapped up in the computor, I'm going to try some swing trades. My belief is that we should see a short term rally , and so as I look at the various charts, I'm allowing my 'belief' to encourage me in this direction.
I stress short-term here, because I'm basically bearish, but think there should be a rally here as the new plan should be announced and Geithner should speak tomorrow- And if the markets don't like the message, stocks should not go up. The markets looking for a positive answer. I'll be using Buy-stop entries on allk positions- instead of applying the daily highs, I'll be using the 15 minute charts to narrow the field./
We trade our "beliefs" ; my short term belief is that there are potential upsides that a positive market reaction could bring about.
FXI- recent swing up- BS 14.50 stop-loss 13.70
UYM -Basic materials- focus on both growth in China and infrastructure- Price looks tepid on the 15 min chart, but I'm setting a buy-stop higher @ 14.50 with a stop $13.70.
QLD- 2 days upside and basing today- Buy-stop $30.15 and stop @ 29.00.
URE- This is a Long real estate- Oddly enough, this chart shows the same 3 day upside as the others, but finished higher than all the rest.
Using a Buy-stop with a limit high is the best way I know to try to capture a momentum move to the upside. If the market determines it doesn't like the overnight assessment, the trade ideally should go unfilled. MY TNA trade today is a good example- I must have entered a too-close buy-stop and didn't allow that little bit of extra for the added insurance.
I may review and adjust these trades pre market after the President's address has been digested- SD
|
|
|
|
Post by sd on Feb 10, 2009 12:31:00 GMT -5
Just goes to show what my perception means-
I went short today FAZ, FXP, and SDS-
Only 1 of my buy-stop entries got filled this am -UYM, and got stopped out. I cancelled the remaining. I was wrong about market direction.
This is likely one of those times I will regret I didn't stay in the trades, but they had moved up nicely and I wanted to lock in profits I sold the 3 short positions between 11:11 and 11:30, feeling the move has been substantial enough and would likely give some back.
The market didn't like Geitner's speech at all, more questions remain than answers.
I am tenatively watching FAS to see if there will be a upside move, but will likely get on with other activities this pm-SD
|
|
|
|
Post by sd on Feb 11, 2009 21:15:36 GMT -5
As Wednesday went on , I made some trades in the pm. I thought the market was reversing, and I went long FAS $9.13 @ 12:49, and sold @ $8.90 @ 13:07 This was a 2.5% loss- I didn't have much confidence in this move, so only used a 1/2 position. That proved to be prudent. Later in the day I repurchased SDS- I wish I had seen the move breaking up sooner, Hindsight being 20-20, it would have been an obvious entry. I took profits earlier than I could have in the AM, expecting the move would fizzle & reverse. My first FAZ entry came close to getting stopped out 2x- There is always the opportunity to reenter the trade. As I look back through the trades, I have to ask myself what I did right, what I did wrong, and what am I learning to apply another day. I should have monitored the UYM much more closely. Although it was established as a potential swing trade, when I went in to short term trade mode, I should have adjusted the stop on that trade to a short term time frame. I could have reduced that loss by 50%. I waited on the open , price gapped up and I waited to see if there would be follow through back to the upside- and I took a quick entry on signs of price reversal to the upside- This gave me a tight entry to the potential stop-,even though it was not the 'safe' entry. There is a distinction here from entering into a stock that is downtrending and gives potential reversal attempts. and seeing a gap up have a price reversal. There are a lot of times that the open gaps-up or down. and I need to study this more- Some traders make a play on fading the gap, catching the price reversal. I tend to wait until 10:00 at least as a rule, but learning to interpret those early signals could provide better entries. I've noticed on the 5 minute chart as a stock is downtrending and makes periodic rally attempts where price moves back up above the fast ema, until price exceeds the declining SAR, the move fails. There is a big difference in SAR on a 5 minute and a 15 minute chart, or a daily chart. Sar can be set at different parameters, and can be used on any time frame chart. I'm finding I need to adjust the time frames more on the MACD & histogram - I wanted to use just this common indicator to guide me interpreting price action, along with the price bar itself. In the short time frame charts, the histogram gives multiple entries and potential sells, with a lot of divergence from price action. The time frames I use work better on the daily/hourly, and should likely get lengthened on the shorter time frames. This will require further review to see if it is going to be used more. I reread the stockcharts ed section on macd & histogram- What I had not realized , is that although the histogram is an excellent graphic of the fast/slow line, the position of the line itself in relation to the 0 line is also important- It's not just the fast line crossing the slow. Stockcharts recommends changing the time frames of the standard 12-26-9 parameters for different time frames. 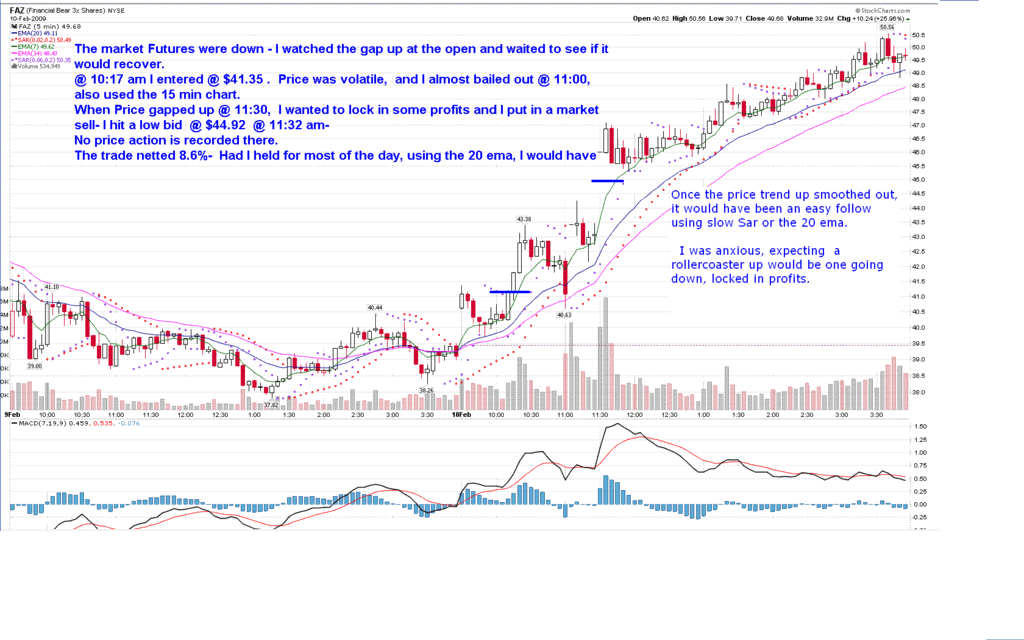  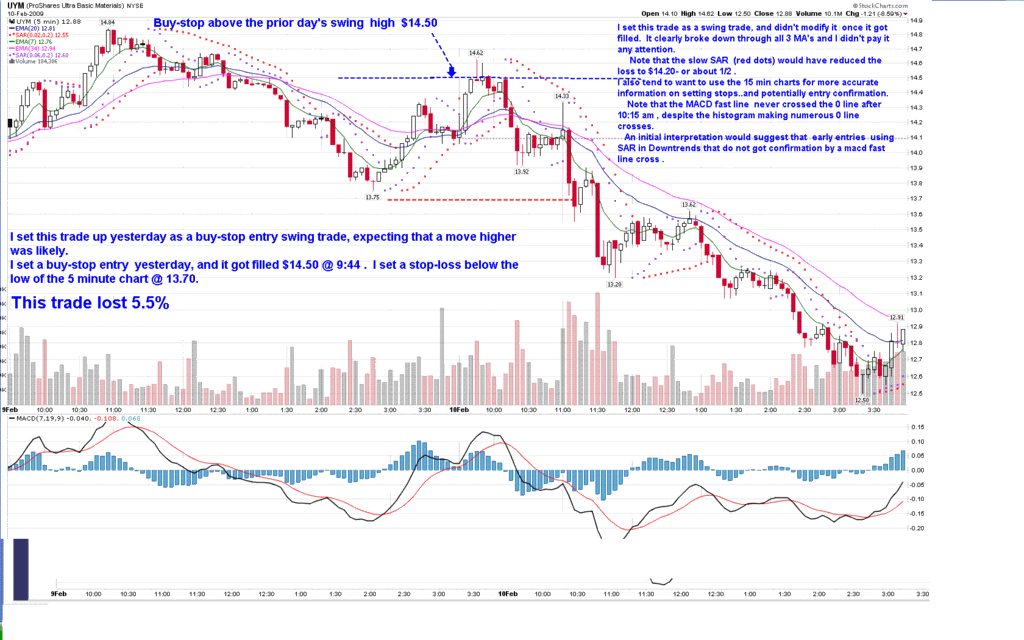 |
|
|
|
Post by sd on Feb 12, 2009 20:54:52 GMT -5
Today turned out to be good day, after I fumbled 3 trades and couldn't get it done for most of the day. I try not to let any preconceived notions lock me into any single direction- I prefer to try to let the market and chart show me, and hopefully respond accordingly- To really develop this into a skill will take time, and I doubt that I'll find much of that once vacation ends. How many times do we let our expectations of what the market "should do" influence what we do as traders? The more we try to put our interpretation of what the market should do, the more we are likely willing to risk more % wise in our trades. I know that the best loss is the smallest loss. And using the faster time frame charts, I have a reasonably narrow loss in most trades. I hesitated to apply that on my first trade today and I took a loss that I think I could have reasonably made smaller. The more smaller losses I have, the more times I get at bat, with a chance for a 3rd bas hit. GAPS- Frequently price gaps at the open -higher or lower. On the short-time frame charts, this is particularly evident. The premise of a gap is that premarket orders are building to go in a certain direction. Often the price will gap up in one direction, retrace for a number of bars as traders take some profits, and then the real direction may be decided. I am trying to make some tenative guidelines- on intraday entries using the 5 /15 minute chart- This is only possible if you have the free time to sit at the monitor , -
Past vacation, I likely won't have the time- Generally there is a reaction to the gap, and then the morning trend should develop. As a general rule, it's smart to sit on the hands watching the price until 10 am , and see if a reversal in the direction of the trend continues.
Today price gapped significantly market wide to the downside, and although I thought it was a big% move at the open, I decided to take a continuation of a move above the Gap after a few bar retracements. I entered into FXP which is a short on China- China had sold off premarket, and it was logical that it could continue. Looking at the 5 minute chart, I saw that big green 5 minute bar pushing above the open high and I pushed the buy- I was filled .01 below the bar high. I had set a stop lower than the low of the 3 bar retracement. I made a mistake in not adjusting the stop to follow the trailing Sar. and I let it remain. this trade lost 2.5% . 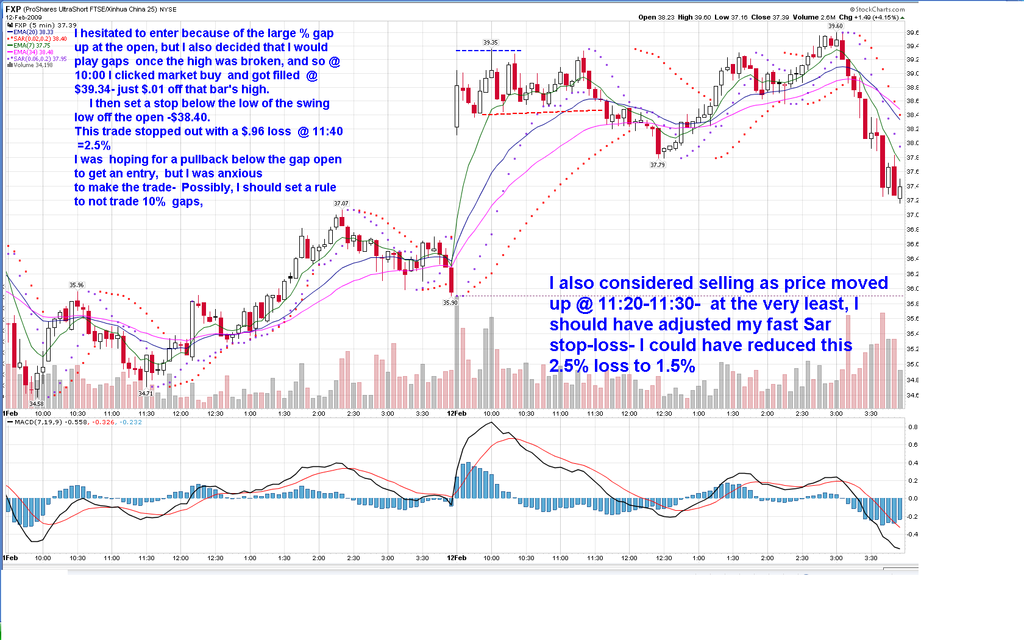 I expected a countertrend rally, and went long FXI @ 12:16pm $ $26.13 ;then it folded and I sold @ $26.00 @ 13:14.Loss of $.13 or 1/2%.No chart uploaded. Somehow I also made a 3rd stunningly bad trade, , but I think this was a accidental buy as I moved my mouse over my trading screen- I have all my trades pre-setup, with market buys and bracket sell and stop orders. I think it was an accidental click on the mouse and I owned a decidedly decling FASand I sold for a $.13 loss. 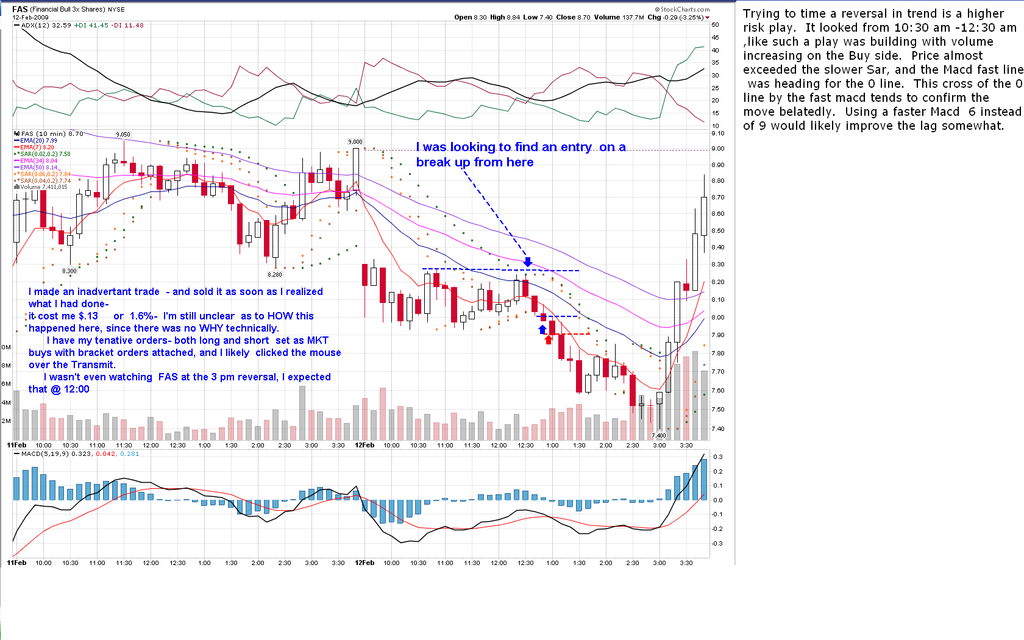 On a positive note (I think) my bad trades were well offset by 2 good trades- I'll put those in the next post. |
|
|
|
Post by sd on Feb 12, 2009 22:34:29 GMT -5
I took 2 additional trades that ended up positive. I doubled my UGL position @ $35.90 . which is a Gold dbl ETF. As the market was selling off, more traders were buying Gold. This doesn't make huge moves, but I'm profitable on the swing trade entry $33.25 2 week position, with a $36.00 close. As the market rallied at the end today, and there was a divergence in the macd I had not seen before, it is likely I will get stopped out tomorrow if UGL sells off. One thing I tried to illustrate in the UGL.is the application of using Parabolic Sar for entries and stops. I feel this has great promise for traders wanting to enter in stocks uptrending but are hesitant where to step in. For a swing trader focused on a daily chart, dropping down one time frame to an hourly chart will give a much closer look at what price is actually saying. Simply do not make that early entry until the trailing Sar has been exceeded. Back test this against the stock you are interested in, but I feel confident that this closer insight will prove valuable. Caveat Emptor here- buyer beware- I am suggesting that traders test this application against the stocks they are interested in before applying it. I also applied a hourly chart and Sar to UGL- This is likely the way I will need to trade unless I join the ranks of the unwilling unemployed. In the enclosed chart, I tried to show how closely using Sar as an entry and exit could maximise the trade. This is using an hourly chart, and I think this has great potential for swing traders. The application of Sar works well in this Chart, and may not work well in other charts. However, it gives a working framework to consider entry and exits that are likely more timely than a daily chart with much less risk. 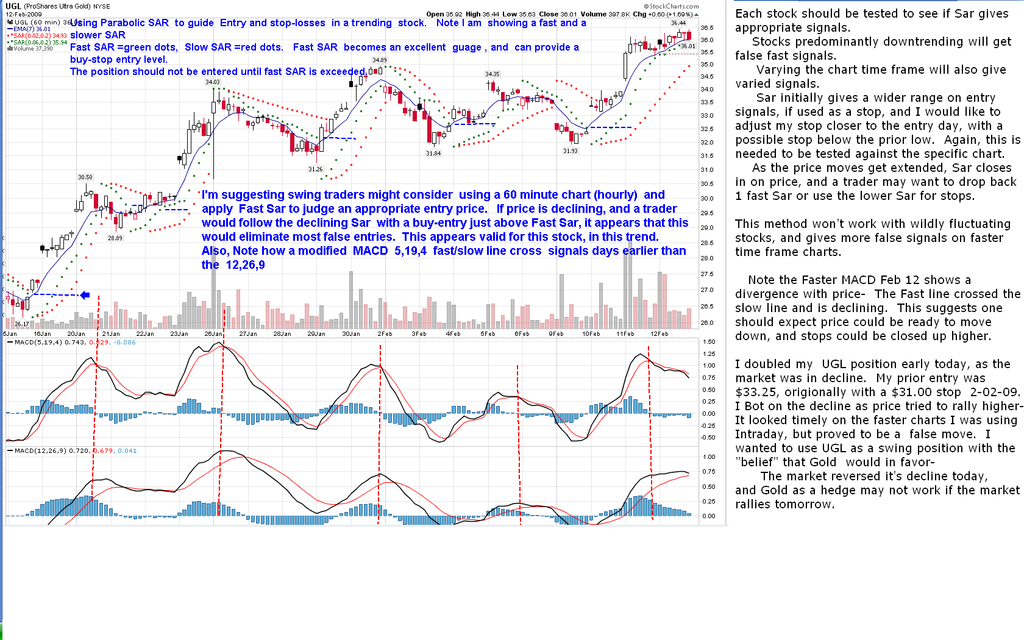 Near the end of the day, the Gov't announced there was a plan to help mortgage owners ready to be put forth- That was all the market needed to hear, and it was an excuse for the entire market to rally. I had URE already on my screen - and when I saw a follow through up on the 5 minute chart I Bot. I figured this was big news, and I had a tight stop if it fell through..I Bot on the 2nd up bar, before indicators confirmed- pure momentum driven. It appeared that this was a timely entry . As I followed this trade higher, I felt that if this had the force to change the declining market direction today, there was a potential to follow through higher tomorrow. After all, this was big news. I was seeing a 12% gain in 20 minutes on my position, and I felt that this could have legs, but I would sell 1/2 of the position at the close and raise a stop on the remaining half to hold overnight. I put a stop in $.04 under the 3:55 bar fully expecting it to be hit, and it wasn't taken. This makes me decidedly nervous, since I'm holding the entire position overnight. I'm hoping for a gap higher tomorrow, wher I will sell 1/2 and then follow 1/2 with Sar. If it goes lower, I'll be stopped out at the open. SD 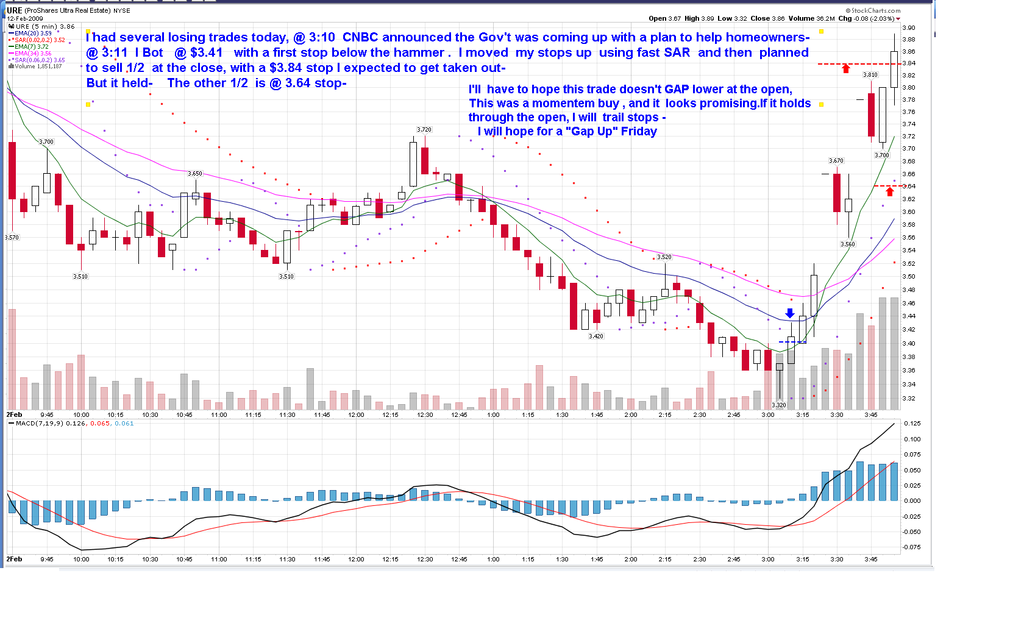 |
|
|
|
Post by sd on Feb 13, 2009 8:57:59 GMT -5
Using the 60 min chart for ugl,gll -gOLD lONG AND sHORT,
i HAVE A STOP-LOSS ON MY ugl POSITION , AND A BUY-STOP FOR gll -This will continue to be a swing trade position-
I am also planning to sell URE position on weakness- may look at SRS -inverse.
Potential here today for a rally up is my bend, a continuation of yesterday's late day rally. on the news the Gov't would put forth a plan to help homeowners. However, There's also doubts being expressed about the lack of details of the tenative plan- So yesterday's EOD rally was attributed to short covering. If the market goes down, it could be substantial.
BGU/BGZ-Russel 1k
QLD,QID-Q's
FAS/FAZ or uyg/skf 2x-Financials
FXI/FXP China
|
|
|
|
Post by sd on Feb 13, 2009 11:02:55 GMT -5
URE position sold off on stops, net profitable.
My UGL trade sold off as I expected, and my GLL flip position was filled - Using Sar as a stop for both exit and entry seemed to work well.
I tried 3 other trades that started off shorting - FAZ,QID, BGZ, which all started off well, but then rolled over and ended up stopping out.
I think I've come to the conclusion that I cannot timely apply the 5 minute approach unless I am capturing major market moves; Also, it is extremely time intensive. Vacation is over Monday, and so I will review and look for other trades that the 60 minute chart seems to signal for potential DAy/swing trades.
I'll try to get some charts this weekend. SD
|
|
|
|
Post by sd on Feb 14, 2009 12:26:44 GMT -5
I've cleaned up the chart with only one trend line and one SAR,and a fast MACD. I'm suggesting that for swing trades, and getting an appropriate entry, Sar may prove very accurate in preventing early entries, with the 60 minute bars giving more insight than the daily. I think it may be appropriate also, because we are in a rolling market here, difficult to find a good trend. I am using this on UGL and it's opposite GLL. This method has higher costs and slippages than staying in a position if that trend continues. For most trend traders, I think the value would be in using Sar to help guage the viability of an entry when a stock that is uptrending has a pullback, and where do you decide to enter? I'm trying to apply also taking a reverse trade in the opposite etf. While the stock is uptrending, the reversal may not have any $ benefit at all, and the price loss between the sell sar that takes one out and the buy-stop that gets one into the reversal may prove to be a losing proposition with slippage and costs. This entry/exit method will fit better into my available hours to check in on a trade intraday, and the MACD gives a early confirmation. SD ........ 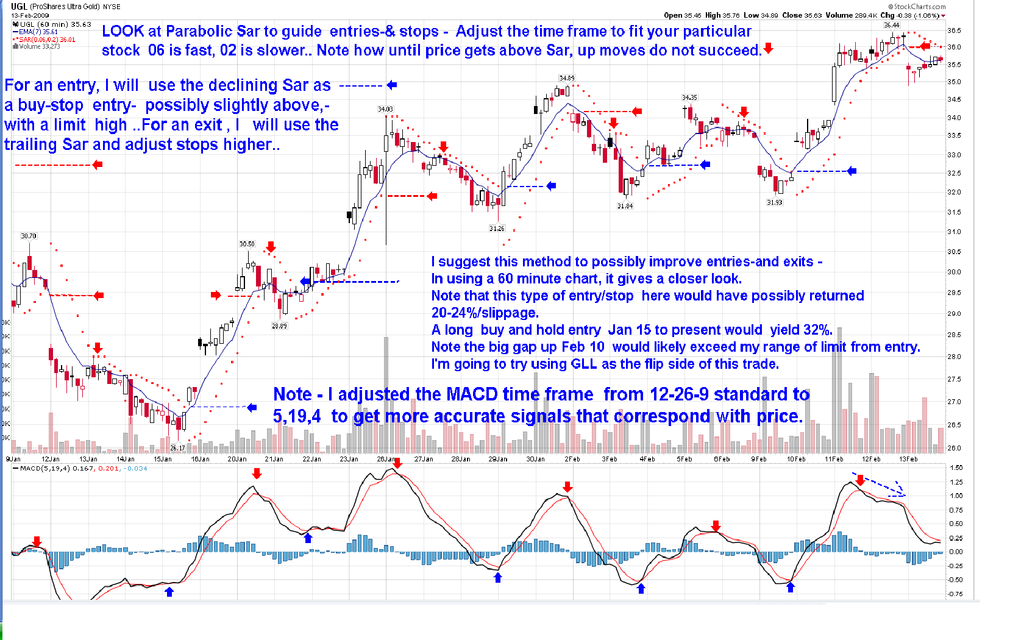 |
|