|
|
Post by bankedout on Feb 7, 2011 14:44:05 GMT -5
The 1024 & 900 charts work good on my laptop. However one of the factors causing scrolling is the white space to the right of your chart. To eliminate this, you would have to add a step between stockcharts and paint. You would need this free image viewing/editing program: irfanview.com/Basically you would start at stockcharts, do the Print Screen, open Irfanview and Edit > Paste Now you would see your screenshot. Use your mouse to draw a rectangle around the chart, and possibly some space above and or below it, then Edit > Crop Selection After that you would save the file. Once you open the file in Paint you could add your white space and text and then save again. I don't know if that makes sense or not. I do sometimes skip reading your comments because of the continuous side scrolling that dg mentioned. |
|
|
|
Post by sd on Feb 12, 2011 17:15:43 GMT -5
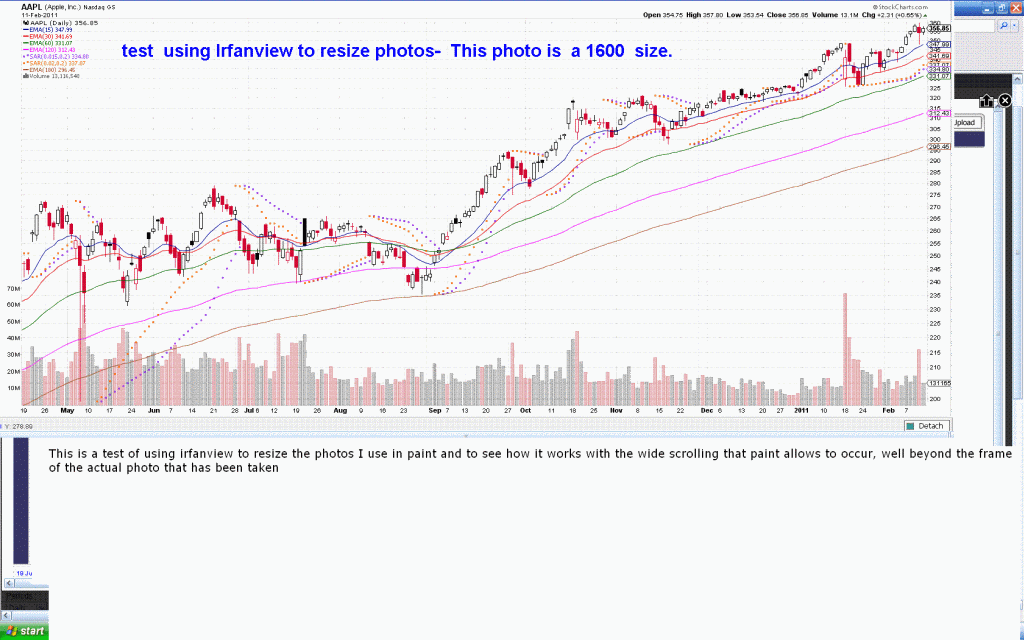
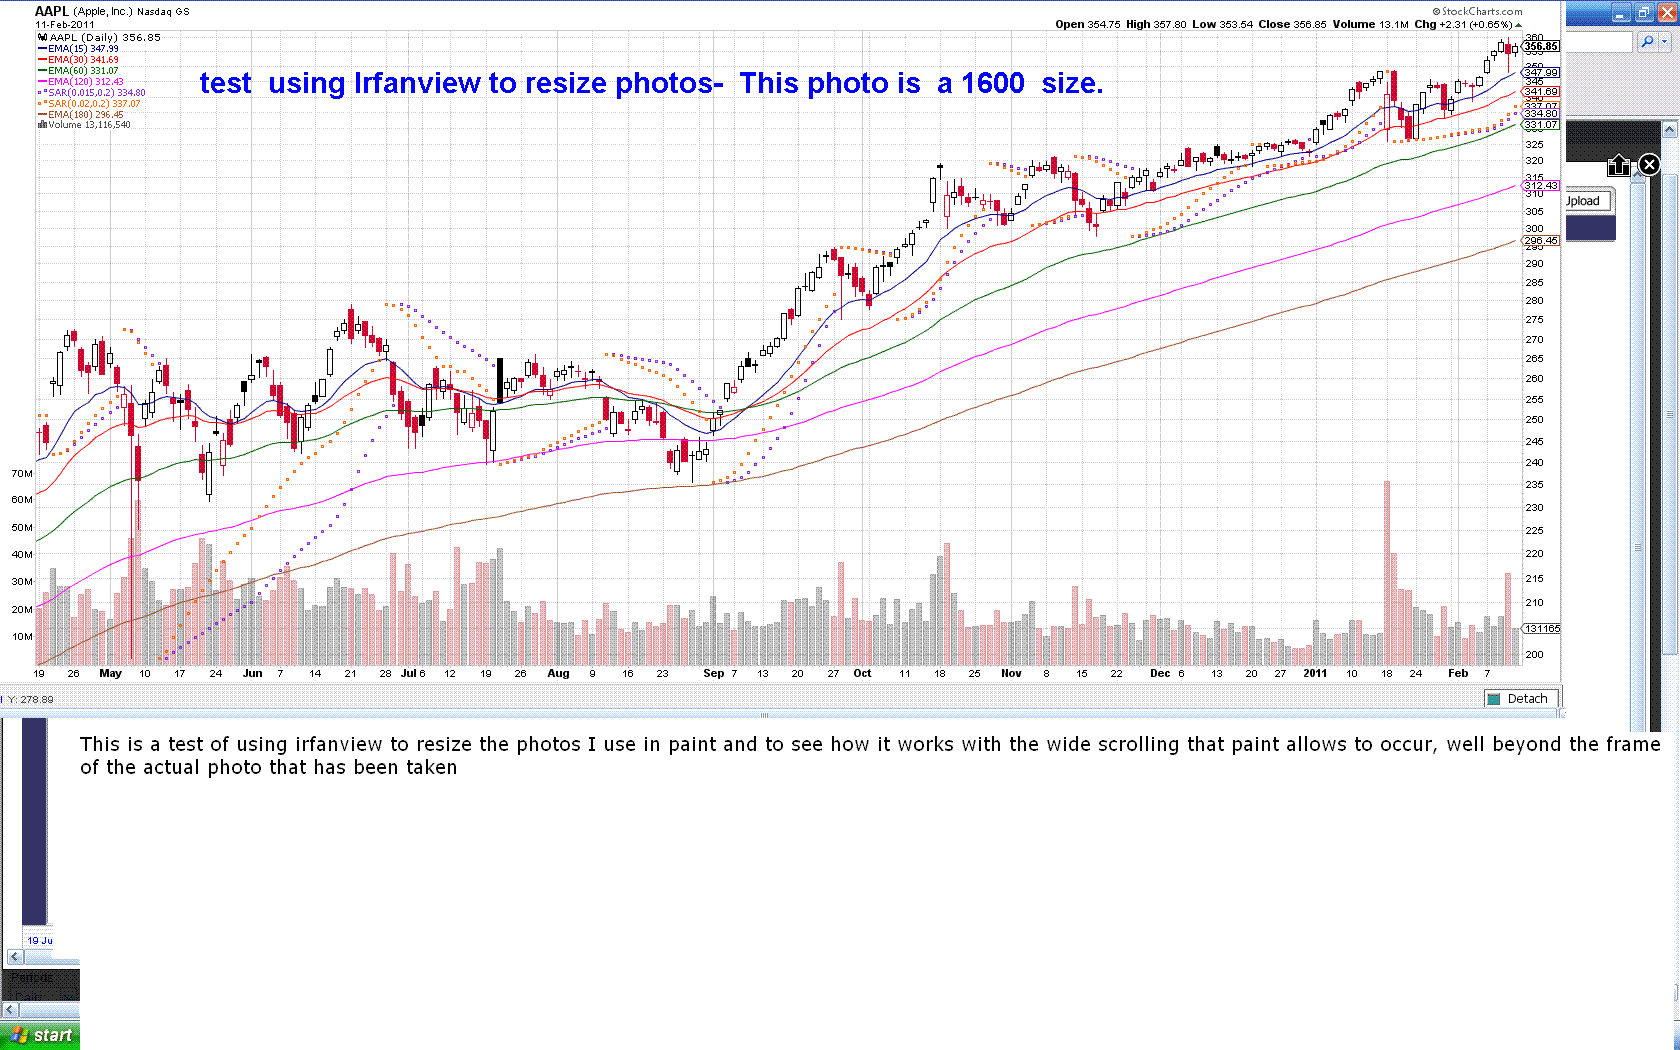
Thanks Bankedout ; Testing Irfanview. I've taken a 1600 (large) screenshot of AAPL, and saved it. I then opened irfanview and went to view and resize and it should be a 1024 . While in paint, I intentionally wrote wider than the picture, and on 2 lines. this should cause it to scroll wider . The 1st photo is the resized one from Irfanview The second is the 'normal' screenshot.   That worked! and it was simple! -Thanks! That worked! and it was simple! -Thanks!
that allows me to save in a larger format (easier for my eyes) and post the modified. |
|
|
|
Post by sd on Feb 18, 2011 22:59:30 GMT -5
It seems this market continues to melt up-,
Amazing, and many are awaiting a correction-
both bulls and bears.
I went long Gld and SLV a few weeks ago, and didn't
get kicked out, SU and FCG as energy plays, and a recent
Qcom entry, all are nicely profitable as the market melts
higher.
The Slv trade has gained 3:1 the Gld.
Everything is extended in this rally, and a 3 day
weekend makes me nervous.....
I've been focusing my trades using a 60 minute
chart and daily adjusting stops. Giving a bit of wiggle
room, but not too much, and applying a split stop strategy,
with a portion closer to price, and a portion that should
be beyond normal volatility.
Working 6 days a week seems to be the norm going
forward, but I hope to post some charts- 60 minute
when I get the chance.
In the prior month, i tried to "relax" some stops to
allow for retaining stocks for a 'longer' trend. And i
succeeded in seeing a larger loss on price pullbacks
that violated the daily .
The 'market' has now given back what it took,
but I will no longer passively allow a winning trade
to go into the red thinking it will eventually be a much
larger gain. i'd prefer to make a reentry after stopping
out for a smaller loss.
I will likely start a new thread at some point as DG
suggested.
This thread started in 2008, and i was semi- daytrading
and working at the same time.
Re-reading the thread from the beginning brought
back some memories, but aside from being sentimental,
my transition to part-time evening trader with a negative
market bias hadn't proved fruitful. While my account
went up, I also allowed it to swing lower as I let my
contrarian bias fight the trend and cause me to take
some losses thinking I was jumping in the reversal trade
at just the right time.
Adapting one's trading to the present market -
and identifying that market trend- takes time
and involvement. Throw in some sector rotation,
and you've got a mix for profitibility - or large loss.
I did enter the reversal in GLD
and Slv very early and right- and was fortunate to have
not been whipsawed out with a narrow stop.
Up to the individual trader .
Not sure when i will have the time to initiate a
new thread-
But i want to focus not only on entries, but applying
trailing stops and trying to keep a portion of the trend
in play with a wider stop as long as it is above BE.
SD
Note: I've tried to 'modify' this post to fit a typical
screen , by going back and reducing the sentence width
within the writing area in the post box.
and still several lines run wide and cause
me to have to scroll to read them.
As I understand it, this is dictated by the wide chart
in the prior post? If I reduce the future chart sizes to 1024,
will this issue go away? Thanks and apologies.
|
|
|
|
Post by bankedout on Feb 19, 2011 22:52:26 GMT -5
Note: I've tried to 'modify' this post to fit a typical
screen , by going back and reducing the sentence width
within the writing area in the post box.
and still several lines run wide and cause
me to have to scroll to read them.
As I understand it, this is dictated by the wide chart
in the prior post? If I reduce the future chart sizes to 1024,
will this issue go away? Thanks and apologies.
Yes it will go away. You could make a few short posts to get the forum to flip to the next page. I look forward to reading your trading journal without scrolling! |
|
|
|
Post by sd on Feb 21, 2011 22:23:25 GMT -5
I hope this post is properly sized.Apologies if it is not.
I've actually had a nice run -holding some
positions for weeks
and I realize i simply caught the coattails
of a melt-up
market here.
In January, I took a number of trades
that proved to be ill timed- actually, they
were counter trend trades, and they suited
my "beliefs" about the market being extended
and overdue for a correction.
I had also decided that I was too controlling
and tight with my stops, and would give these
trades some room
- But I still had wider "disaster" stops in place.
You know the outcome already- In this case,
stops were hit (loss was sustained) but price
did not reverse higher making me wish my stop
was wider- Price simply continued in the
downtrend lower.
I lost substantially compared to my normal
losses on EEV, VXX, and several others.
GLD had started to downtrend several
weeks earlier, and i entered that trade, and
am still in it.
I also had a position in FCG - a nat gas trust
that trends well and should be played vs UNG.
and although a slow mover, continues to the
upside.
I bot SLV 2-04 $28.32, and the trade has
performed nicely,
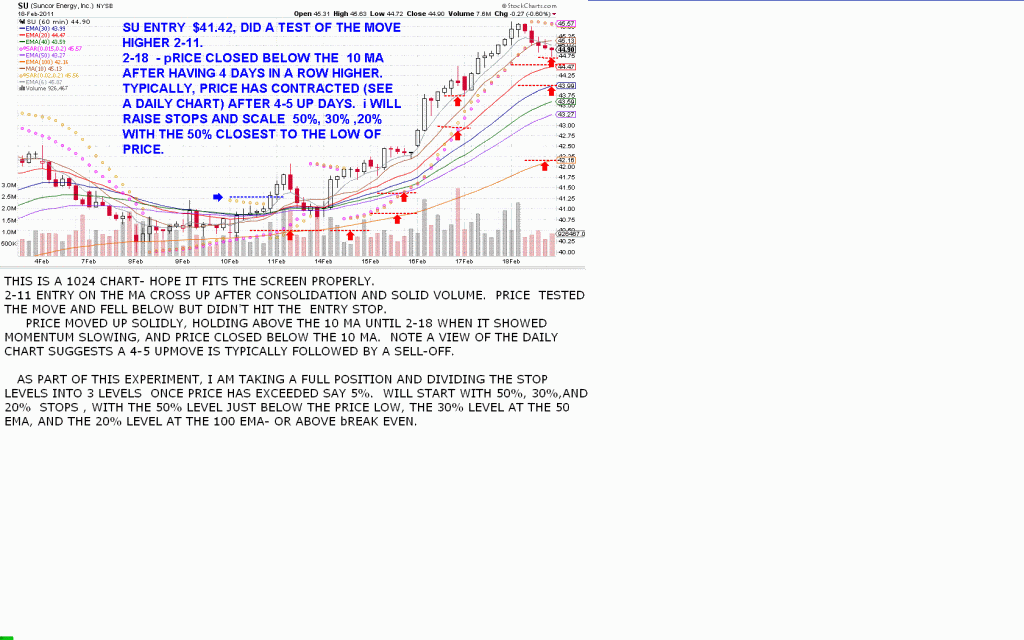
Went into an oil play -SU- on mideast unrest,
and that has also performed to date, but
appears to be rolling over.
And I jumped into an uptrending QCOM
2-14 and just keep raising stops.
the best trade is SLV, far outpassing GLD.
I'm posting an hourly chart of SU, which
potentially looks ready to roll over and
return to the mean after 5 or so up days
away from the moving average- which is the 'norm'
SU was a play on the middle east crisis
and concerns about oil disruption. Don't
know how that played out this weekend
with Libya slaughtering several hundred citizens....
Regardless, the technicals have the fast
ma downturning and price dropping below.
(60 minute chart)
since this position is over a 5% gain,
I'm stepping my stops at different levels f
or the position.
I'm trading with stops at 50%, 30%,
and 20%, with the 50% level just below
the price low that closed lower than the ema,
the 30% at a 50 ma (60 minute ) and a final
20% stop @ the 100ma -above Break-even.
These raised stops were motivated by the
reduction in momentum and past history of
the stock price.
This is also an experiment in trying to nip some
higher profits in the trade, but leave a portion
of the position open to see if the wider stop
would have been the better approach.SD

|
|