|
|
Post by sd on Dec 18, 2008 23:09:58 GMT -5
I'm enclosing a chart of SKF- I found the command box for photobucket appears when you scroll down with the right hand scrollbar - and those commands are below the initial page. The enclosed chart is one day of SKF in a 5 minute time frame. Note that the initial open often is different than the prior day's close. I've eliminated other indicators on this chart except the basic MACD. I try to look at price action, and if it's not moving strongly in one direction or the other, it is likely consolidating . Which way this consolidation will play out , is the direction I want to placing a buy-stop entry on. The process of consolidation is lower highs and higher lows as price narrows in range. This provides the opportunity to set a entry level if price moves higher out of the range, and a stop-loss that is below the consolidation range. That also presents the best smallest risk. The key is not being too early in establishing the buy-stop level- or too late in realizing the trend isn't going to pause. It's easy to look in hindsight and say -"That was it!" and pinpoint the best entry and stop. In real time it's an ongoing process and a judgement call. As I take the time to post these charts and analyze what I see in after hours, I think it helps me to be able to react in real-time. This chart starts by moving up from the open- I'm not sure of the prior day's close btw and that may be relevant. Price moves up to a high in the first 30 minutes, and then retraces- During the morning, price consolidates , with gradual lower highs and also some higher lows- Notice the MACD histogram- It started off wide ranging and then narrows around the 0 base line- Occaisionally the histogram will show a divergence with price action, and a declining histogram indicates a waning in the strength of the trend. I had been using other indicators - such as the ADX and CCI , but they only illustrate what is already being seen on the price chart. It's a no brainer when the price is above the fast line and increasing above the prior range for 5 or 6 bars that the ADX will upturn and strengthen. Note that a series of lower highs in an uptrend is a bullish flag , and reflected also in the shorter time frame charts-It gives a narrower range Risk for the trade- Also note in this chart during the consolidation that the volume levels were not excessive, but did exceed the selling volumes. Here's the chart if I got it right: 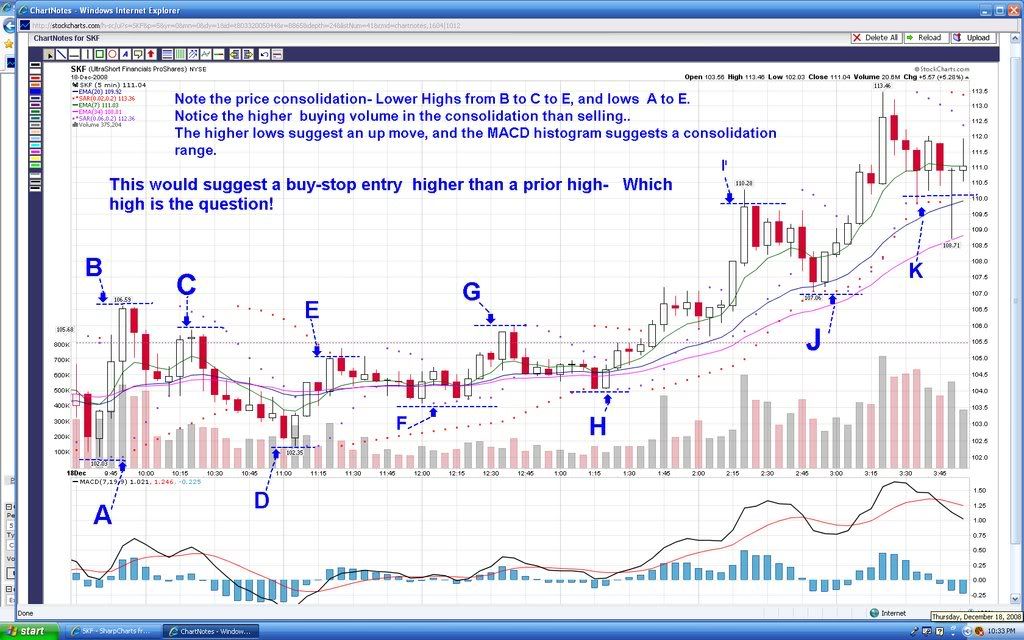 |
|
|
|
Post by sd on Dec 28, 2008 20:45:04 GMT -5
I've mentioned this site before ,
leavittbrothers.com/
and I don't suscribe to their service- I signed up for their weekly newsletter- and they don't bombard you with follow-up solicitations. This week they showed their winning and losing trades, as they do every month. I appreciate seeing their basic chart set-up ,
They typically do longer term days-weeks- swing trades, which I think is the focus of many present traders. What I found noteable is how they have modified that swing trade approach to take profits-or losses- fast on signs of weakness. Often in a few days.This is in reaction to the high market volatility, where the market will move in one direction for 2 or 3 days and then do a snap reversal in the other direction./ We may be entering a period of lesser volatility- but that has yet to be seen.
I haven't yet decided to go back to daily hold-swing trades, but as the market stabilizes and trends can develop for more than 3 days, that will certainly be an alternative.
The present work situation may not allow me the flexibility to monitor my trades periodically intraday, and I've become dependant on both real-time charts and real-time access to the computor periodically during market hours- Particularly the last hour- When I get to raise stops as close to price action to maximise the gain. And Definitely not planning to hold overnight.
I believe what I have learned best this year , is that the smaller loss is the best loss. It doesn't matter what time frame one trades in. When a larger loss is the outcome of the desire to be right , it's a losing proposition. The market this year has certainly taught many of us that lesson .
As we go forward into 2009, I hope to set some resolutions that will see my trading to continue to be profitable. SD
|
|
|
|
Post by sd on Dec 29, 2008 22:11:05 GMT -5
I only found a few minutes this afternoon to look at the markets- and I looked at SMNand UYM- I realized when looking at the charts I had missed a great opportunity earlier in the day as price just bee lined . It appeared there was a potential reversal of trend going into the afternoon- Using the 5 minute chart, I saw that price had tried to reverse earlier before noon, but had failed. I reminded myself that the prevailing trend for the day was down, but it looked like price was making a solid reversal. I set the buy-stop just $.02 above the wide range bar, as the following bar was selling off. I set the stop just below the wide range bar- I was risking $.14 on the entry. Price hit my buy-stop point and exceeded - I went to the pending page to verify my limit sell and my stop-loss were both registered correctly using the attached bracket order. I've had problems in the past where the limit order was registered , but the stop-loss was not. I found that my stop-loss was listed as a limit buy at the stop price- I immediately cancelled the orders, and found that I didn't have any position- I will assume this to be my entry error. I immediately repurchased - higher. with an adjusted stop below that bar. As it turned out, the stock moved higher, and then when I returned I raised the stop to above entry as the price rolled over. This trade made a few cents only- Potentially it could have caught a significant trend reversal- Important point is the application of a very tight stop-loss- applied 2x in this trade. I also think it's riskier to try to play a trend reversal, than a continuation of the trend. Illustrating these charts in the pm gives me some additional study time that I do not have during the day. 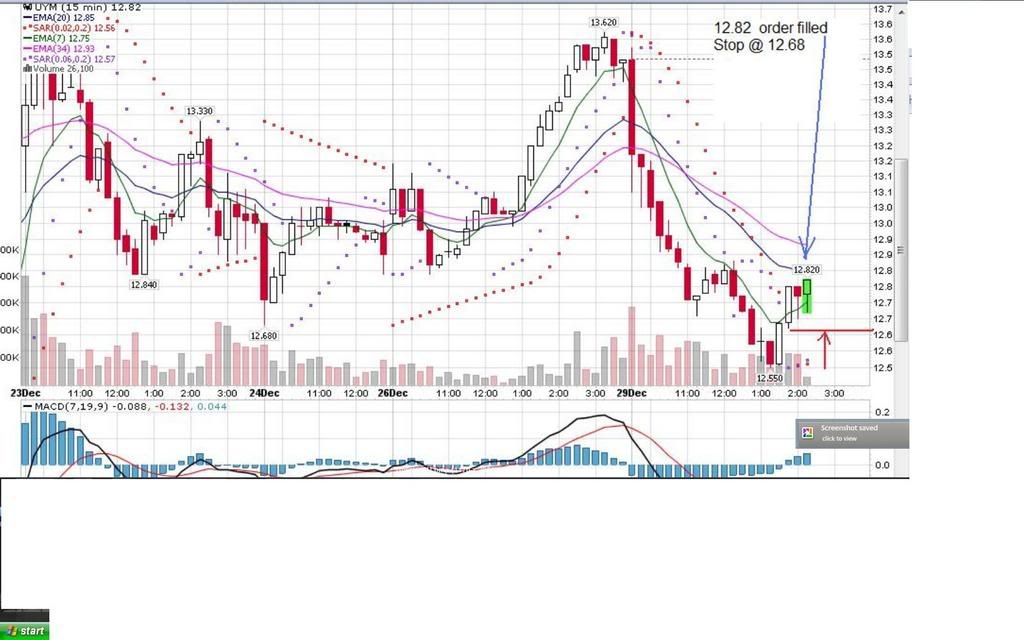 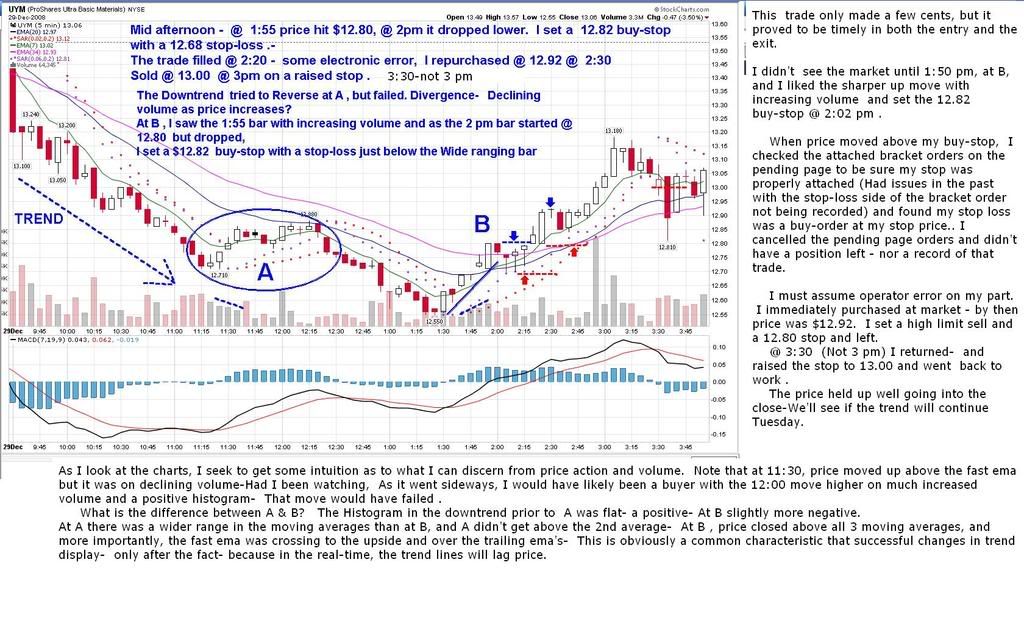 |
|
|
|
Post by sd on Dec 30, 2008 21:47:08 GMT -5
No time for even a glance at the market today- Van Tharp says that we don't trade the markets, we trade our beliefs about the market . How true that is.
In my IRA I'm 90% cash-money market,have been for some time; and I just put 20% more back into the market . It would appear that a possible bottom has been made. My belief is that there is a lot of government stimulus at work and in the new President's early months there will be a lot of enthusiasm that he can turn this ship around.
I spread the money between Diversified Intl, emerging mkts, Lg cap value; smallcap growth, and real estate- A look at the charts shows a basing pattern higher than the lows that were made. Whether this will be the final bottom I have no idea- This is a limited Risk entry., I will add to this if the uptrend continues-However, I will be only cautiously optimistic . I intend to follow the IRA investment weekly, and will add or readjust as necessary. Here's to a profitable New Year!- SD
|
|
|
|
Post by sd on Jan 1, 2009 15:57:18 GMT -5
HAPPY NEW YEAR!
I wanted to post my year's results, along with some personal observations about what I've done right and what I' haven't done or did half heartedly.
First of all, I haven't put any real effort in treating my trading like a business- That takes study, effort, and real diligence.
Instead , I've used it as a evening hobby, recreation, and a "wishful" -"maybe I'll get lucky" .
While I've been disciplined about using position sizing and also stop-losses, I hadn't really put forth the follow-up study that one should likely do to study both winning and losing trades.
Also, every business needs to balance the books and have a periodic audit- Well, with limited time as my excuse, er -reason,
I didn't even do much more than jot down the trades- such as tally up the winners vs losers- I could always look at the account balance and figure out - Along the way, a periodic accounting of what worked and what didn't work would have given me some better insights.
I just went through the past 15 month's statements.
In October 2007 my account was up to $10,839.
That's when a bull market made all of us feel like we had some degree of trading competence-
In November, I lost 9.75%
In Dec I lost 4.82% and finished the year @ $9,311. -15% from the 07 high.
It goes so quickly.
For the next 8 months, I traded less often-
Jan lost 1.87% but Feb went up 6%, then I lost .53 & .87% in March and April. May I gained 1.59% and gave back -5% in June. July -1.69%, and Augest -1.16%
When I realized my account value had dropped below $9,000,
I realized I should either take the money and spend it to pay off some bills, or try to get more serious about my trading.
I had decided I would only trade ETF's, and that I would focus on only a few - At Sept 26 I bought 3 short focused ETF's, held for 3 days and made 2%. I had traded some etf's previously in the year with volatility swings kicking my butt.
In October, I made a total of 66 trades- and early in that time I started to close my positions at the end of each day. I activated a stockcharts real-time account,(it's only $10/month additional) and started using the 5 minute and 15 minute charts. I learned not to trust the first hour of the open- nor the close the night before. I also started to focus more on price action, and I would set stop-losses and buy-stop entries on the swings within the 5 minute chart.
I'd find a few minutes periodically intraday to monitor my trades-If price went in my direction , I'd contine to raise stops using Sar and a slower ema or the 15 minute chart. If price started to go lower, I'd quickly cut 1/2 the position before it neared the stop, and then I wouldn't just wait for the remaining stop to be hit- I'd often raise it higher.
I saw that price often rallied at the end of the day, only to sell-off at the close - I tried to be at the computor after 3 pm to periodically adjust the stops by chasing price just below the fast ema- It made a big difference by not allowing that profitable trade give a portion back at the close. I would often net an extra 2-% by chasing price above the stop-loss I normally was using-
I had a very successful month with a 22% gain after commissions. I also caught some major market reversals with most of my portfolio applied- That was too risky I believe now, but I got away with it at that time.
It brought the account value to $ 11,211
In November, I employed the same strategy, and made 37 round trip trades. I netted 11.75% gains after commissions, with the account at $ 12,528.
In Dec, I made 14 trades, and didn't have the opportunity to monitor many of them and lost 2.5%
$12,222 end of year port value.
For the calender year, the net gain is 32%.
If I go back to my prior Oct. high, I'm up 12.8% over the 15 months.
What made the difference was my willingness to pay more attention, apply more discipline with very tight stops, and to apply a different strategy instead of hanging onto the swing type I was comfortable with last October.
Got to fire up the charcoal grill to burn some ribs-Here's to 2009- Hope I can hang onto my new found profitability- SD
|
|
|
|
Post by dg on Jan 1, 2009 19:46:10 GMT -5
sd:
Seems you did well! Congrats!
dg
|
|
|
|
Post by sd on Jan 1, 2009 21:36:41 GMT -5
Thanks DG- we'll see if I can replicate that trend going forward.
Tonight I've been housekeeping , and cleaned out the old stockchart lists and included one with strictly the proshares leveraged ETF's.
Scrolling through the 60 or so ETF charts that cover sectors and market segments, it quickly becomes apparent that the 2 day rally was across all segments of the market.
Looking at daily charts only gives a glance- I would suggest that after one looks at the daily, look at the lower time frame charts - 60 minute/hourly and even lower, to get a sense of how the stocks finished the day- This doesn't mean that they won't simply tank the next day on some market news or fear.
As I look at these hourly charts, most show a 2 day reversal, and all were strong for most of the day. Some sold off the last hour, while others held their ground with a strong close.
I'd like to think that we may be able to see a trend develop for more than 3 days without a 20% whipsaw-
I'm taking a few speculative trades here, with a different approach than I normally use.
I took 3 of those that ended without breaking down the last hour, and set buy-stops above the highs they had made.
I then took a look at the price swings or trailing Sar, and determined a suitably close stop-loss. This gives me an idea of the range I might want to give to an attached trailing stop.
This may be a total flop- but I've seen that the market has also trended in one direction off the open lately, and this may allow me to get an entry without having to be there in person.
The trailing stop should be based on 1.5 of the average true range, but I'm more interested in minimising losses than being right.
I've got a housing, a financial, and a russel 2k that look worthwhile- If the market actually chooses to rally, it will be across the boards at this point on some pent up euphoria vs facts.
URE BS @ 6.50 stop-6.20 TS $.30
UWM BS @ 20.20 stop @ 19.40 TS $.80
UYG BS @ 6.10 stop @ 5.80 TS $ .30
My allocation for the 12k account , is to only initially trade 3k any one day to start, with a typical position being $1500.
I can add to that if I know I'm in the midst of a big market run,
but in most circumstances, it will give me a 3 day turnaround and $3,000 available. I'm actually considering holding overnight at some point- maybe not yet though- it all depends on the volatility and the close.
Position sizing- I'm going to reduce my $1500 avg size to $1000 with these 3 positions. UYG is the cheapest with a buy-stop @ 6.10 and a trailing stop-loss of $.30 .
I don't want any one position to cost me more than a max of 2% port value, and would prefer it to be less than 1%.
If I buy $1,000 worth of UYG @ 6.10 , that gives me 164 shares.
If I risk $.30 on each share , I am risking $.30 x 164= $49.20
$49.20 / 1000 entry= a 4.9% potential trade loss. (on 1,000)
The $49.20/12000 = 00.4% loss- This is well within limits, and is extremely conservative-
This is a 2 sided approach- I expect at some time to be able to access the computor and adjust the trailing stop , or to remove it altogether and follow with a manually adjusted stop.
Also, along with the buy-stop I use a limit high stop-maybe $.10 higher -That way a fast moving market can get filled, or I don't own the stock on a gap high open far above where I set my stop entry.
Also, I may adjust these trades to enter lower if the markets drop down in the open but look like they will continue to rally- and if I have the time to watch,.
There are monies and profits to be made while taking thinner slices of one and 2 or 3 day trends. The leveraged ETF's are a good vehicle IMO .
While I had a decent return this year,and turn-around , some of the short focused etf's returned over 100%. We learn as we go- we just have to be able to keep on learning and adapting without putting ourselves at too much Risk.
SD
|
|
|
|
Post by sd on Jan 2, 2009 19:46:52 GMT -5
And how did my experiment go this first trading day of $2009? Not too good.
I had set 3 orders with buy-stops, and my "belief" was the market would rally today.
I also was trying a new strategy, because I didn't think I'd have much available time to monitor the trades .
Add to this I'm having trouble with IB giving me a listing of all my trades- They don't show 2 of my buys, just the sells.
That aside, I had set buy-stops above the prior close highs -
URE had a $6.48 high near the prior close , and then sold off some. I set a $6.50 buy-stop entry, and I had to use a 4% ratio for the trailing stop-loss. I did the same thing with UWM, and UYG.
In the market open, for URE , the 5 minute high was 6.50 and my position was filled. It was also the high for the day!-I managed to nail it exactly. It headed straight back down for 30 minutes, but I was stopped out in 13 minutes- and I wasn't there to monitor it.
UWM was a $20.20 buy-stop - that also filled in the first 5 minute bar. It moved lower from the open, but not significantly- about that 9:50 time, coming in and seeing the first position going south and hitting my stop , I nipped the UWM trade off for an $.11 loss-It , of course, reversed higher in the next bar. I also cancelled the UYG trade.
Lesson learned here- had I not meddled, the UWM trade would have worked out . The other lesson , is that the first 30 minutes -possibly 1 hour of the market open is prone to reverse and find the real market direction..
After lunch, I set a buy-stop for UYG @ $6.05 and it filled @ 13:26 -1:26pm. I set a close stop, and it slowly climbed slightly -
At 3:37 it was trying to move more vertically, but I sold @ 6.14. and headed home. That was pretty close to the $6.20 high, and the $6.07 close. I actually debated about holding the position overnight , and I realized that I would be putting myself totally at the mercy of the market manipulators. I envisioned what a $1.00 lower open would feel like- and I can't see taking that risk.
At some point I will wish to be holding position trades- long or short- Now is not that time-SD
Today was a losing day - small, but loser none the less-
|
|
|
|
Post by sd on Jan 2, 2009 21:29:54 GMT -5
What is a reasonable Goal?
While we all aspire to make money and be profitable, part of a trading plan -and a business plan- should be to control expenses and develop a steady revenue.
One of the expenses is the cost of commissions- You have to factor in the commission in and out expense for each trade- If you're trading in 10k share lots , a $7.00 commission may not be prohibitive. But if you're trading smaller amounts, a $7 commission vs a $1 commission is a significant factor- particularly over multiple trades. If I make 100 trades, my expenses will be approx $100 commission and $10 monthly fee. =$110.00
If you're paying $7 or more, you're looking at $ 700.00 for the same trades. You might say, I don't plan to make 100 trades in the next 5 years- you're still paying 500% more than you should.
Interactivebrokers has good service and executions, and smaller fees. .
Goals: what is a reasonable goal to aspire to in our trading?
Most traders will compare themselves to a market benchmark-for their year end performance.
Do we want to compare our results to a market index fund?
I will say that I want to outperform the market index funds-let's say the s&p 500.
Let's say the historical market return averages 10% over time.And as a trader, I want to meet or exceed that as a minimum goal.
Using my personal account, let's say I want to at least meet the historical average of 10%.
Let's break that down into bite-sized goals.
That means, for a $12k account, I want to make $1200 (10%) as the minimum over the year. I want more of course, but following a year of 30 & 40% LOSSES, I'll take what I can get.
If your account is substantially larger-or smaller- follow the logic % wise.
If $1200 on a 12K account = 10% return
$5000 on a $50000 account
10000 on a 100k account
$600 on a $6,000 account.
My minimum goal for a 12 k account: 1200/yr.
That means I need to make 1200/52= $23.00/week
That also means I only need to make 23/5=$4.60/day.
Can I average $4.60/ day profit? It doesn't seem alot to ask for when we often look at our trades in 100's of dollars.
Could I net $9.20/day? $46.00/week?
Astoundingly, that would yield a 20% return on a 12K account
Can I make $4.60/day in my trades?
If you're trading a $6k account, can you make $2.30 a day on your trades?
If you've got a 100k account, can you make $35.00/day on your trades?
If so, you've gotten a 10% return and equaled average market returns. You've also exceeded what 85% OF THE TRADERS AND FUNDS can do.
These seem like small goals to achieve, but are offset by the losses we allow ourselves to take. Trading is about taking both profits and losses-
When we don't make the losses small, the smaller profits don't work.
SD
|
|
|
|
Post by dg on Jan 3, 2009 10:18:59 GMT -5
sd:
Perhaps it is more realistic to ask what the day trader can make in a week with N trades, W of which are winners and L of which are losers. Given the expenses of 2xNxC, and an average gain of say 5% per winner and a preset loss of say 3% for losers, one could expect to make NET = {[(Wx5%)-(Lx3%)]-[(2xNxC)/AMOUNT].
If W=3, L=2 (N=5), C= $7 & AMOUNT = $1000: NET = 9% - 7% = 2%/wk
If W=3, L=2 (N=5), C= $1 & AMOUNT = $1000: NET = 9% - 1% = 8%/wk
Notice how commissions eat into trader profits when amount is small. Just double the amount to $2000 and the NETS change to 5.5% and 8.5%. Of course those percentages are the same regardless of the time period involved to do N trades.
|
|
|
|
Post by sd on Jan 3, 2009 11:15:18 GMT -5
Thanks for the example- I had to take algebra 3x to get through it.
It's an excellent illustration- That's why I've been very pleased w/- The lower commissions @ IB allow me to try smaller trades. Also, it allows me to not be greatly concerned about the commission cost if I decide to sell 1/2 the position at one level, and the other 1/2 at another.
Ideally, one develops some consistancy with their trading, and their trading approaches. I haven't done well this past week; and as I try to adapt to less access to the computer real time, I'm limiting my exposure with smaller position size until I get a "feel" for the average results. In time I hope to have a methodology that I have confidence in.
As I try different minor adjustments in trades, such as the entry w/trailing stop -more speculative, I will start off smaller $1k, and may add in $.5k when the trade direction is solid. I look at my average position size as $1500. Might boost that to 2k in a vigorous trending mkt. That would be the max though in any single position.
We all have had some tough times this year; Perhaps we will see a bear market rally- no one knows. Looks like it though. For those folks that got disheartened by this market, I would recommend trying smaller trades and smaller commissions allow you to do that. SD
|
|
|
|
Post by sd on Jan 3, 2009 22:55:12 GMT -5
Jan-2 trades along with a chart showing 3-5 bar flag pullbacks. While my URE trade rolled over , most of the broader market did well with a 3rd day advance. DDM,DIG,QLD,SSO leading the moves- The Chart studying the 3-5 bar pullbacks-On the pullbacks, the entry would be on an upside move that is above the high of the last sell bar, with a stop at the low of that bar- The entry would also require a close above the high of the last low bar. The stop would be the lowest low that was made in that bar or any following. I'm trying to realize a better real-time entry closer to the low of the pullback and therefore a smaller potential loss exposure.This is also assuming I would actually be able to monitor trades in real-time and act on them. Looking at the etf leaders with a 15 minute chart gives me a basis for some Monday trades-SD 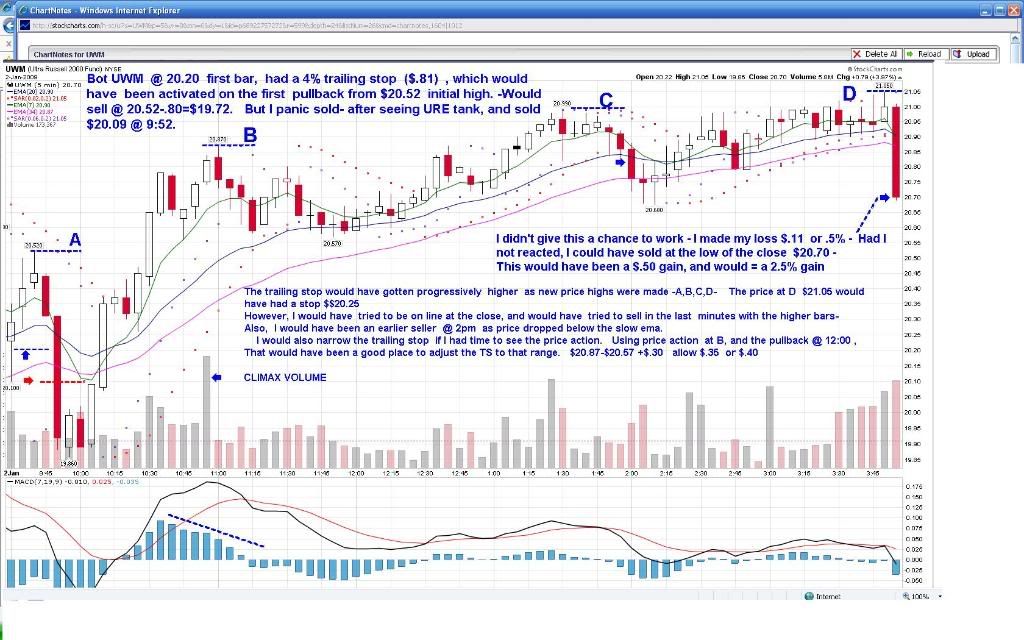 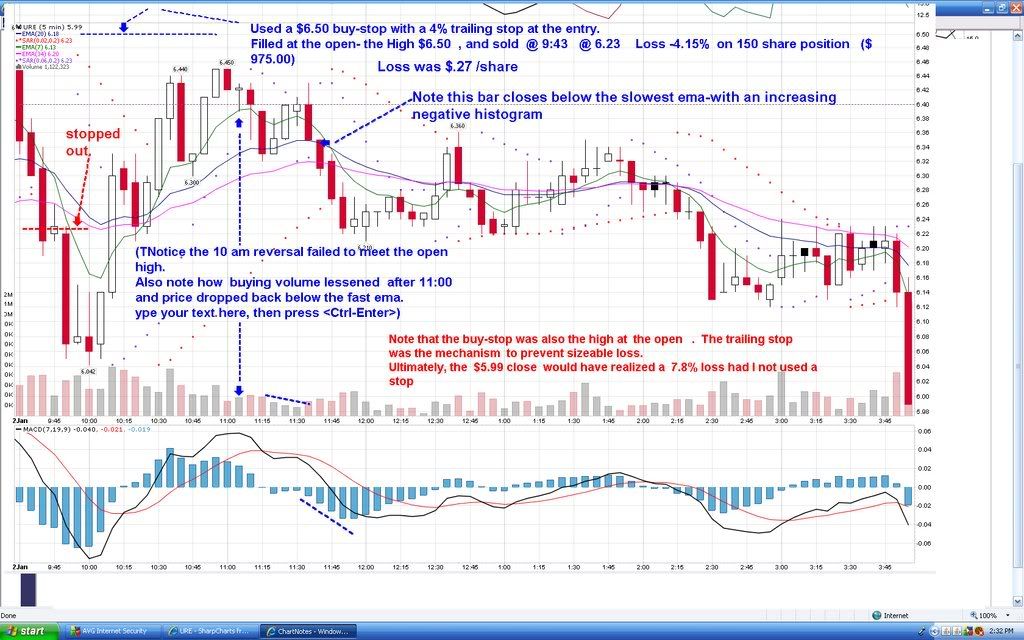 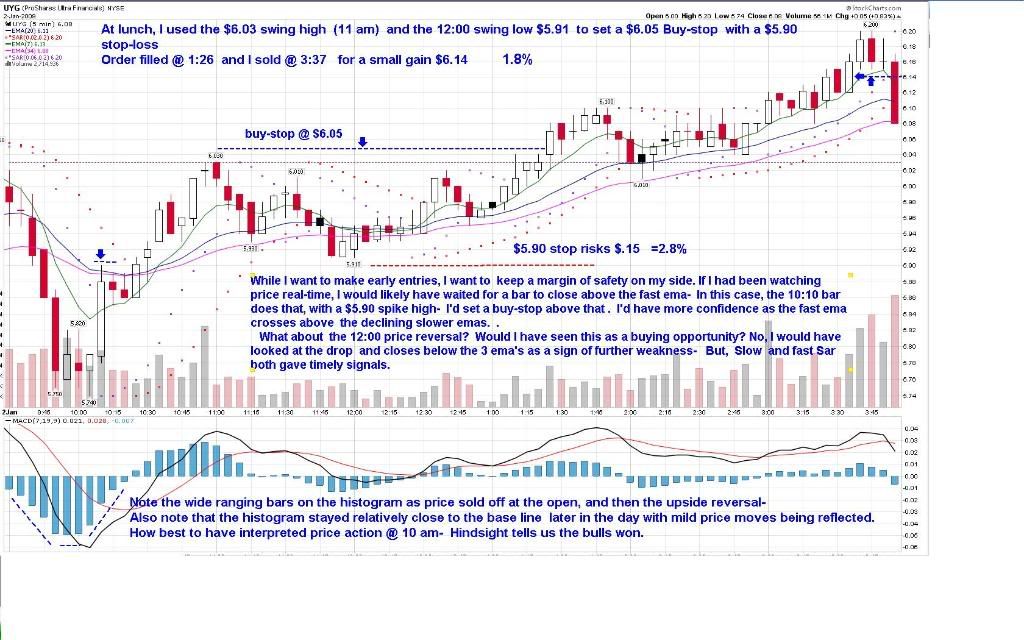 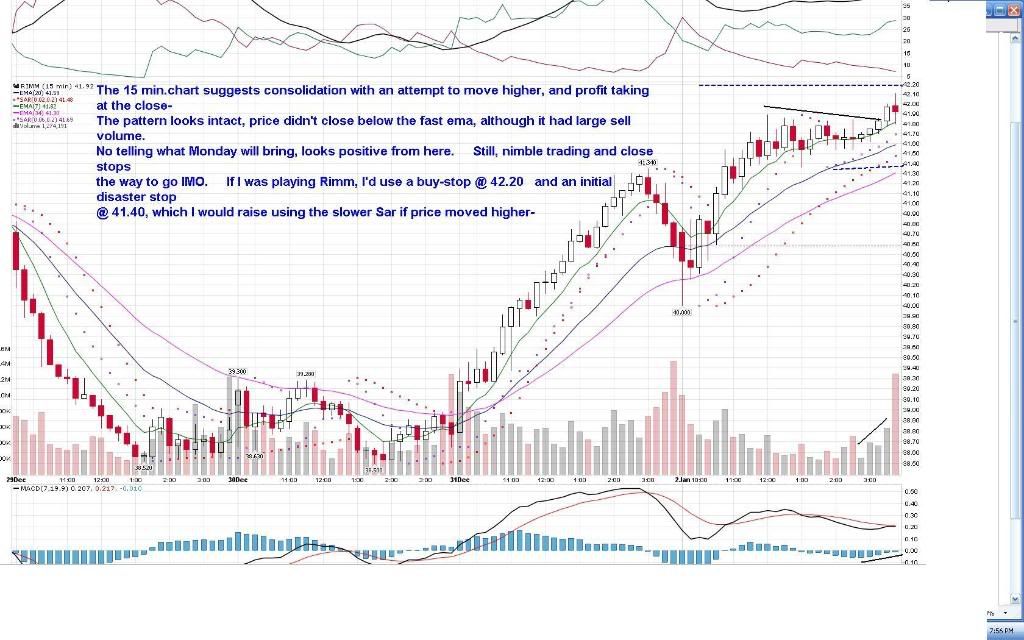 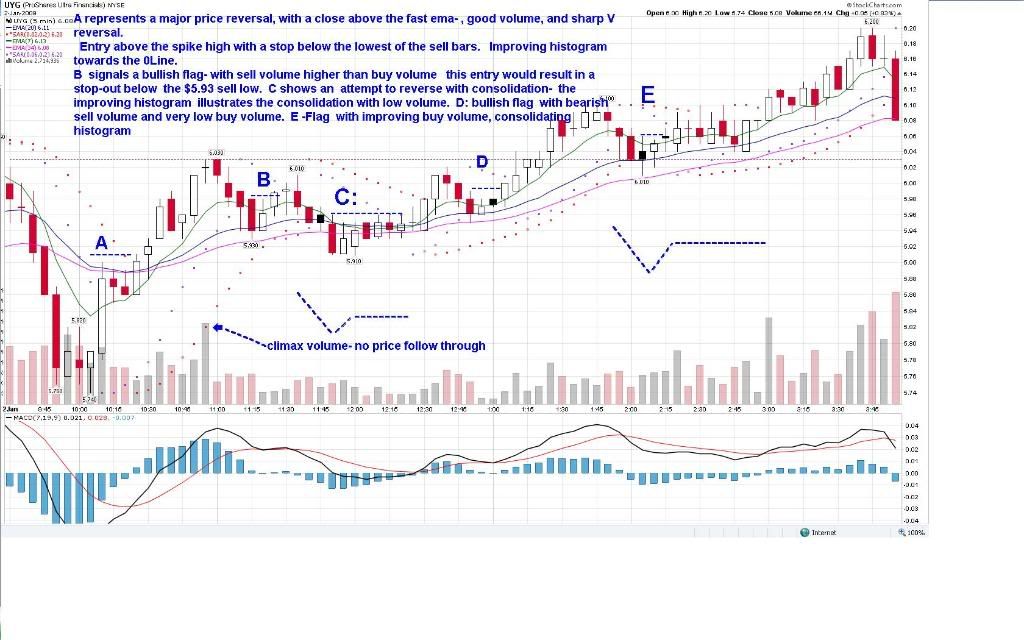 |
|
|
|
Post by sd on Jan 4, 2009 22:46:15 GMT -5
I'm getting to be a strong proponent that even swing traders using the daily and weekly charts should take a look also at the 15 minute charts and eliminate most indicators- except the macd histogram. The 15 minute chart tells how the battle raged intraday, and can hopefully provide some early insight into the next trading day. I'm trying to only look at Price, the macd histogram, and volume- All the rest is clutter and delayed information. Even the ADX/DMI lags price action substantially- particularly in a choppy market, and I use adjusted and faster time frames than the average settings.
This diary/ Blog I'm posting here at DG's isn't so much about how to be successful . I'm still hoping to get there.... Success is a goal over the long term -I've had some very short -term success- it's about trying to adapt my trading and make it successful with changing market conditions- and in my present situation- changing personal conditions. Eventually I would aspire to being able to have a sense of the market, and the areas I could potentially trade successfully- With the advent of these leveraged long and short ETF's, being available even to my trading Roth IRA - There is a lot of opportunity to adapt to the market, and this market has been anything but a constant target.
One of the comments I read somewheres recently, pointed out that we don't trade the markets, we trade our BELIEFS in what the market is or will be.-Or Will do or should do.
This is so true for my experience. How about yours?
The advantage of trading a 5 minute chart, is each day is a changing palette- Trend direction on the daily is important, but each day lives for itself. There is potential profit to be gained even within a downtrend- If you're nimble
I'm going to have to adjust my trading for the next few weeks due to a very tight work schedule and limited computor access- I intend to monitor my trades when the opportunity is there and adjust stops etc- but this puts me in a position of having to make trades with wider stops than I would like.
Intraday, I use a 5 minute chart to follow price, and a 15 minute chart to determine realistic intraday support levels. Going into the close I will strictly use the 5 min chart to chase the price action and try to squeeze as much as I can from the trade, with the stop being raised bar by bar the last 30 minutes if I have the time to monitor.
I try to wait until after 10:00 or 10:30 to determine which direction the market will try to go. This past week, amazingly the market trend has sustained an up move, and notably the low of the opening bar for the past 3 days was not violated further by price the rest of the day.
This is rather extraordinary to what I have been accustomed to- Forgot to add that the 5 min charts are more volatile than the 15- Point still remains, the market has been stabilizing for 3 days- and going higher.
Friday showed a great deal of buying strength until the last few minutes at the close- market wide when profit taking took a little off at the EOD. As I look at those chart patterns, I realize the 3 day uptrend is likely suspect to continue unabated. However, the daily chart shows me a first consolidation above resistance- So, I'm optimistic.
I'm taking a buy-stop entry for DDM, QLD, SSO above the highs made at the EOD on Friday- I expect a pullback Monday at the open , with a move to continue higher- The worst thing is a spike high at the open that engages my buy-stop and then price rolls over , declines, hits my stop , and then moves back higher.
This is the ultimate stop-loss nemesis each of us faces. Note that all 3 are trading in tangent with one another.....
The issue becomes one of where to place stops: A daily chart trader should likely use a stop below the prior low, or something close. ILooking at the charts, this results in a 8% loss for these 3 stocks .
I've tried to look at a way to reduce the loss technically using the 15 min. chart- Instead of arbitrarily using the 8% loss, I'm taking a buy-stop entry above the high, and setting the stop just below the first substantial price support on the 15 minute chart.
If price continues as it has for the past 3 days, I'll look like I've g a "system"- If not, I'll get whipsawed if the buy-stops get hit. This is where I'd like to be monitoring in real-time, but you take what you get.
What I'm thinking, is a buy-stop above the closing prices with a limit about $.10 higher.
The first line of support is where the price paused lower for even a few bars- This looks just below the slow ema for the 3 positions. A stop below the daily prior low exceeds 8% and is unacceptable.
DDM-34.10; limit 34.20
QLD, 29.50- limit 29.60
sso 28.30-28.40
Trailing stops average $1.10-$1.30. I would have liked to have made them less,. It's about 1/2 of what a stop below the low presented. Combined with a buy-stop, hopefully it gives the desired results- No entry fill on a downturn in price. 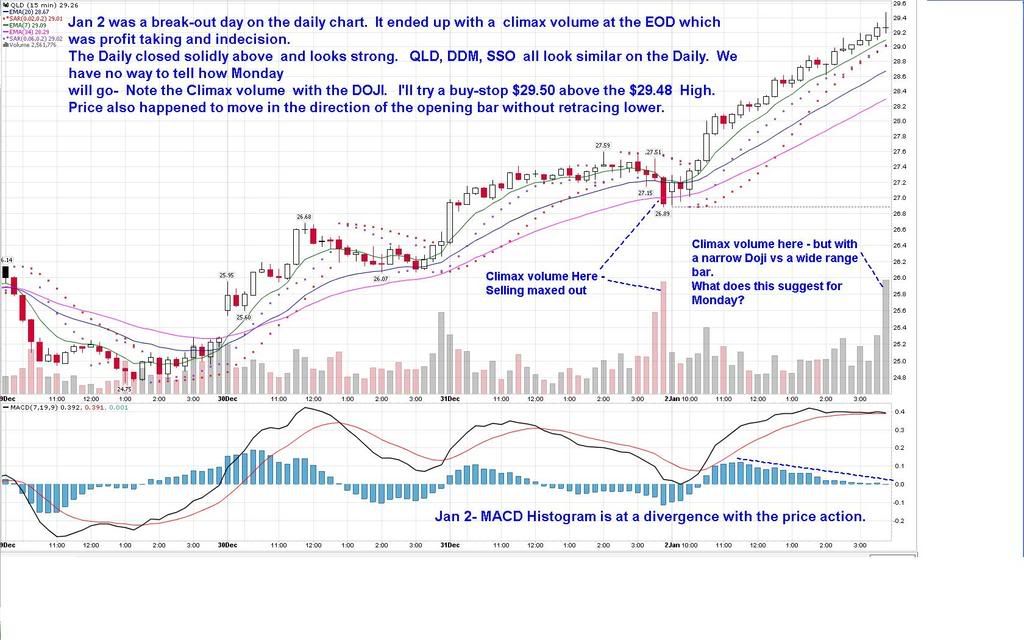 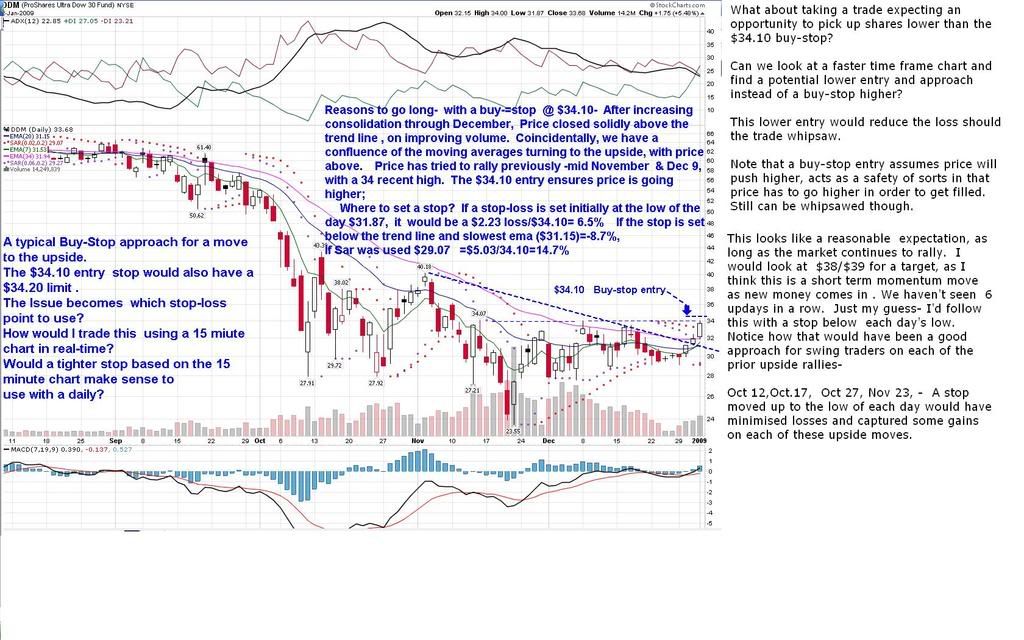 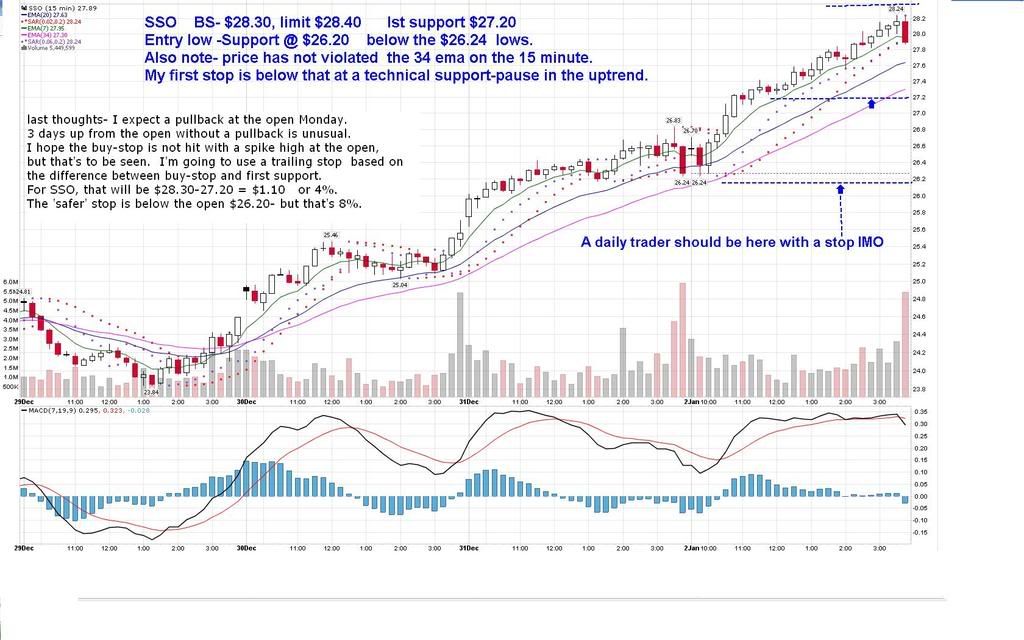
|
|
|
|
Post by bankedout on Jan 5, 2009 19:31:29 GMT -5
For the calender year, the net gain is 32%.
If I go back to my prior Oct. high, I'm up 12.8% over the 15 months.
What made the difference was my willingness to pay more attention, apply more discipline with very tight stops, and to apply a different strategy instead of hanging onto the swing type I was comfortable with last October. You did great sd, and it was fun watching it happen! I hope your success continues in 2009 and beyond. |
|
|
|
Post by sd on Jan 5, 2009 22:29:25 GMT -5
Thanks Bankedout. I appreciate your comments, and I'm glad you were able to watch it happen - Regardless of where this learning process takes me, this momentary success is also very much due to your willingness to contribute to the learning process -way back when, and I have hoped to engage some others in the same way with a willingness to be open and adaptive to different trading approaches in different markets..
We'll see what 2009 brings.
I can only say that I have been truly engaged in learning and studying price action in the past 5 months in ways I never considered before-and my trading is far the better for it. And it's an on-going process as the market forces change . And also as my personal time situation changes.
I try to post here to inspire other traders to consider other methods if they are not satisfied with their present results-It may not be my method, but there are alternative methods that traders should not allow themselves to only apply stagnant approaches that worked well in one trending market.
I'm not sure that my adaptive approaches will work over the long -term- I now would prefer to trade in real-time , but my job responsibilities tend to interfere , so I am considering to adapt somewhat- I.E. the trailing stop posts of late. Boy do I want to take a longer lunch!
Seriously, for the one or two readers that may come by this thread- I will pass this on - Limit your losses to 1% of your portfolio value. Only allow 1 trade to use 10% of your portfolio net- this is a basic in position sizing, learn to trade first, make money later. If the premise for your trade is based on technical analysis, and price breaks down- Well, thats OK, Suck it up and take the loss
Also, this takes a lot of personal time .- If it's not worth it, don't do it- Grill a couple of steaks, enjoy life . Raise the kids.
All that off my chest.
Thanks Jim- I hope I met your expectations of integrity-you set the bar- SD
|
|


