|
|
Post by blyghme on Nov 23, 2008 20:55:29 GMT -5
I trade at Fidelity - and I am not getting my stops executed at the stop-loss price - Is the market just too volatile? and, lord knows, options are so expensive. The market cannot be trading on fundamentals - earnings are more stable than 500 point swings indicate. How can the volatility be explained? Baby boomers who can't take it any more as they watch their retirements go up in smoke -I think this has a lot to do with it. Hedge funds liquidation? (another part) - Banks and Insurance Cos. raising capital to meet obligations (pension funds, annuities, trusts etc) (another part) - the question is "When will the $5 trillion in sideline money come back? With a rise in confidence? I think we may be seeing the beginnings of this. The drop in bond prices during the week ending 11/22 plus a rise in stock prices indicate a switch from bonds to stocks. The forth coming week 11/23-11/11/30 will tell us a lot? If it is three steps forward and 2 steps back - this wll be the end of the bear market. If the merket falls further - go short
Blygh
|
|
|
|
Post by sd on Nov 24, 2008 5:34:25 GMT -5
Good Ideas-
Possible market rally this am wth Obama stepping in -May try UYG at the open with attached trailing stop-Like the lunch idea though- Time to go-SD
|
|
|
|
Post by sd on Nov 24, 2008 17:59:01 GMT -5
Reply to Blygh #30 I've been fortunate with stops getting properly executed with IB-Not always at the exact stop loss though- and that is volatility in price swings- but most are within a few cents , and occaisionally a penny or two to the good.
I have had to be careful on the order page though, when I put in a buy-stop for example, I also attach a "bracket order" which sets a limit high order and a stop-loss order.
Once the position is filled, the remaining orders go to the "pending" page; several times the stop is not there while the limit sell is.
As for when the $5 trillion in sideline money will step back in?
I think this is a huge wake up call for individual and institutional investors alike- Smart money will likely wade back in, but there's going to be a lot of disheartened investors that may not feel it's worth the risk.
When the investing public become aware how fragile our system had become- well, maybe there will be more swing traders than long term investors...
There are still a lot of potential bankruptcies ahead, unless the gov't just bails everbody out.
We got back to some support levels recently broken- Saw Carter Worth- Technician on Fast Money believing this is where we'll be stuck in a trading range for a while now-
Ought to be interesting-SD
Hope I fixed this blue color back to black- I was trying to experiment with color on one post and lo and behold, the whole thing changed!
On one of these rallies, perhaps this one- we will see sectors separating, and quit marching as all-in-one lockstep. Some will rally higher, and others will falter, and that will likey be when fundamentals and future earnings become relevant.-
|
|
|
|
Post by sd on Nov 24, 2008 21:04:34 GMT -5
I've got computer issues- had to restore my drive-
Did trade UYG and UWM today and had a chart but I've lost hours trying to get on line.and back to the IE I use.-Testing my limits.
Hope to get it squared away tomorrow- too late for me tonight-SD-How can I fix this light blue color print? Thanks-
|
|
|
|
Post by dg on Nov 24, 2008 22:36:19 GMT -5
sd:
Sorry, but the light blue print is the result of a change I made to make my global header and footer show up against the new background. Any time you want to change it in your own message, all you have to do is invoke a color command at the start and end of your message (as I have done here to make print black).
example with left bracket missing so it will show .....
color=Red]...... message.....[/color]
...... message.....
|
|
|
|
Post by dg on Nov 24, 2008 22:57:47 GMT -5
sd:
You'll be happy to know that I found a lighter wallpaper design, allowing me to return the header, footer and message print to black.
I suggest that you take some time to learn the commands here at this site so that you will be less helpless. I have identified how one can manually use each at the general board.
Per you question of how to control print size, use the print size command. (Note: I have omitted the necessary left square bracket so you can see the command. This makes it inoperable in this post). Current size is 2. Next size up is 3, etc.
size command:
size=3].....message.....[/size]
color command:
color=Green].....message.....[/color]
combined operation:
.....message.....
|
|
|
|
Post by sd on Nov 25, 2008 17:51:22 GMT -5
Thanks DG for the helpful explanations! I'll check out the other directions you have posted- I had looked for a help section to explain the tags- I now understand - tHE BRACKETS NEED TO ENCLOSE- BEGINNING AND THE END.I'm trying print size 4- see if I got it-SD
|
|
|
|
Post by sd on Nov 25, 2008 18:01:38 GMT -5
Got it-Thanks-I thought I had changed the color!
|
|
|
|
Post by sd on Nov 25, 2008 19:06:51 GMT -5
Reply to #33
Today is Tuesday-Nov25, 2008 didn't look at a computor screen all day-I'll post Monday's trades,
Friday , it looked like the market was trying to rally at the end of the day. Monday, there was potential good news awaiting- Obama was going to step in and announce his financial advisors mid day- Market has been extremely oversold.
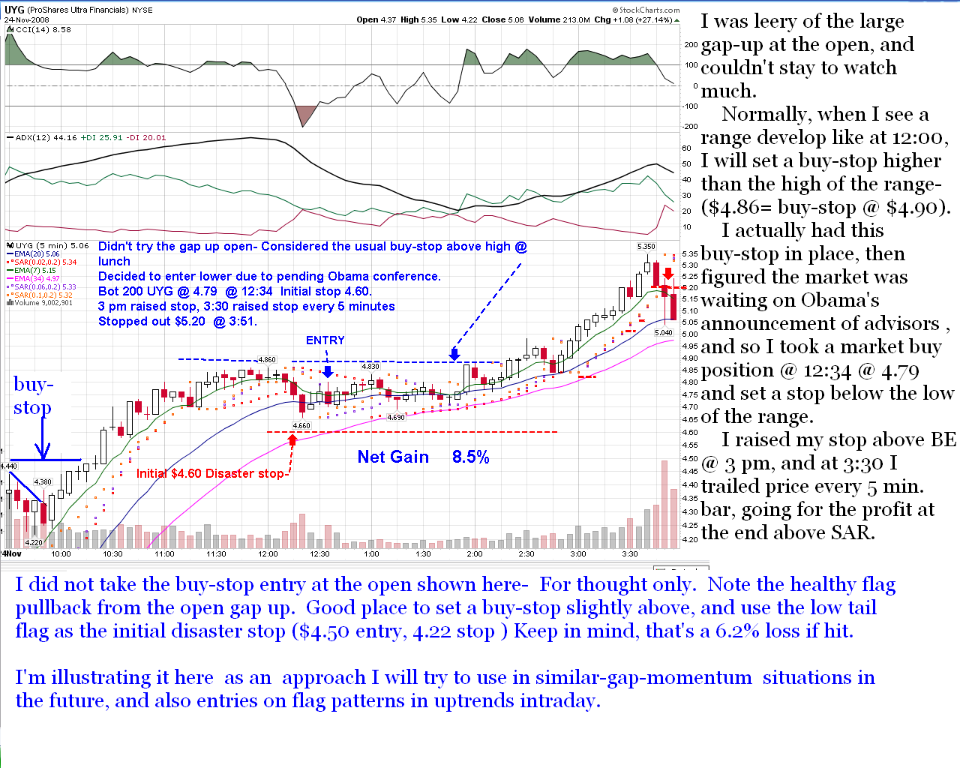
I caught the first few minutes of the open, and was hesitant to jump in because of the relatively sizeable gap up at the open- expecting it to back and fill some - I underestimated the strength of the market and didn't take a position then.
It did give me some ideas as to how to trade gaps in the future.
Take the high of the gap open, and if price pulls back , set the buy-stop just above the open high, with a stop-loss either under the low of the open bar , or under the swing low of the pullback bars.- Have to try to apply this in the future. This technique would also provide timely intraday entries - If price gaps and pulls back, buyers are taking profits. (FLAG) and then has the upward momentum to go higher than the gap high, a good place to have a buy-stop waiting for the fill on a higher high being made.
Seeing the actual price gap intraday shows up when you look at the chart in faster time frames. The daily chart only shows gaps from one day to the next. Even for a trader that trades the daily charts, Dropping down say one time frame to the hourly charts will give a bit more insight to how the stock behaved that day, and particularly how it looked going into the close, with volume and price giving a closer look. I had started doing that when I was swing trading- I think it helped - Try it out and see .
I'm off on tangents- At lunch, I saw price level out and drop into a trading range- This often happens - even the big traders have to eat. I initially saw the high of the day as a place where I wanted to put a buy-stop just above. This is my normal type of entry-
I knew about the upcoming Obama announcement , but didn't know which way the market would react but I was optimistic.
Instead of the buy-stop above the high, I entered lower as the price traded sideways.
This had the advantage of getting me in at a lesser price if the trade went against me, and also reducing the potential loss to my disaster (initial ) stop - which is usually below the low of the range.
In this particular case, the market behaved itself and didn't whipsaw me. I took the trade, and had to go back to work.
I stopped in later and saw that price had moved higher and raised my stop- and went back to the field. I had the opportunity to get back in near 3:30, and progressively continued to raise price with every 5 minute bar- At first I used a trailing SAR, and the last few bars, I closed below the low of each prior bar knowing I didn't intend to hold overnight.
The UYG trade netted 8.5%- Not bad for an afternoon entry!
I also entered later in the day UWM (2:25 pm) and also trailed stops on it, alternating from one chart to the other, raising stops.
It only returned 2.7% The 2 combined trades net 5.5% average,
but I had weighted UWM higher (slighly larger position size) , so the net was likely closer to 5% average.
The UYG chart:
|
|
|
|
Post by sd on Nov 25, 2008 21:37:55 GMT -5
As I looked over the short term charts tonight, and with the market taking a breather and relatively flat, I looked at the charts .
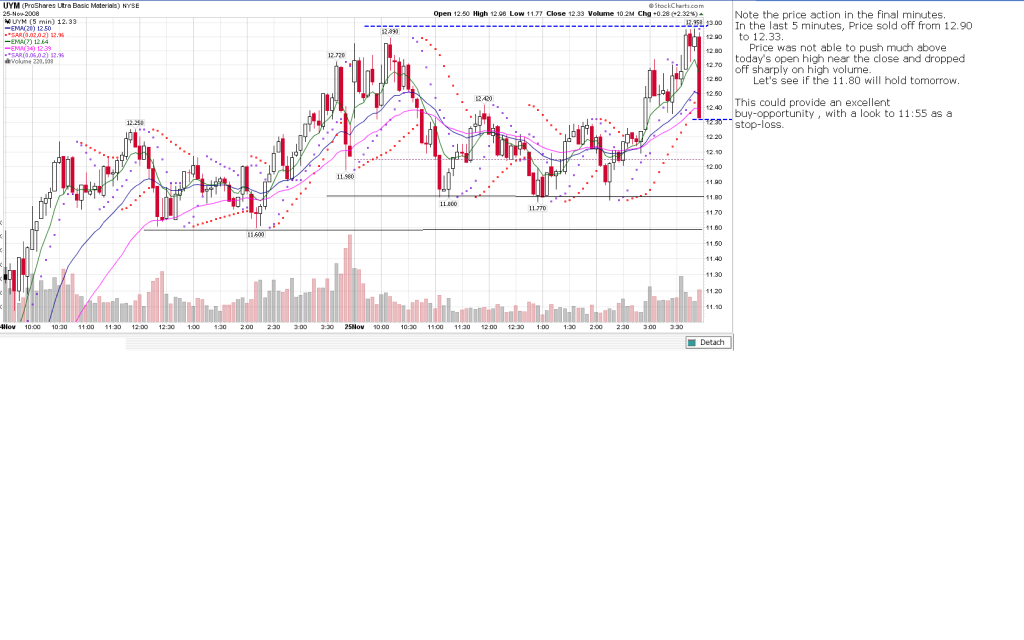
I was struct with the sell -off of UYM the last 5 minutes into the close.
This is where I think it is worthwhile for even a daily focused swing trader to look at the shorter tem charts- How did price act going into the close?
By looking at the selling, I think the open will be weaker in the am, and this may be an opportunity to think about buying UYM at the prior lower support levels if price goes lower at the open.
We never know what will happen overnight to affect the mood of the market.
I'm going to consider setting a limit buy at the first support level, and a stop just below the lower stop- This puts a minimal amount at risk, and likely only a 1/2 position.
|
|
|
|
Post by sd on Nov 26, 2008 22:23:41 GMT -5
Nov 26- Wednesday trades
The pre-market had the Futures down and some selling in the European mkts.
I planned to go short the market with SKF- shorts the financials. Market seemed undecided when I first checked about 10:30, and I started to toggle between SKF and UYG charts.
In the end I decided UYG was uptrending- and I found this surprising because I had expected a sell-off.
I went long UYG a partial position- bot 200 $5.51 @ 11:11 -
The trend picked up in the next few minutes and I added in another 100 shares -$5.61 @ 11:21.
I checked the market summary, and it was green across the boards
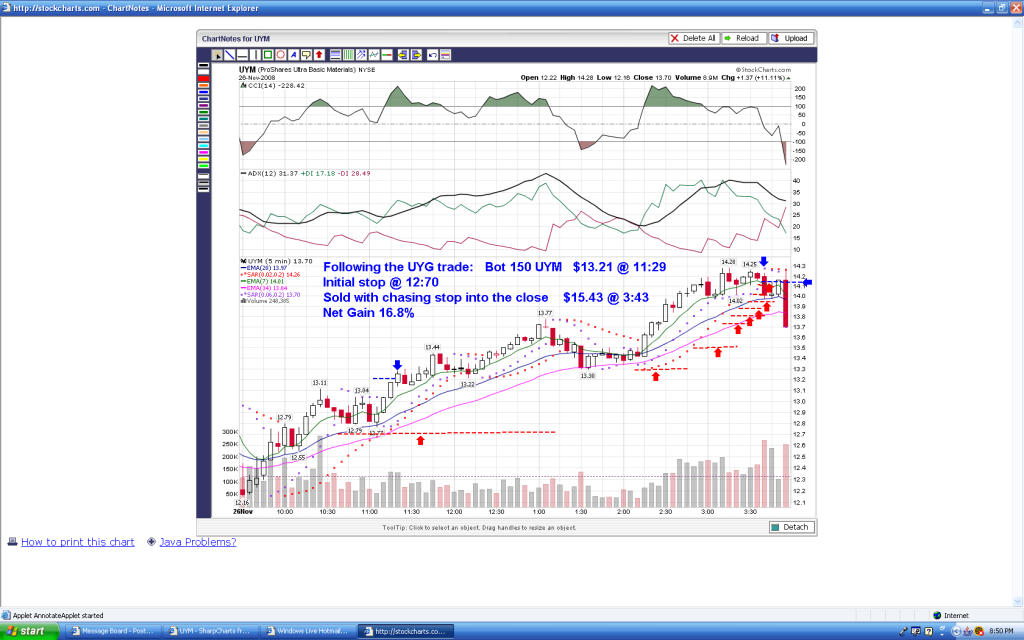
I bot 150 UYM -$13:29 @ 11:29,
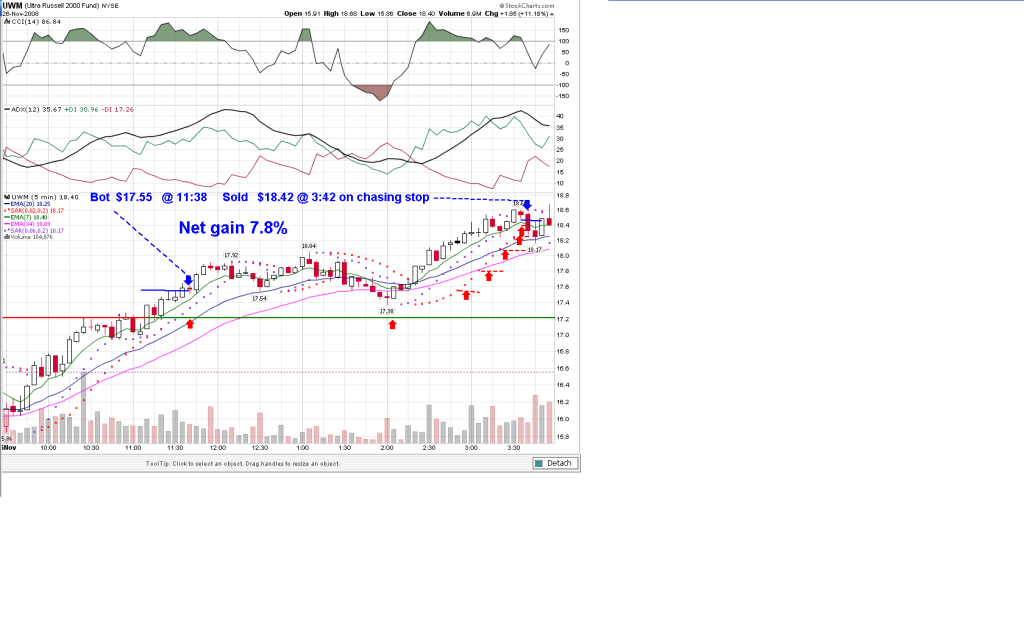
and bot 100UWM $17.55 @ 11:38.
I set stops below the trailing SAR and went back to work. I felt that a market rally was underway.
With these last trades, I decided I would increase my position size- Instead of an average position in the $1500 range, I boosted it up by 25% to approx $2,000.
This was not just a rash decision- I tend to err on the side of conservatism- and this is healthy when you're struggling .
However, when it feels like the wind is at your back, a-as today felt- kick it up one notch- because when everything is in your favor, take the advantage-
Previously I had put all my $$$$ into the market on 2 occaisions and benefitted substantially from it. This time I held myself to only 50% of the available cash. I want to be able to continue to keep some cash available, so only in the utmost extreme markets will I go all-in.
Mind you, I'm only looking at the charts and a glance at the market summary page- which tells me that everything that could go green is going green. The market can spin and reverse on a dime.
I had determined that if these positions started to break down, If I was at the computor at that time, I'd cut my losses before allowing my disaster stop to get hit.
Fortunately I didn't have that opportunity to witness the market pullback- intraday-
When I got back in after 2 pm, I was able to jump stops higher. I used the trailing SAR then and most of the afternoon. Having the initial stop below SAR levels was a key- Have to expect intraday pullbacks.
Later in the day, -I got to monitor the trades after 3:25 pm or so, found that price was trending up nicely in all positions.
and I jumped stops every few minutes, following the SAR on the 5 minute chart.
At about 3:40, the upwards momentum stalled, and I raised my stops to within a few cents of where price was trading-
I didn't want to cut the trade short and sell too quickly- there was 20 minutes till the close- Sometimes there's a big run into the close. On the other hand , I knew I didn't plan to hold any positions overnight, so I wanted to get the maximum bang for my buck.
My stops were within a few cents of the bottom of the 5 minute bar , and I took a snapshot . This is where the trades were stopped out at. Note how close the stop prices were to the active prices in all 3 positions. Squeezing the lemons a bit.
I am pleased with today's 3 trades- They netted approx $370.00- added over 3 % to the net portfolio while using less than 1/2 of the available cash. (about $5700.) At the peak the profit was about 425 that I saw.-but that was only in passing.....
I'm quite comfortable with today's outcome- I feel this method -in this market- has less Risk, and as much profit potential- as most others.
What should my goal be? If I could get just a 1% GAIN PER WEEK- That doesn't sound like much- but that would be a 50% return for the year.
Let's stay with Reality-=
The UYG trade returned 7.9%
The UYM returned 7.1%
The UWM returned 5%
The average trade is close to 7%, and the net Portfolio gain is over 3%. For the more astute traders with a spreadsheet with formulas- they can do a precise weighting of their trades if absolutely equal amounts of monies are not allocated in each trade.
For any that crave that decimal point precision, I refer you to the title bar of this thread......
I'll include some snap shots - The trailing stops, and the charts on entry and exits-
And BTW- a Safe thanksgiving to All....SD
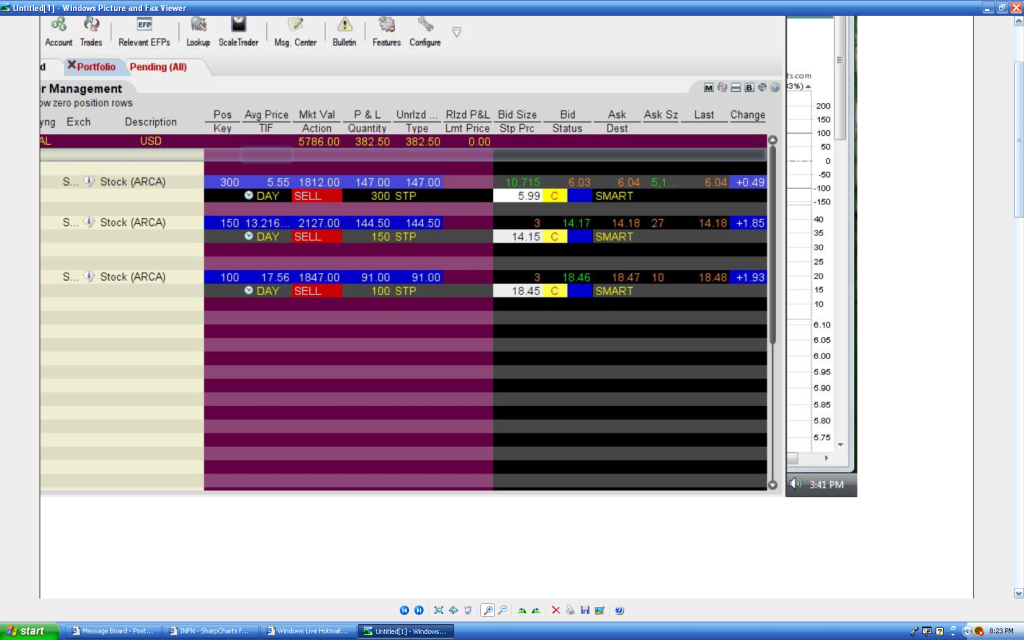
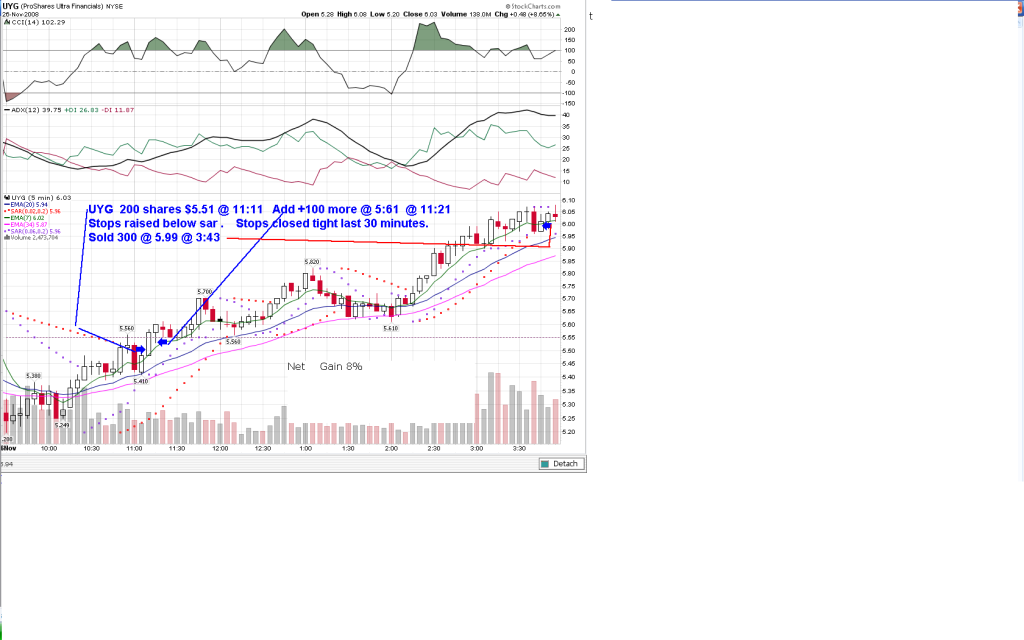
I think one of the keys to this type of strategy- knowing I don't plan to hold overnight, is to try to squeeze as much profit out of the end of the trade as possible- Trail that stop close, use that shorter time frame bar - and only leave pennies on the table.
I also feel this approach has less Risk than a daily swing trade approach-particularly in this volatile market.
While the daily swing trader will potentially make more money in a confirmed trend, This market has had a hell of a time just putting 3 days in a row in any direction. This week was the exception.
So, while I made some money this week on long trades, I expect to make money next week on short trades- but if that's not the direction the market wants to go, , I'll try to follow .
|
|
|
|
Post by sd on Dec 1, 2008 21:04:52 GMT -5
Isn't it just peachy-keen when the market behaves as you expect it will???!!! I was greatly surprised that the market put 5 winning days in a row together last week.
With that said, I would like to share with any person browsing the $44.00 gain I captured in SKF from last Friday to the close of today-
Unfortunately, that's just the wishful-fantasy side of my trading- the side that detects major market reversals in advance and positions myself accordingly- PO box is midway between Saturn and Pluto.
Considering the major market move to the downside that occurred today, I made a couple of trades and missed the boat by 15 minutes-
I didn't get to even look at a computor screen until after 11 am- The first thing I checked was the market summary page, and it was awash in red across the boards.
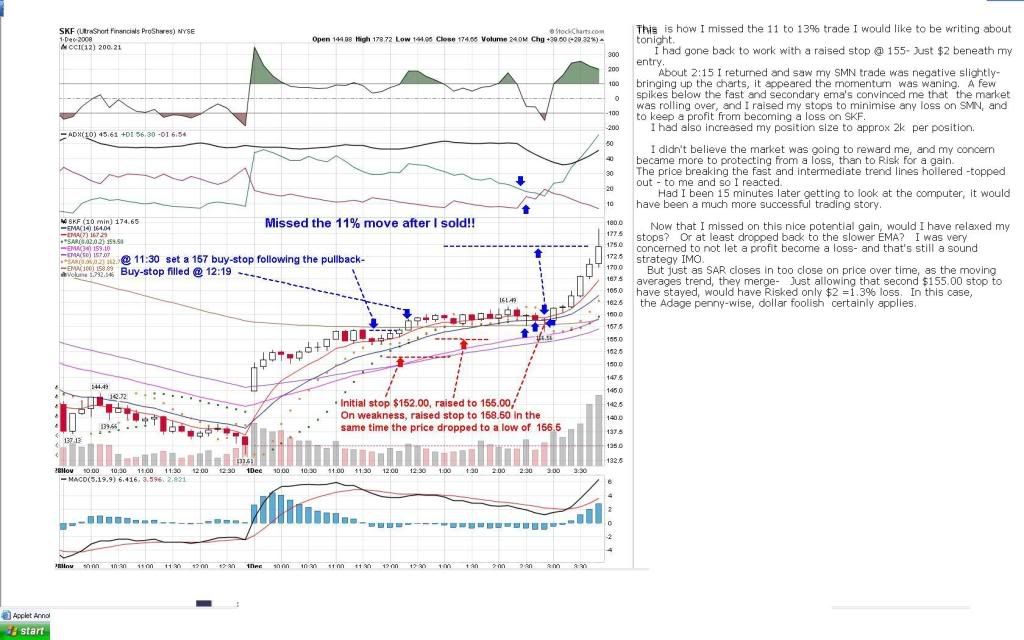
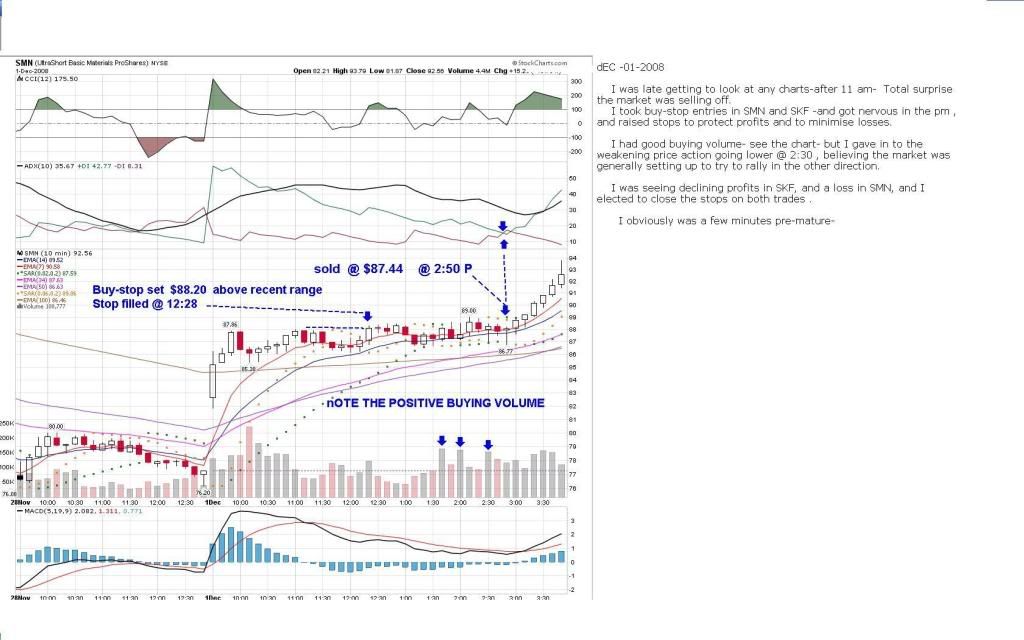
I knew I was late , but set buy-stops for the two ETF's that have performed well, and usually walk hand-in-hand- SKF and SMN.
The buy-stops are based on the shorter term charts, and usually try to pick out some swing highs that need to be overcome- or in this case, as I was viewing, some highs above the pullbacks intraday.
I held the buy-stops to only 2 positions- because the market seemed to be going into a trading range.. I did increase my position size on the 2 positions to about 2K each- a 25% increase over the $1500k 'normal' allocation.
I held off on going any further- It just felt that I had done this late and I wasn't comfortable with adding Risk.
Both trades got filled as price moved up in the trading range -
I'm trying to gain better entries by not always waiting until a range high gets taken out- A pullback in a range- ( Flag formation) may allow a better entry using a lower buy-stop.
Long story made shorter:
When I returned to the office later -post 2 pm, both trades had been filled- I initially raised both stops up closer to the low end of the range, and SAR-
When I returned again post 2:30, the trend lines were converging, and the trading platform was showing that SMN was starting to lose money.
Like it or not, this market hears the same tune, and often closely follows in lockstep across the boards. As the SMN trade started to decline, and become a loser, the SKF started to lose as well.
I tried to toggle between the charts, and ultimately felt that the market was rolling over and that a late-day rally was likely to follow. I raised my stops up really close to the price action to preserve what profits I had and to minimise the losses.
OK, you guessed it, I sold 10 minutes before the market sold off hard (I had short positions) . I sold into pathetic attempted rallies to the long side, and ensured that I would not sustain a large loss.
Trust me, I regret that I cannot regale any readers with the 2 winning trades and 11 or so percent gain that was possible in SKF.
I think I knee jerked reacted- Had I kept my secondary raised stops- the ones after the initial disaster stop on entry- I would have been able to capture most of those moves- That raised stop only risked about a 2% loss- I can afford to be wrong on3- 4 trades and only right on one by average , and still survive.
I paniced a bit - seeing my SMN position starting to go negative-At the same time, SKF strarted to sell off- And it seems that price can go down a lot faster than it goes up .
I raised a stop on SMN where I would take a small loss, and on SKF where I would loick in a small gain.
Both events happened, and then the market stasged a end-of day sell-off where I could nhave gained at least an additional 10%- By then , I had shut down the computor screen.
Had I been able to pay attention to this market, I hope I would have done much better- Today ended up being a washout-
We learn fastest by our mistakes-
I'm not sure what I've learned here- other than I should trust positive buying volume more, and perhaps a smidgen more lee way in the stops- and be willing to take a small loss.
SD
|
|
|
|
Post by sd on Dec 1, 2008 21:30:01 GMT -5
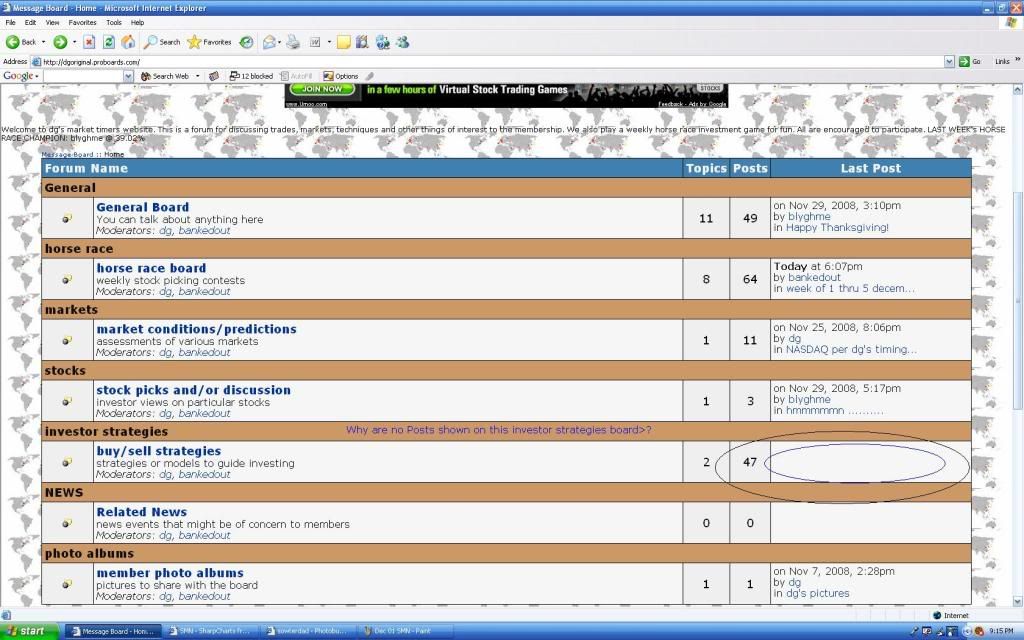
Question: When I look at the message board, and under Investor Strategies- I don't see any reference to a most recent post as the other sites have.
It seems odd that posts under this category go unlisted.?
SD
|
|
|
|
Post by dg on Dec 2, 2008 9:50:24 GMT -5
I'll check the settings for the board and get back to you.
|
|
|
|
Post by dg on Dec 2, 2008 10:02:23 GMT -5
I modified the setting on that board so everyone can view it. It was set for members only. What I don't understand is how it wasn't visable to you assuming that you were logged in.
Regardless, it should show for you now.
|
|