|
|
Post by sd on Nov 15, 2008 19:57:33 GMT -5
Thanks for the tip Banked out- I was actually trying to use the increase font when I typed in Reply- I expected to see a adjustable print size, color etc.
When I see the words- OK- likely will show up in preview - I'll test this out
and try larger print and let's see how it works
In preview it doesn't show any color change or increased text size- I will post this and see what happens
|
|
|
|
Post by sd on Nov 15, 2008 19:58:27 GMT -5
No effect- another day for that.
|
|
|
|
Post by sd on Nov 15, 2008 20:15:58 GMT -5
Reply to Post 12 I just brought up 5 larger market ETFs- Tracking the DOW, Financials, S&P,NAS< and Commodities. which I trade in and their counterparts. I used a 15 minute chart over 7 days, and what is striking about these is how close to one another they march- Within them is greater or lesser moves, but at a first glance, they all look very similar. and could all be traded similarly- I'd have to try to find a way to overlay one on top of the other, but I'll settle for the charts: 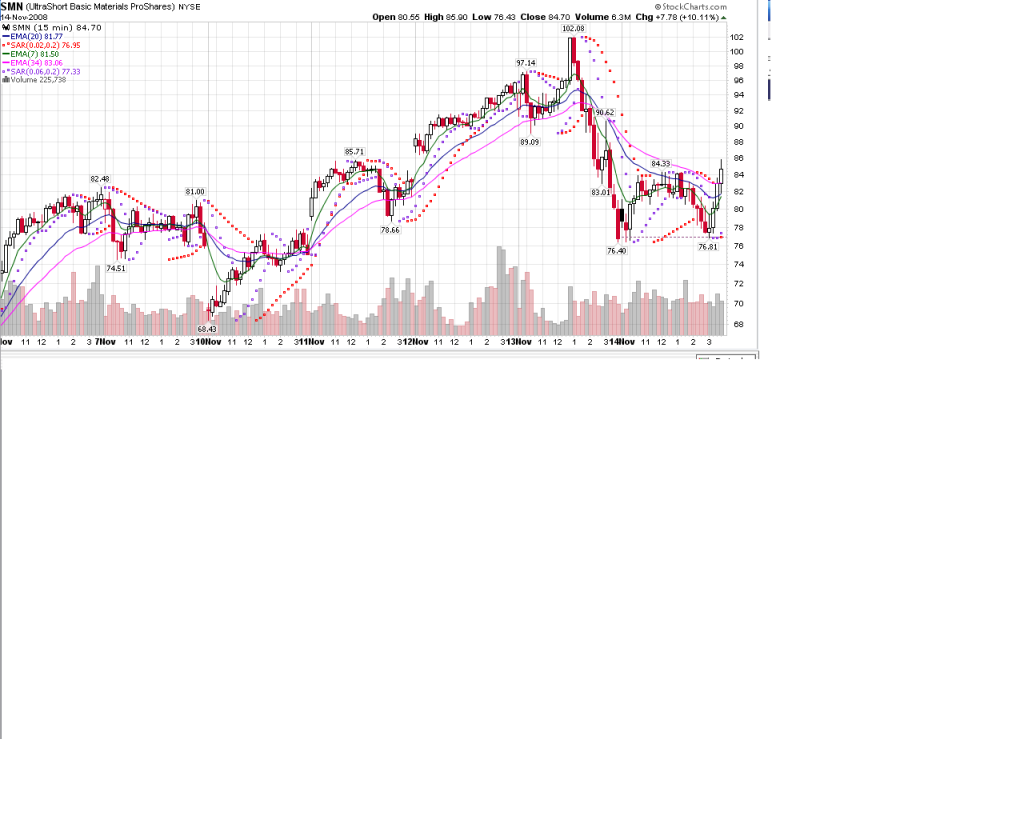 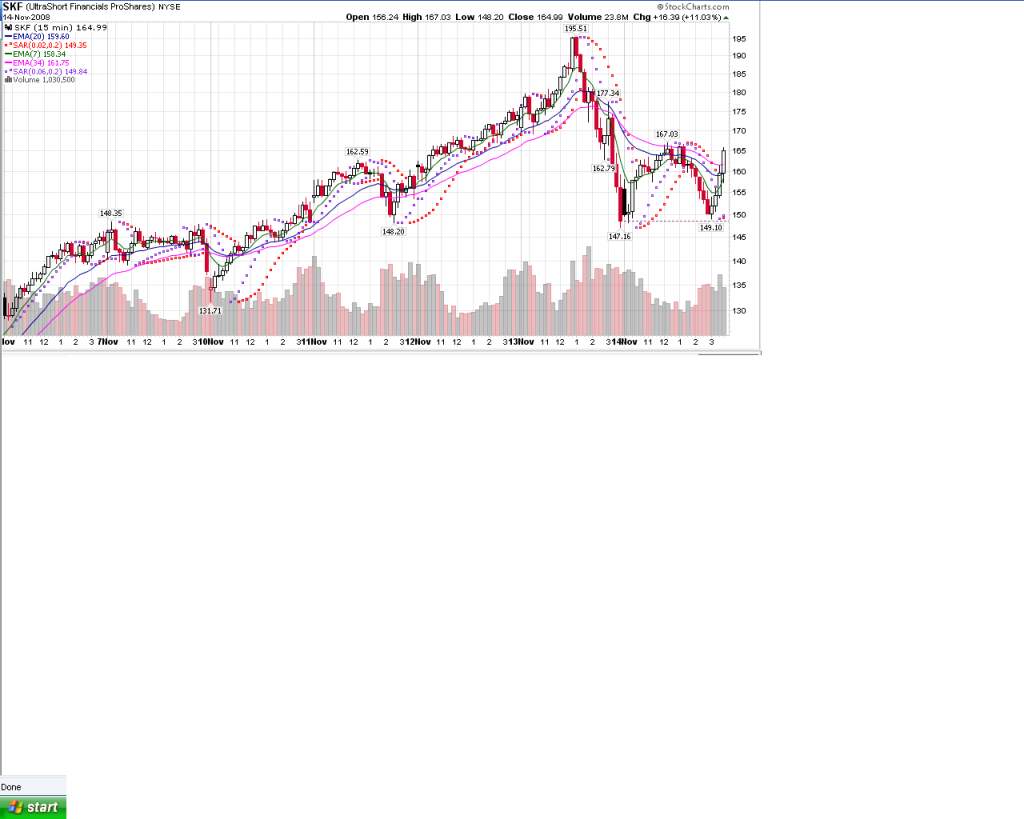 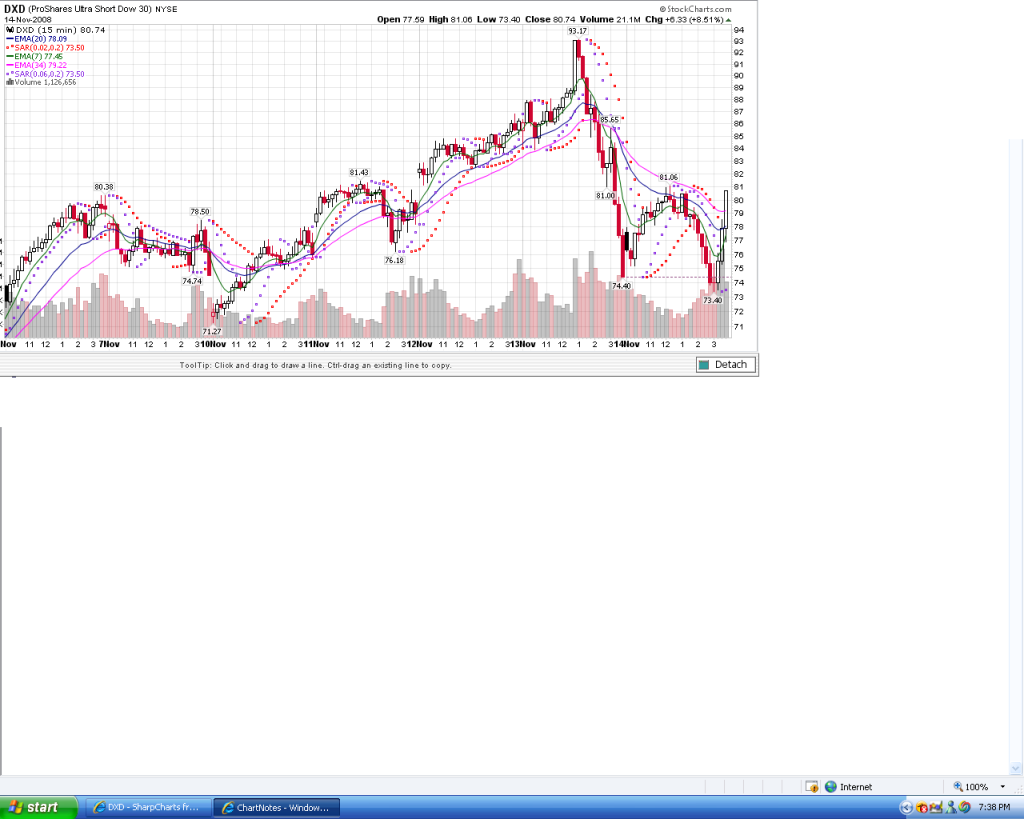 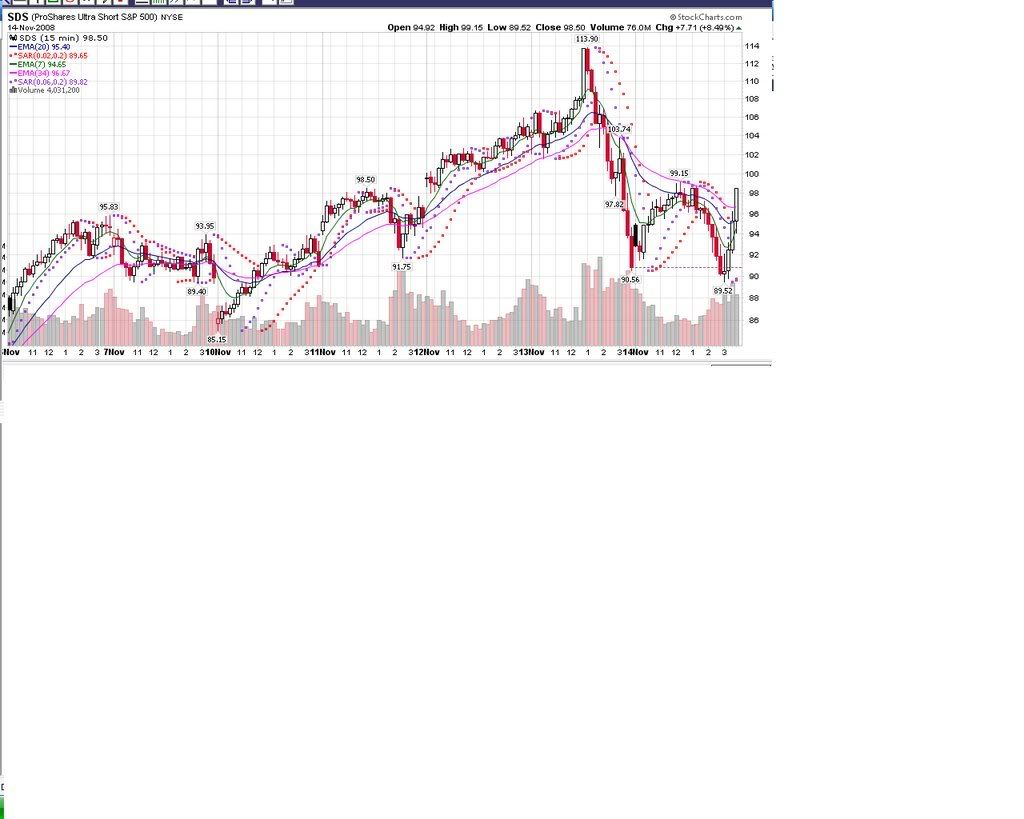 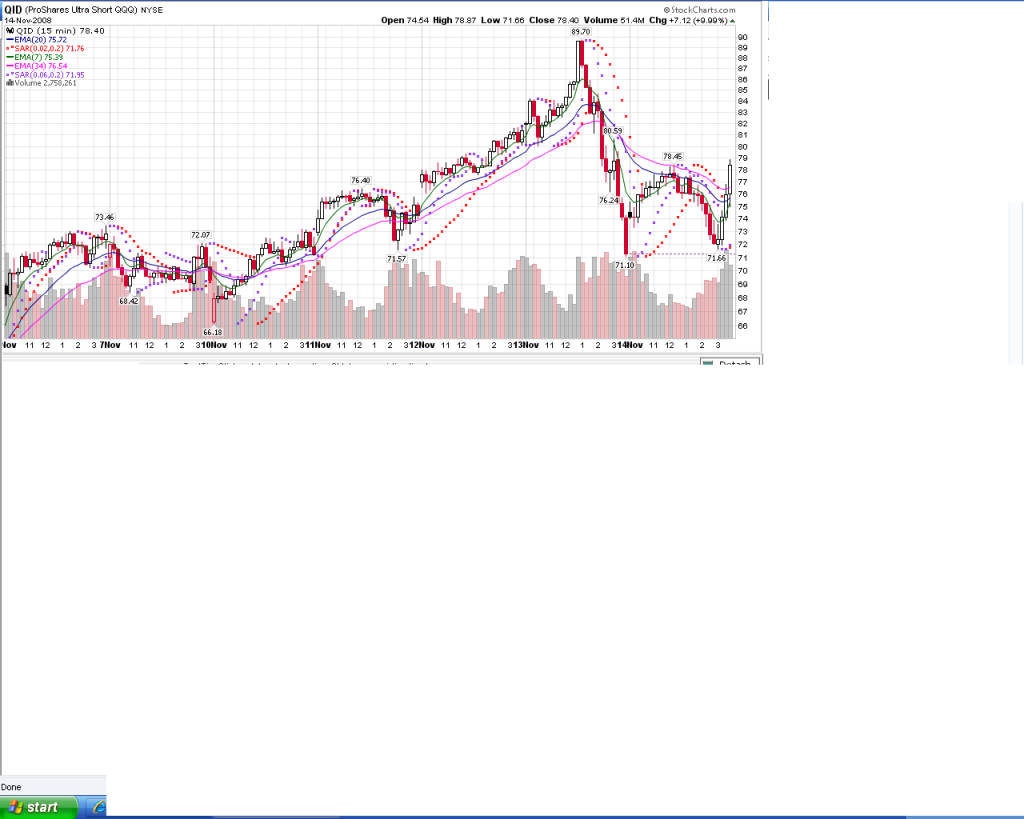 |
|
|
|
Post by bankedout on Nov 16, 2008 9:38:33 GMT -5
If they are all basically doing the same thing, you might as well just pick the most liquid one that has good volatility and focus on that one by itself. The liquidity will give you better fills and less slippage, and the volatility will give you a chance for larger gains. The focus on one should reduce the amount of time to make trading decisions and place your orders.
|
|
|
|
Post by sd on Nov 16, 2008 19:39:39 GMT -5
Excellent point to narrow the field- I'm heading in that direction-
I wish I had elected to do this a long time ago- I had believed I would do better by selecting from individual stocks - than considering ETF's- I spent available hours trying to look over numerous charts in search of select stocks, when the ETF's provide a broad brush target to discern trend with. The leveraged etf's give that added bounce that selecting an individual stock can provide. The advantage is that the ETF is not stock specific, so the sector pick can be with a shotgun vs a sniper's rifle.
While there is great similarity in the larger daily trends, there are obviously variations- I don't want to focus on just 1 area, but perhaps on 3 -4- Possibly in time I could reduce this to only 1 or 2 ETF's and their inverse counterparts-
As an example: Just this week I had 4 positions active which I had held overnight- They all had moved up together . I realized premarket the trend was not likely to continue, I had raised stops on all positions, and 2 stopped out on pullbacks at the open, one mid morning, and the last filled my limit order to sell higher (QID) . The one exception - returned 11% for the day and made the average 3 other trades from 1 to 3 % net an average 4%. QID eventually sold off as well.
So while the broader daily steps seem to be in unison at the present time, there are individual variations within . These variations will get wider as time goes on- eventually one segment will reverse step to the rest- Presently, I think the broad market -95% is hearing the same drummer.
Good point on the liquidity as well- There are some ETF's that go 20 minutes between trades with gaps in their price movements- The Industrial ETF is a good example Look at SIJ and UXI on a daily and then a 5 minute chart. To the average view on a daily chart, it compares to any other daily- Note the low volume though-
Drop down to a 5 minute chart and you'll see that no trades occur at all for extended periods of time- 20 minutes or longer, and when they do occur, price is gapping up and down- This is untradable IMO- when you can't discern a trend moment by mopment. So I totally agree that liquidity is a key ingredient.
While I think I'm inclined to focus on the financials- SKF (short and UYG (long) I don't feel prepared to be too specific. And this market will get to a point that it won't be in lockstep even on the daily charts as we evolve from here.
Different market strengths and weaknesses will emerge-
I noticed the Russel 2000 had a large % move intraday - last week . It coincided with the size of the financials.
While I tried to find inverse etf's to the leveraged short emerging markets (EEV, China FXP, EAFE-EFU, I could only find their 1:1 long counterparts. This lack of balance excludes these- or I would have to use 1:1 components.
For the near term, while I try to get more definition beyond a seat-of-the-pants- wing and a prayer approach, I'll settle to apply my trades to 4 leveraged market segments- both long and short.
While I am writing this post, I am also listening and watching to an intra-day trading techniques DVD made back in 2001(?)
by Pristine and Greg Capra where they were discussing how people were concerned about the economy and people losing their jobsetc.etc. And how it's been a difficult year for traders- How appropriate to today, when so many of us fear for the economy and where we and our loved ones will find ourselves.
Watching this DVD points out how unscientific and randomly lucky I may have been recently.
Here's where I will focus the next weeks:
Financials : SKF -short $165 Long UYG $7.00
Nasdaq: QID- short $78. Long QLD $ 27
Materials SMN short $ 84 Long UYM $15
Russel 2k TWM short 124 Long UWM $18.
The benefit of selecting from 8 potential positions, is that I will only have to look at 8 charts, 8 possible entries on my trading screen, and it gives me a wide market diversity- I can elect to choose from any or none.
This is getting close to the point where I need to develop some trading "rules" or guidelines that are not just a flip of the coin and how breakfast sits that morning.
While I try to refine this approach and give it something more than intuitive guesswork, i need to develop a plan that can be adhered to- and possibly modified to meet changing conditions:
Next post- Thanks, SD
|
|
|
|
Post by sd on Nov 16, 2008 21:27:13 GMT -5
Now that I have decided it makes great sense to only look at 8 possible trades, and 4 likely market directions,; I will narrow my focus to strictly these 8 possibilities ( Playing Gold on a dollar decline (GLD) may be an exception - and some emerging mkts long and short)
Qid short and Qld long;
Materials: Smn short, and UYM long
Financials: SKF -short and UYG long,
Russel 2K Twm short, and UWM long.
So much of our trading is based on the belief of what the market "should do" based on our perceptions of what should be important to the market.
50% of the time I am early or I am late- or just WRONG in what I think "should " happen based on my logical analysis of what the news shows tell me at 6 pm in the evening.
When I listen to the foreign markets behaviour over night, I expect a direct correlation - to propel our markets higher or lower- and that often only lasts for thirty minutes into the open , and to guide my predisposition as to which direction to go in.
By that time , I'm coming off morning break and am busy on the job- I don't know that I can continue to pull this off successfully- but here's my Nov. 17 thesis-
The market tried to rally and failed on Friday- Monday stands a good chance of going lower on all the indecision.
I believe the daily trend is down, and that major support for the indices will be retested and likely broken- The logical side of me says that should be happening- The optimistic side of me says I hope for all of us that won't happen- but that's the side that let's hope overwhelm reason.
Never the less, the market can be capricious, and go in any direction it desires ; despite my interpretation of what it "should" do.
Here it is: I will go short the market QID, SKF, Smn,TWM, and will go long their counterparts: QLD,UYG,UYM,UWM
These are bets on the direction the Nasdaq, Financials,Materials, and Russel 2k will go.
My strategy is not to be betting on where these ETF's will be in a week's time. My strategy is betting where they will be at the close of each day.
That is where I intend to close my trade. While i have had success holding for 2 days, I believe I would have been better off closing out after 1 day all in all.
I Going forward , I will try to document with specifics what I hope to achieve in my trades- and share them in more detail on this thread. I suspect that like most traders that find intermittent success, i will gladly share the winners and reluctantly acknowledge the losers- That's all about the human ego-= I don't know that I will have the time available to spend in this endeavor-
I get off on these large tangents as I try to rationalize my focus:
If I trade only 4 long and 4 short positions, it becomes a matter of position size and allocation.
Because of this market's volatility, I want to reduce risk-
Therefore, I will reduce each position size to $1000. - instead of $1500.00 . So, if at the open I have 4 trades on , I have only 1/3 of my account on the line to begin.
I reserve the right to add to each position 50% more should a substantial trend be developing and once the entry price
has been achieved, and the initial entry can be protected with a stop loss at BE. (breakeven)
SD
|
|
|
|
Post by sd on Nov 17, 2008 23:53:56 GMT -5
Today was a busy day, and I didn't get to take a break until later in the am. The market was down, and my IB screen showed that the short focused were all doing well- particularly SKF- I brought up some charts, trying to determine whether an entry was feasable. The tickers seemed to be declining a bit SKF had been up $12 and was dropping- as were the others. I went to UYG- the long financials vs SKF , and saw on the chart an attempted move up from the downtrend- which had failed. I like this type of set-up, because it defines a good buy-stop entry if it is exceeded later on - and the swing low from that also gives a stop level- And that is how my first trade for today was to go long the financials using UYG- I thought we had an intraday market reversal at hand- I set an order for 150 shares.-approx $1000.00. When I came back in, I saw my buy-stop entry had been filled, and I got to monitor the trade periodically at lunch- It appeared that the trend had some momentum, and so I added in higher- Of course, my second add-was also at the peak - and I saw the next bar decline sharply- I added 100 shares @ $6.62 that got me slightly over my $1500 maximum position size. I promptly raised my stop to just below the swing low of that bar- and the 15 minute fast ema, and went back to work. The 250 shares were stopped out for a net loss. Later in the afternoon I looked specifically at SKF and noted the tight trading range it had settled into- The one bar outside the range caught my attention and I took a position , and price retraced once and then started to try to move. I stayed with the trade going into the close- I had started off with a stop just under the range, and as price broke out above the top, I started to adjust my stop higher. Looking at the 5 minute charts, I lagged price by a couple of dollars, and in the l;ast few minutes the momentum picked up and I was expecting some rush to the gates which really didn't happen- But I had determined I was not going to be a holder overnight, and I think I had my stop within a $1.50 of the high at the close- Sold @ $180.92 @ 3:56 pm Neither a major loss nor a major gain- The SKF position was only 6 shares - but this can move large in one day. So today - That last 100 shares of UYG cost me . Otherwise, I would have made just a little both on the long and the short side- The point is, if you look at the charts, I did the right thing when I sold both positions. I limited my losses- and also incidentally locked in some gains. Had to work over until 8:30 pm tonight and possibly a few more- this may not be a smooth process, but I hope to post my actual trades and see how it works out going forward- Almost midnight now and 5  :30 am will be here all too soon- I hope to upload these charts and see what tomorrow brings: SD 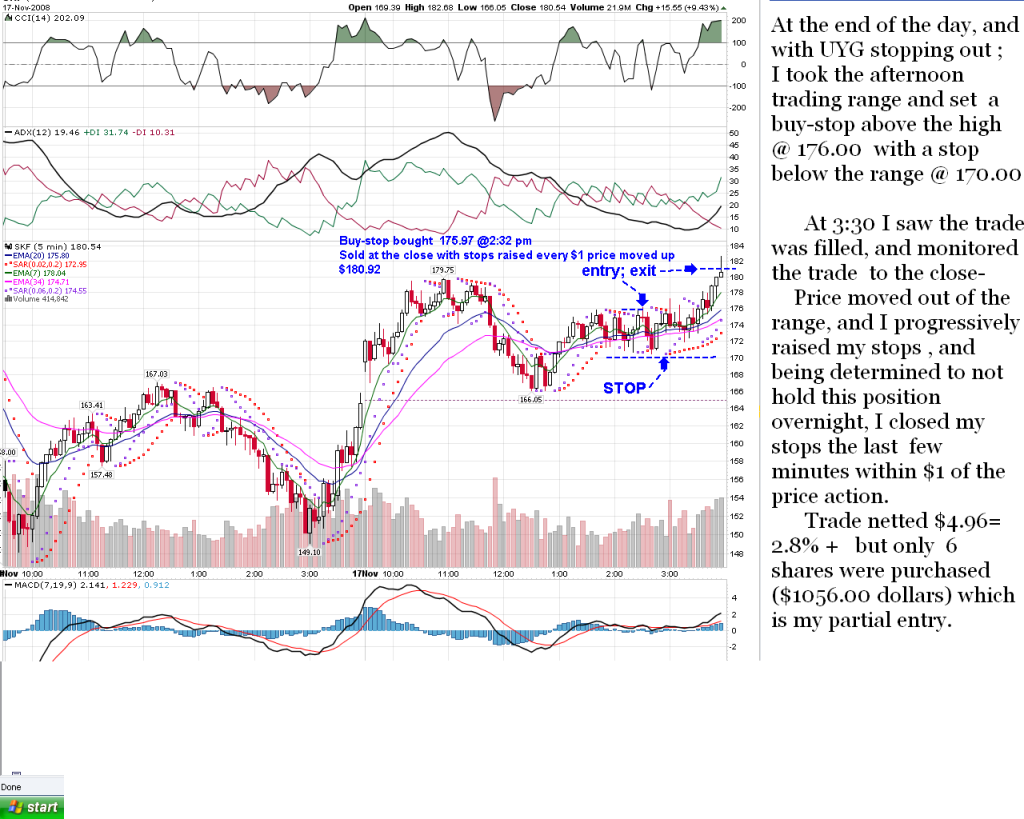 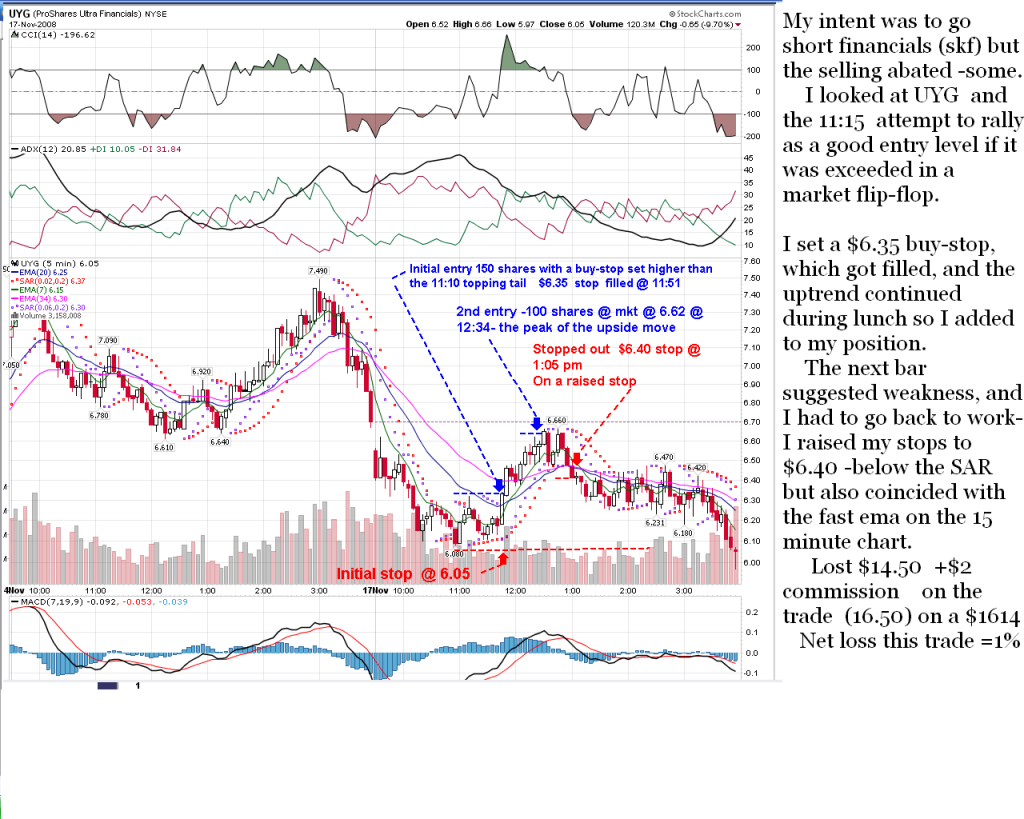 . |
|
|
|
Post by sd on Nov 18, 2008 23:37:04 GMT -5
I didn't see much happening today initially, and I had my 10 stocks on my trading screen, and my stockcharts up and running. I'll wait until after 10 am regardless of any itchy trigger finger- because often price action does a 180 degree flip. Things seemed to be muddling around, and then SMN had a change in direction. I took 2 positions today- which turned out 4+% profitable each. Dollar wise this is nothing to crow about- and wouldn't buy the groceries. The point is to try to make more successful trades % wise than losing trades- The exact $$$ are not critical or relevant- Work and think in % gains and losses imo. These were both buy-stop entries designed to enter only if price exceeds a prior level set that day or previously- I view this as a short term resistance level- If price previously failed to take out this level, ideally , when and IF it does, it should do so with some gusto and positive volume. I didn't get to sit and watch these trades all day- had work to attend to- One worked ideally-TWM, trending up steadily; and the other- SMN retraced hard- had I been watching, I might have been tempted to cut the trade off before it hit my initial entry stop-Which essentially is a disaster stop at the entry- I then adjust it intraday when and if I get the opportunity. As an example, before I had to leave today, I had moved stops on both trades to above Break Even (BE)- Using the 15 min chart and Sar levels there. When I got back and had a chance to catch my screen, I saw the profit potential dropping rapidly in a few minutes- In the 5 or so minutes I was watching as price staggered, I moved my stops progressively closer with both positions- just looking at price action- I didn't want to sell outright with 20 minutes left to the close, yet I didn't want to risk profits, so my stops went to $1 below price, and that worked well- Had I been a little more trigger happy at the EOD, and possibly chart watching , I could have improved my trades with a higher gain and earlier exit- In the end, If I had not taken the profits, I think the trades would have been losing vs winning. The impact of these 2 trades making 4% -on the trade itself , does not impact the overall portfolio greatly. Each trade only represents 1/12 of the port value- I had more available cash, but held off beyond these two positions. Most of us are trend traders and use daily charts- and weekly . I think it's useful to also look closer at how the trade held up and maybe get some insight into how it closed by looking at a shorter term time frame to really get a snapshot of volume and momentum. Shorter term charts for those that trade the daily- may prove advantageous. Say a 30 or 15 minute look of the prior day or two's price action - Always keep in mind the trend direction the longer time frame chart suggests though- and probably go with that direction. Tomorrow is meetings in the am, and so I have no idea if I will even be able to look at a chart-SD The 2 trades today: 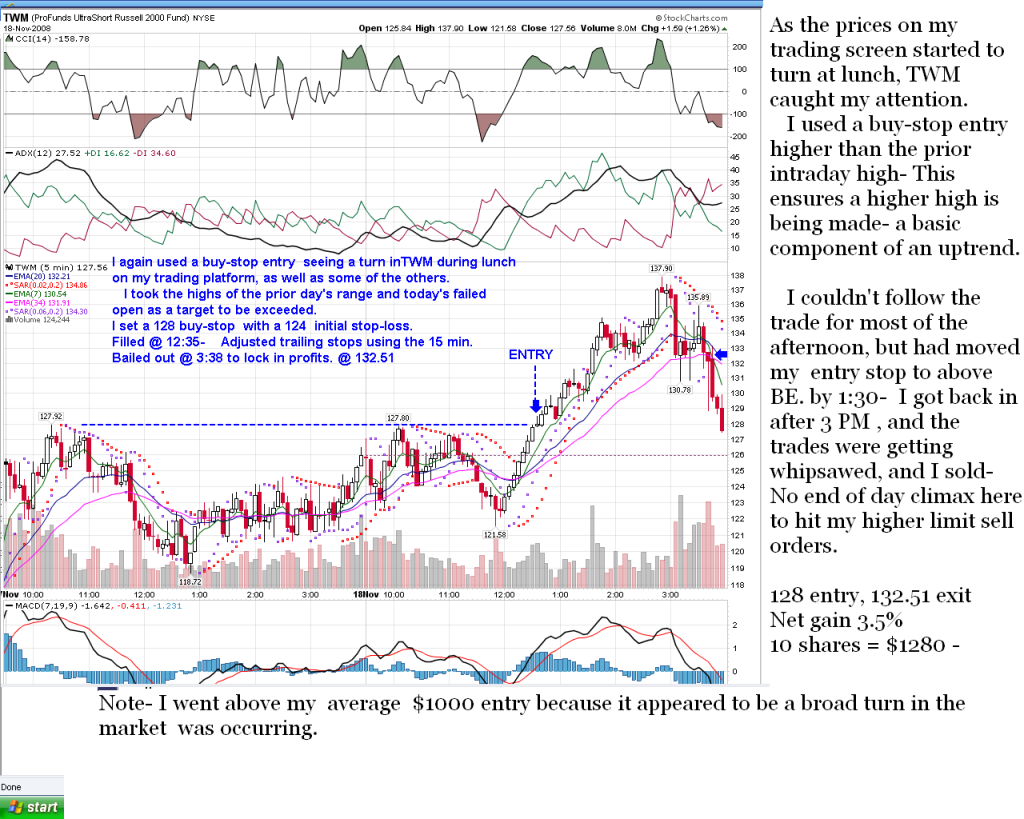 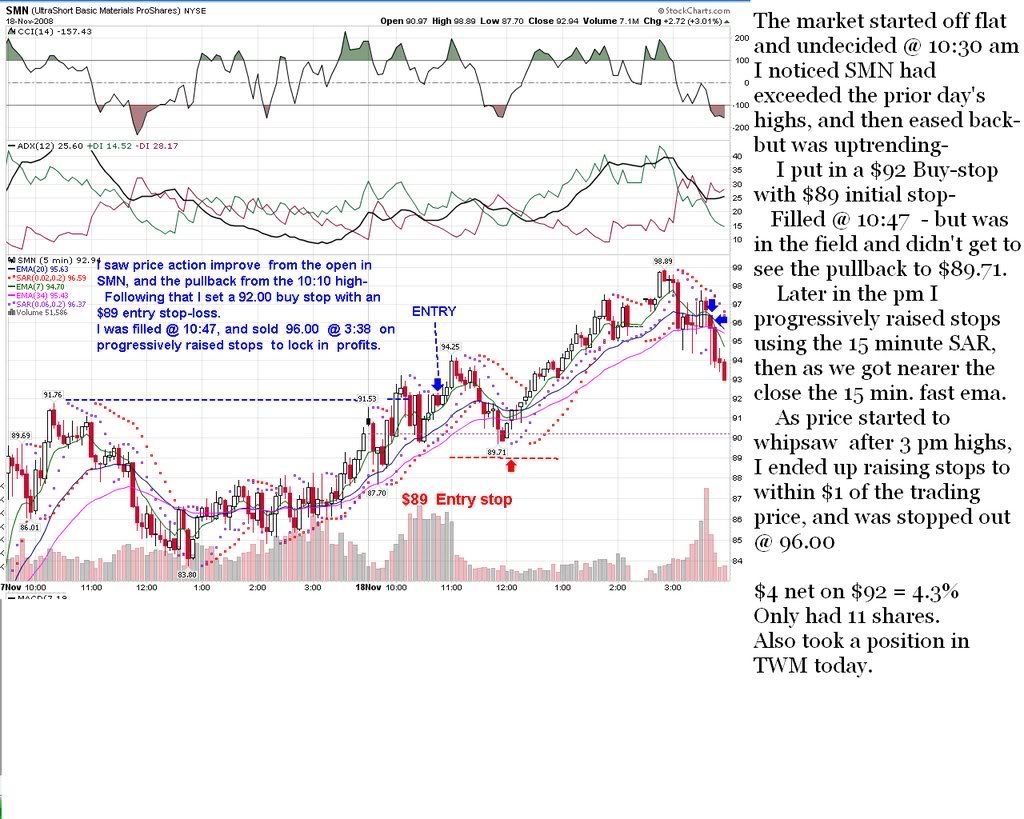 |
|
|
|
Post by sd on Nov 19, 2008 20:59:58 GMT -5
NOV.19
I had meetings all morning until past 12:00- Hate it when the job interferes with this sideline-
Once I brought up my trading screen and charts, I realized this was a big down day, and the trend was already well underway- I had clearly missed the earlier entries, but I didn't know when this down trend would cease. For all I knew, this was the market about to crash- I chose to take positions to the downside although the trend seemed extended.- The trading day was still early.
I ended up making 4 trades today -this afternoon-
I shorted the Russel with TWM @ 1:31 pm @ 141.92 and was stopped out 20 minutes later @ 155 @ 138.11 Loser. -2.7%
I shorted the market with SMN @ 1:31 pm @ 102.63 and sold @ 107.75 @ 3:48 pm.Winner. I chased this one going into the close with a 1 minute chart raising stops every time price moved up $1. I was determined to lock in some gain. Net gain about 4%
I shorted emerging mkts (EEV) @ 1:35 pm @ 107.00, and sold @ 3:40 @ 108.50- again raising stops into the close.Net 1.5% gain.
And my mistake trade today- I saw the financials Short - SKF lose $3 and I thought I would hedge my short positions thinking a possible afternoon market reversal was about to ensue.
I went long the financials on a 5 minute chart thinking this was the bottom and a reversal was in the offing.
I used a buy-stop off the $5.02 lows @ $5.10 (2:10 pm )
and got confirmation when I was proved wrong some 20 minutes later @ 2:36 pm and my $4.98 stop sold @ $4.99.
OK, that's only $.11 off my entry price, but it was far enough to show me that price was breaking down - A small move like that is a large % move . $.11 loss= 2.1%
I think I ended up just slightly ahead for the day- basically a waste of tying up free cash and trading potential.
i expected a MARKET REVERSAL eod AND THAT DIDN'T HAPPEN
I think we've had 4 days closing down in a row- this should confirm the down trend- and see what happens if we break out to new lows! SD
|
|
|
|
Post by sd on Nov 21, 2008 21:30:13 GMT -5
i DIDN'T HAVE TIME TO DO ANY CHARTS OF THE TRADES I'll try to add them in tonight - tHE BENEFIT OF MAKING THESE CHARTS is it gives me time to review them and to see what was good -or bad- about the entry/exit. The first chart is UYG- I made a mistake and jumped in here because I thought a market reversal was going to happen as I watched my short positions wobble on the trading platform. A very sloppy entry - not based on the chart- I got greedy and early- 10 minutes after I got stopped out was a legitimate time to have tried to enter , as price moved up on higher volume and challenged the previous intraday reversal attempt. That prior point would have also been a good spot to use a buy-stop entry just above. I set an exceptionally tight stop because I knew it was risky, and I got what I deserved- It was a small loss- but more importantly, it took the available free cash lower. 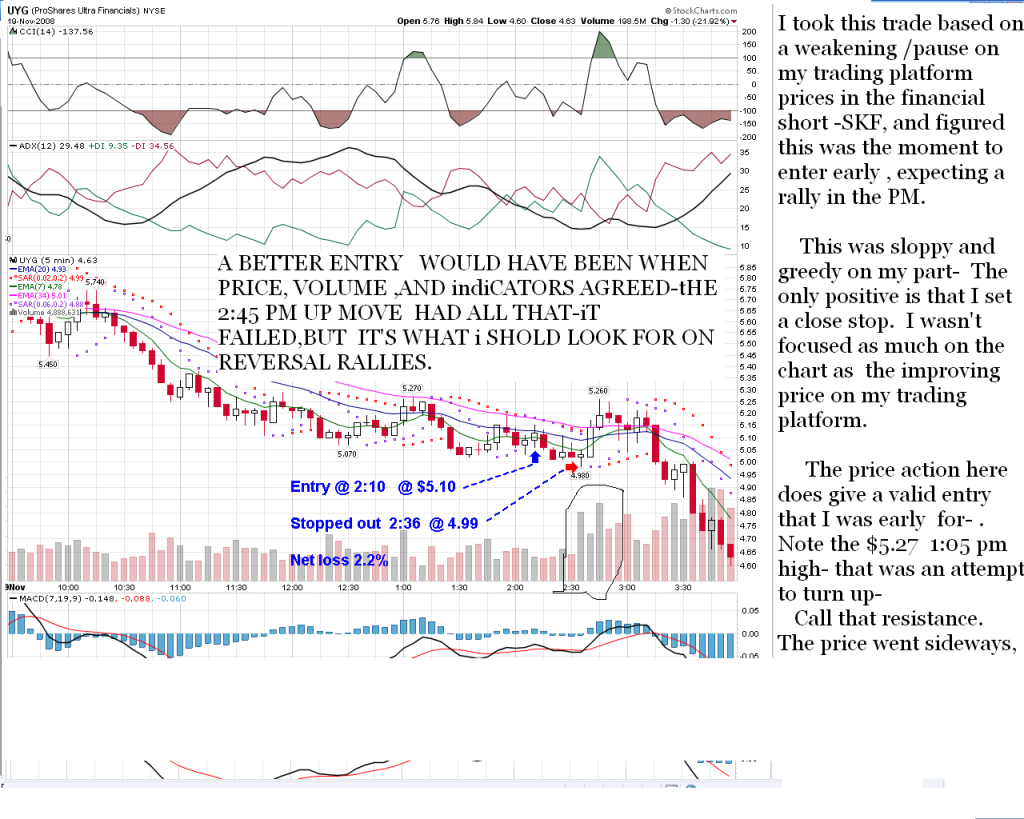 The UYG trade was the last for the day @2:10 I took 3 other trades @1:31 1:31,1:35 on focused on the short side-TWM,SMN,EEV and TWM became a loser. 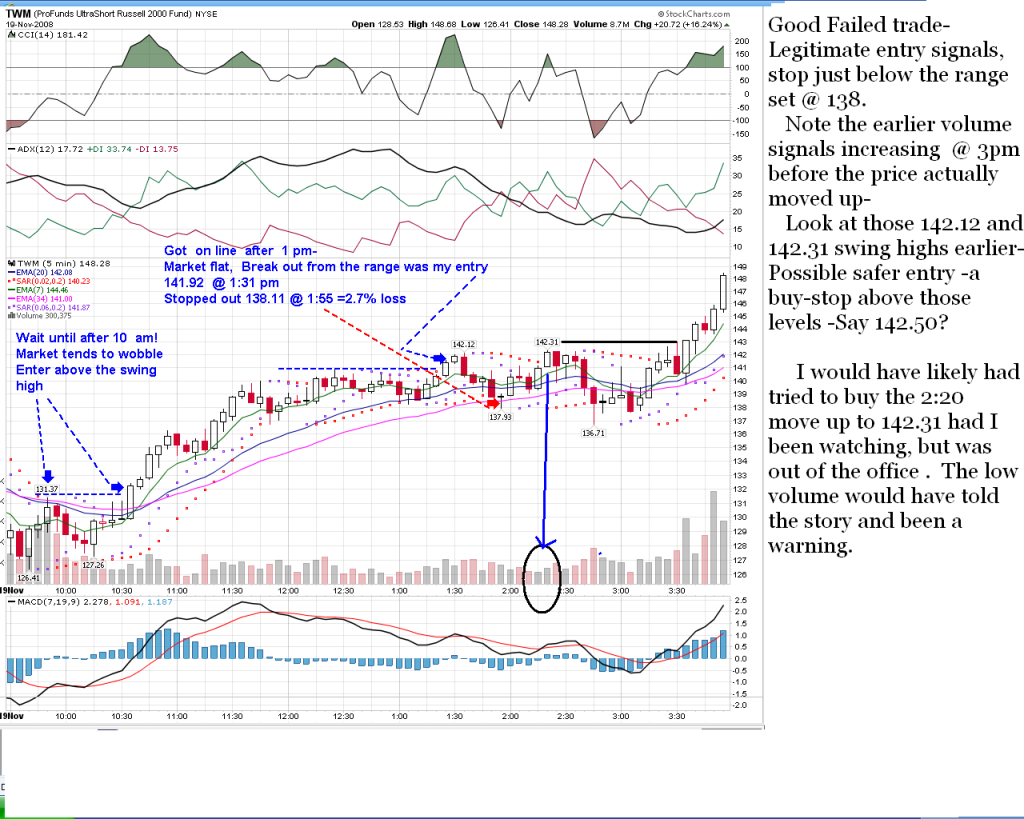 The SMN trade became a winner- Again, I was unable to watch this trade much after entry- duty called- As I saw price moving up fast into the close, I started raising the stops progressively tighter every couple of minutes. I was determined to lock -in a gain and often the market sells off at the end of the day in the last minutes. 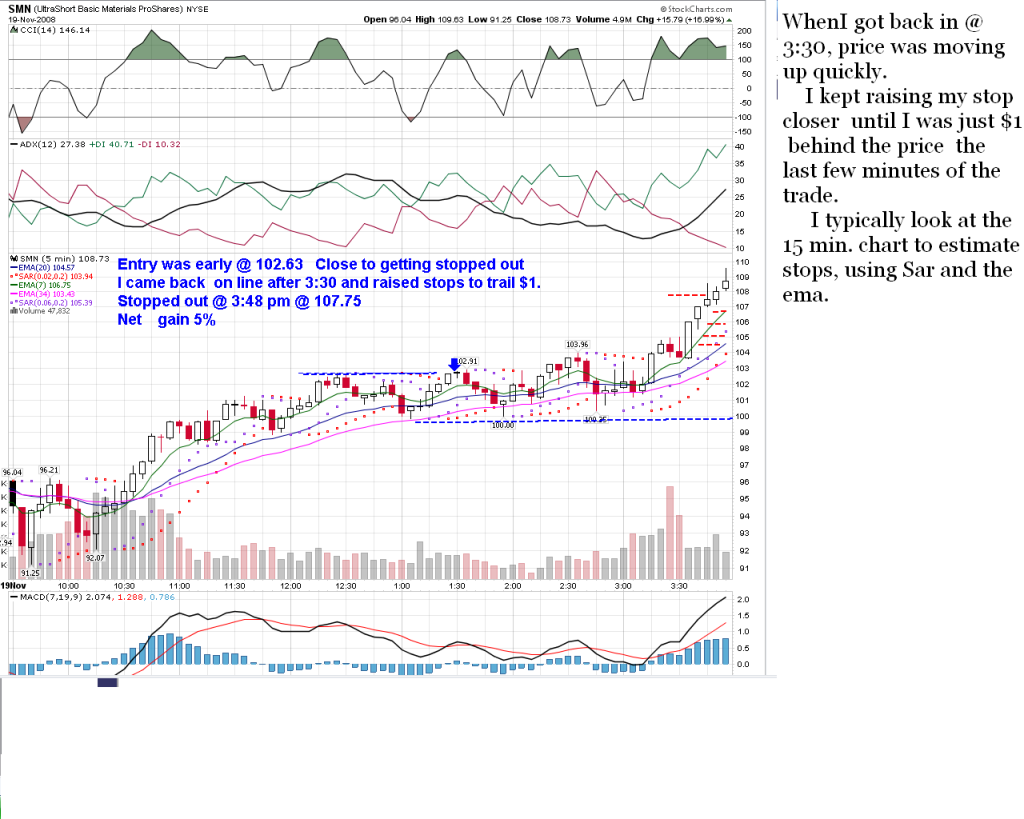 The EEV trade : 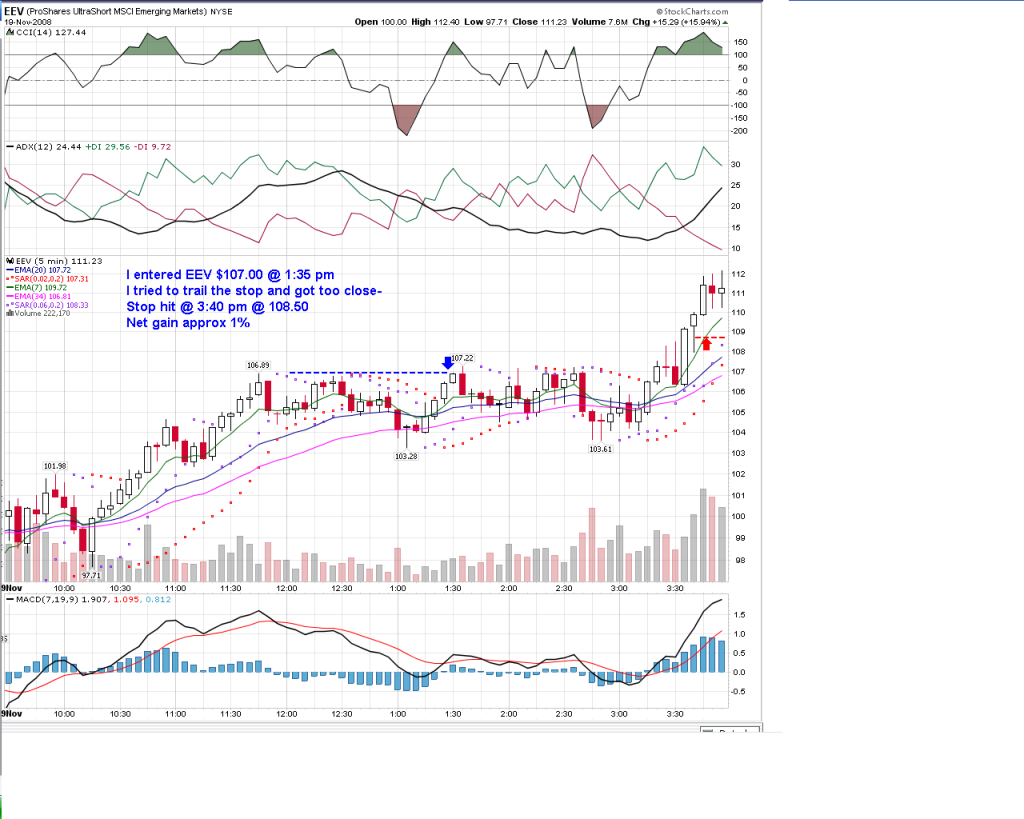 Too late to post Thursday and Friday- Work tomorrow (Sat) |
|
|
|
Post by sd on Nov 21, 2008 21:34:25 GMT -5
I have to add- I wasn't able to be at the computer until after 1 pm that day- That's how this week is working out - So some missed opportunities since I want to see what the trade looks like after 10 am. Unusual 4 day consistant trend this week.
|
|
|
|
Post by sd on Nov 22, 2008 18:23:57 GMT -5
Thursday ,Nov 20. I'm writing this memory of the trades on Saturday- I believe the market was selling off for a fourth day, and the expectation was to take out and break support on the major indices. Futures were grim, foreign mkts had sold off. I had an extremely pressing day in front of me, and I realized I wouldn't be getting much computer time after the 9:30 am break (We start work at 6:30 am to 4 pm). At the open the market started to sell fast, and I took 2 trades,SMN, and TWM , and bought them at market . I watched the action for a few minutes, then had to get into the field. I elected then to place stops at my $ buy-level- since I couldn't monitor the trade, had violated my wait 30 minute guidelines, and was stopped out within 30 minutes on that first retracement. The losses were small. I could conceive of making 5 or 6 trades that got stopped out at break even for 1 trade that netted 10%- Except that the cash used takes 3 days to clear- And I also would need about 100K for position sizing purposes, and be able to watch the computer all day. The trades: No Bells and whistles here: 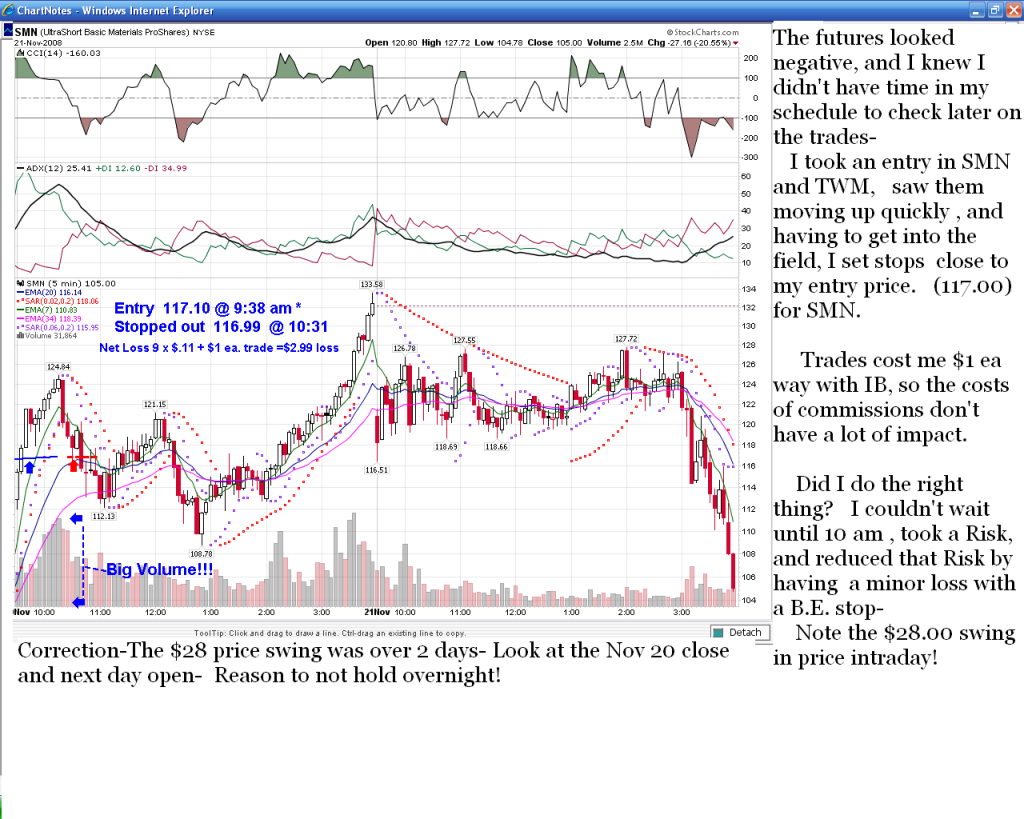 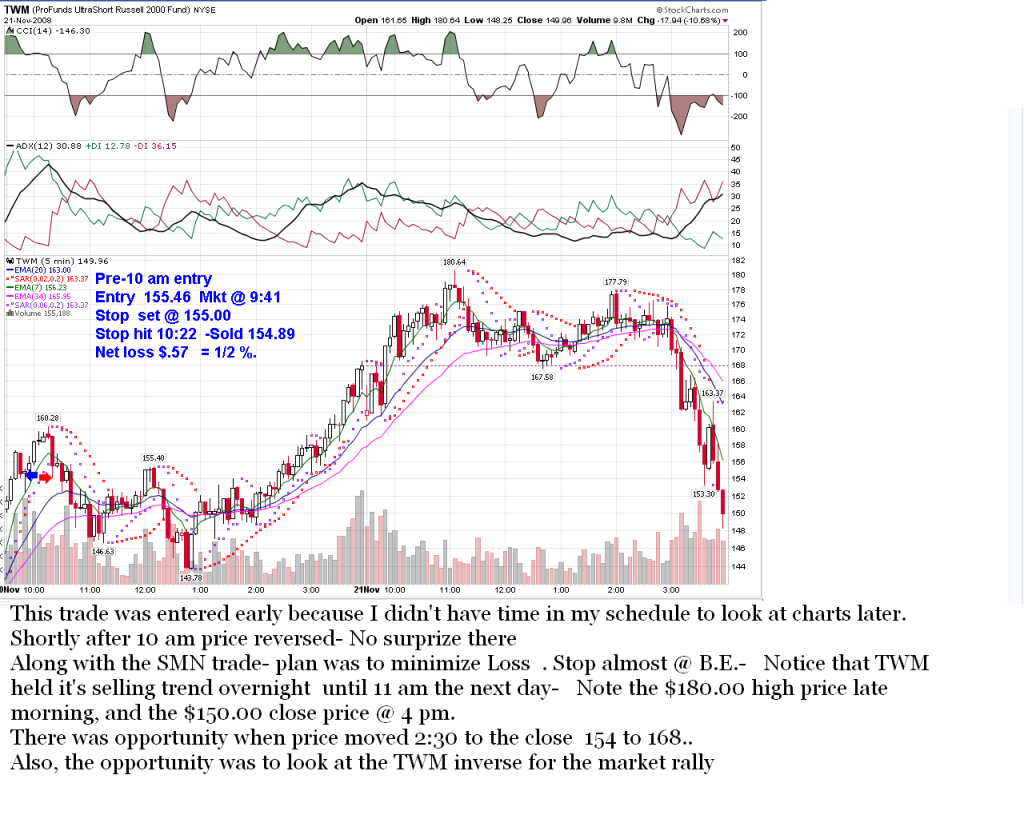 |
|
|
|
Post by sd on Nov 22, 2008 20:03:21 GMT -5
Nov 21 Friday -UYG Friday was an all-out day, with no opportunity to look at a computer at all. I got out early though, got home , and thought that there would be an opportunity for UYG to rally as the sell-off was abating. I saw the reversal starting , and didn't take a position because I had to leave for the balance of the day- In my real-time charts, price actually gapped up higher , with a second bar following through and above all the fast ema's- The market ended up making a late day Rally on Friday - Geitner was announced as the Obama pick and on that excuse- already expected- the markets staged a reflex rally- So much for the BS that the market takes a 6 month ahead broader view. We know that 6 months ahead will likely be more difficult than today.- Excuse me, we don't know or believe that because we hope it won't go that far. Historically , we have no living history to compare to I suspect. If my memory serves me, we had a major 4 day downtrend this week- When I look at the daily charts , I ask why I wasn't along for the ride for those 4 days???!!!! Look at the SKF chart- about a double- When was the last time we had put 4 days in a single direction? OK, The prevailing trend is still down, and for all of those holding their longer term shorts, -congratulations. You called it right. This UYG is just a rally attempt- Let's look at the charts: What a longer term chart would have suggested. 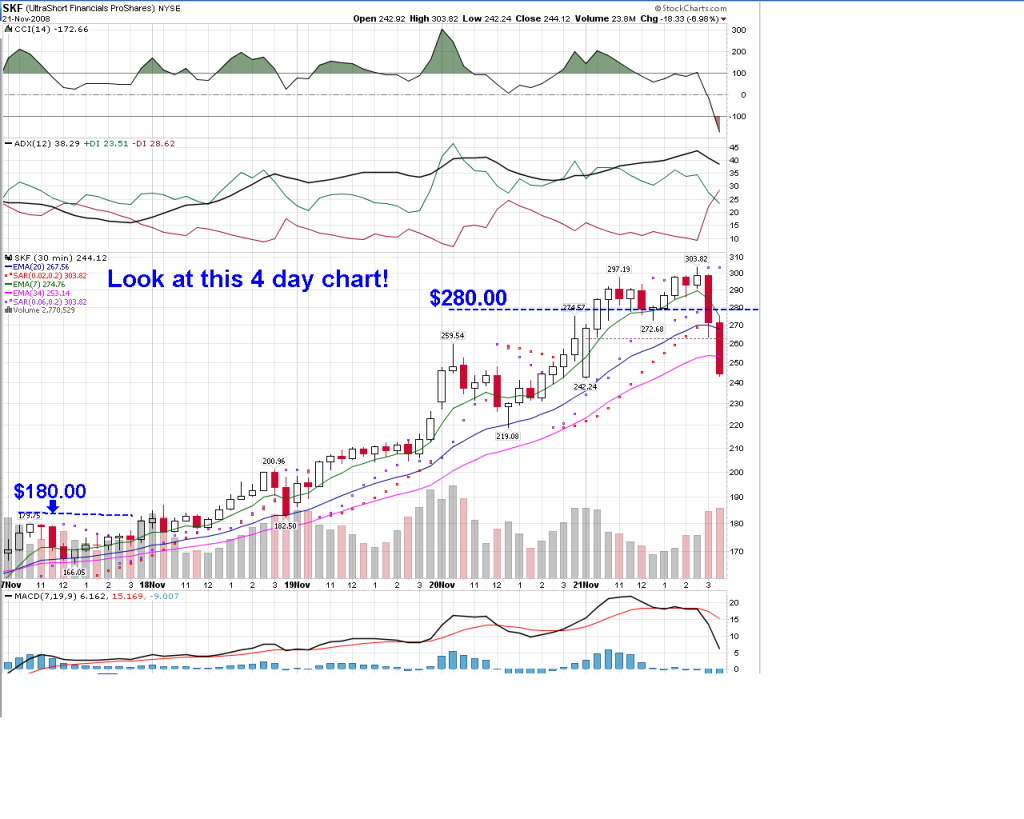 |
|
|
|
Post by sd on Nov 23, 2008 12:27:48 GMT -5
Here's where I will focus the next weeks: Financials : SKF -short $165 Long UYG $7.00 Nasdaq: QID- short $78. Long QLD $ 27 Materials SMN short $ 84 Long UYM $15 Russel 2k TWM short 124 Long UWM $18. This was from Nov. 16 post- 1 week ago. Since then, SKF $165 to 244.00 =48% Financial short QID $ 78 to 90.00 =15% Nas short SMN $ 84 to 105.00 = 25% Basic materials short TWM $124 to 149.96 = 21% Russel 2k short 2x leverage Friday afternoon suggests the market reversal is setting up for a rally on Monday. I'm going to try to position myself to buy into that rally. I'm disappointed that after all was said and done, I didn't make anything this week. Hindsight is 20-20 , and the purpose of posting these charts is to see what I did right, and what I did wrong, and how can I adapt to improve the results. Because of the recent flip-flop market direction, I'm not ready to jump in on a daily chart- although those that held the course to the short side have been rewarded. The daily appears to have broken out from the range, may retest the trend line . I may attempt that some in the future. Daily chart: Note the volatile price swings: 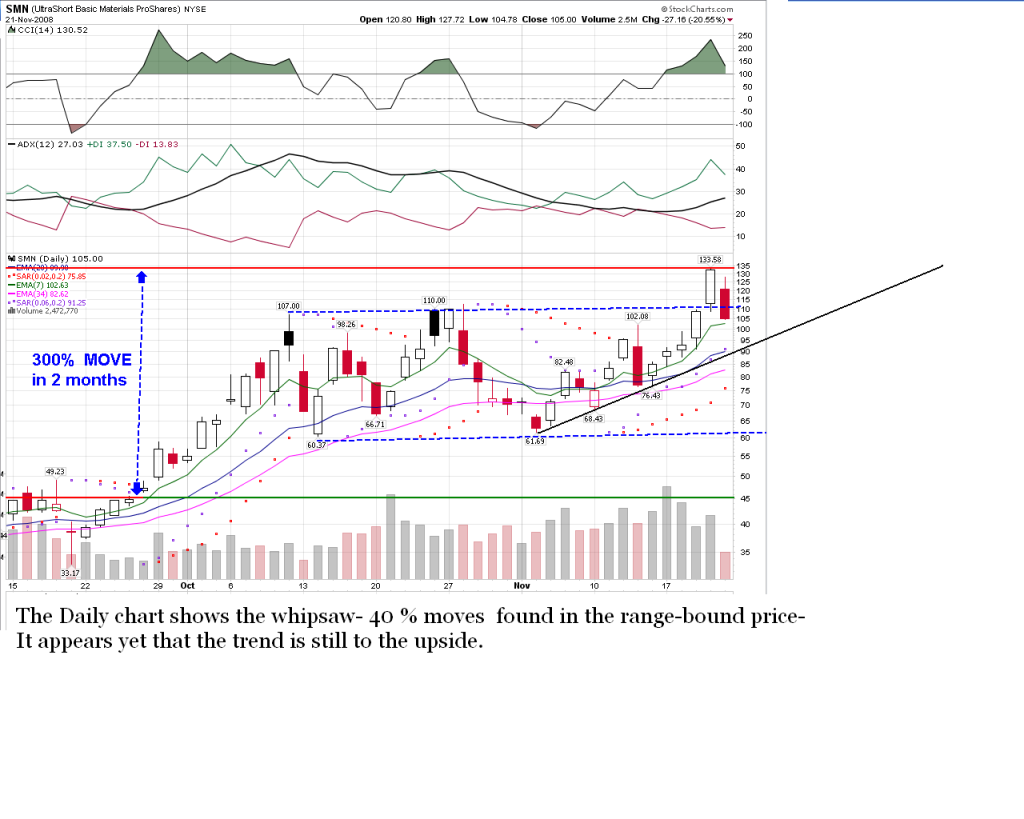 ALSO, I am going to post a 15 minute chart of SMN- I'm trying to develop some alternative methods that would have allowed me to have made better entries and exits having less time available in the near future during the work day- Things are going to be a bit hectic for the next weeks. The general rule about waiting for 30 minutes to try to get a feel for real market direction still is valid- I took an entry on high momentum open Wed. early on. However, as can be seen on the 15 minute chart, that 30 minute wait doesn't provide the basis of a good entry-Even though this stock uptrended for 4 days, with a pullback Friday, Had I traded this every day after 10 am, I would have had 3 of 5 trades losing by the tighter stop I would have used. Going into the Lunch hour provides another opportunity that may provide a lower risk entry as price has usually settled some. If I can't monitor the trade, I'm thinking of a trailing stop based on the distance from the entry to SAR. 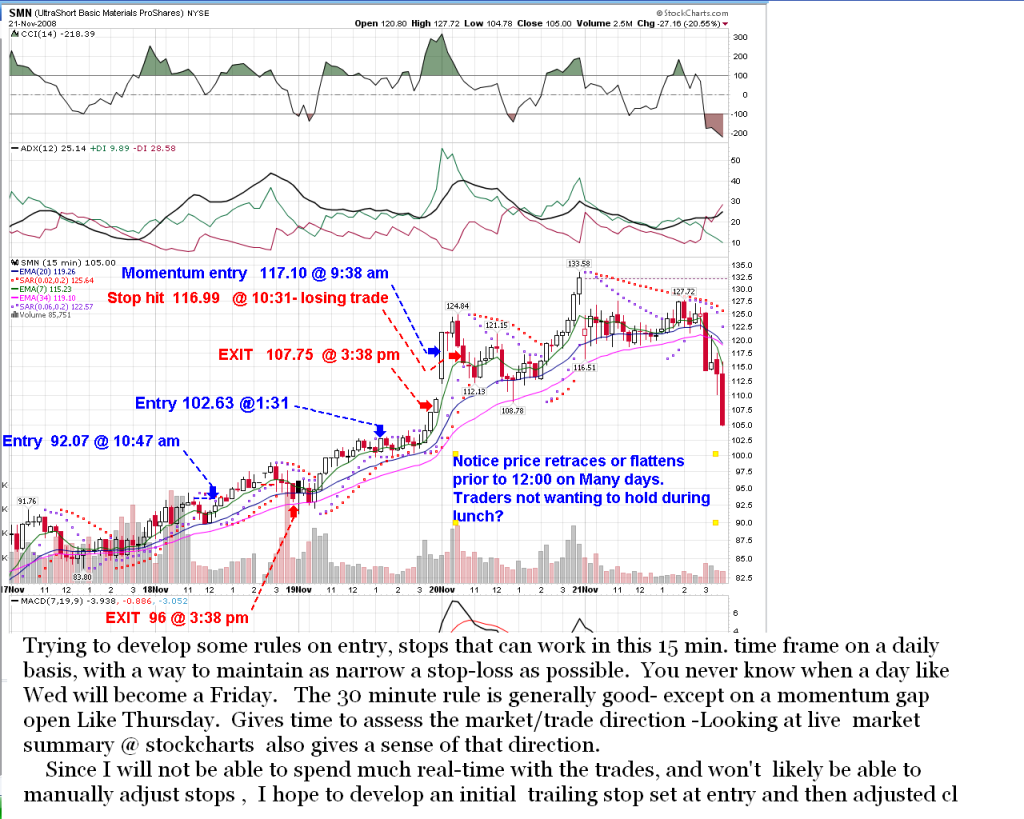 |
|
|
|
Post by bankedout on Nov 23, 2008 18:51:22 GMT -5
It might not be a bad idea to do your entry orders around lunch time or early afternoon. You could set your buy stops and then attach a few exit orders to that entry order.
Exit A = Limit target
Exit B = Disaster stop
Exit C = Trailing stop
Exit D = Market on Close
Have the ABCDs set to "one cancels all" or whatever it is called at IB.
Trading is usually quiet mid day, and I think you could probably get in with a tighter disaster stop, which would keep your losses as small as possible.
|
|