|
|
Post by sd on Aug 12, 2017 7:12:06 GMT -5
a view of the "BIG PICTURE" - QQQ from the stART OF THE YEAR AND NOTED THE PERFORMANCE AT THE OPEN OF EACH MONTH
Despite the drama of this past week, we are pulling back this month from a YTD high- and while it may indeed turn into something more sinister, the chart reflects
the reality that we are still within a larger uptrend. Despite closing down -2% on the week, the close still reflects a 19% gain YTD! 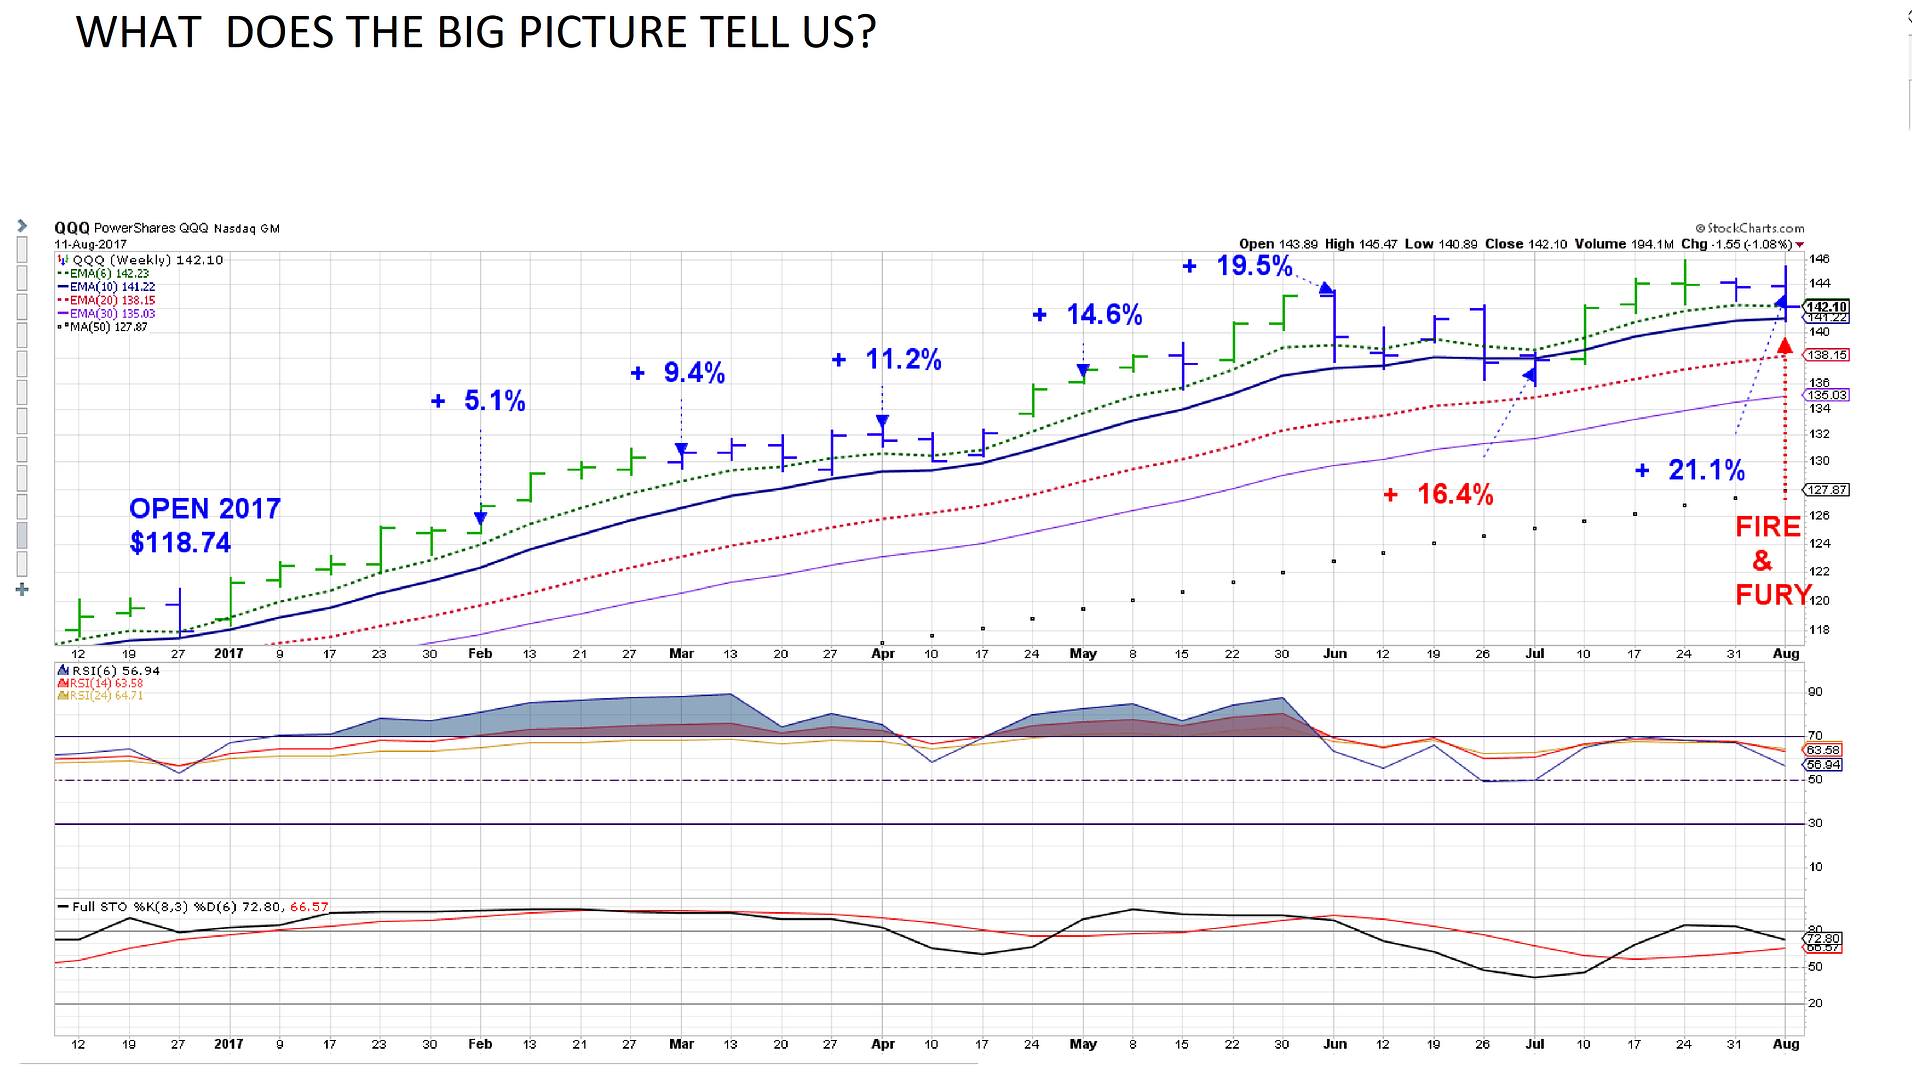
|
|
|
|
Post by sd on Aug 12, 2017 11:14:23 GMT -5
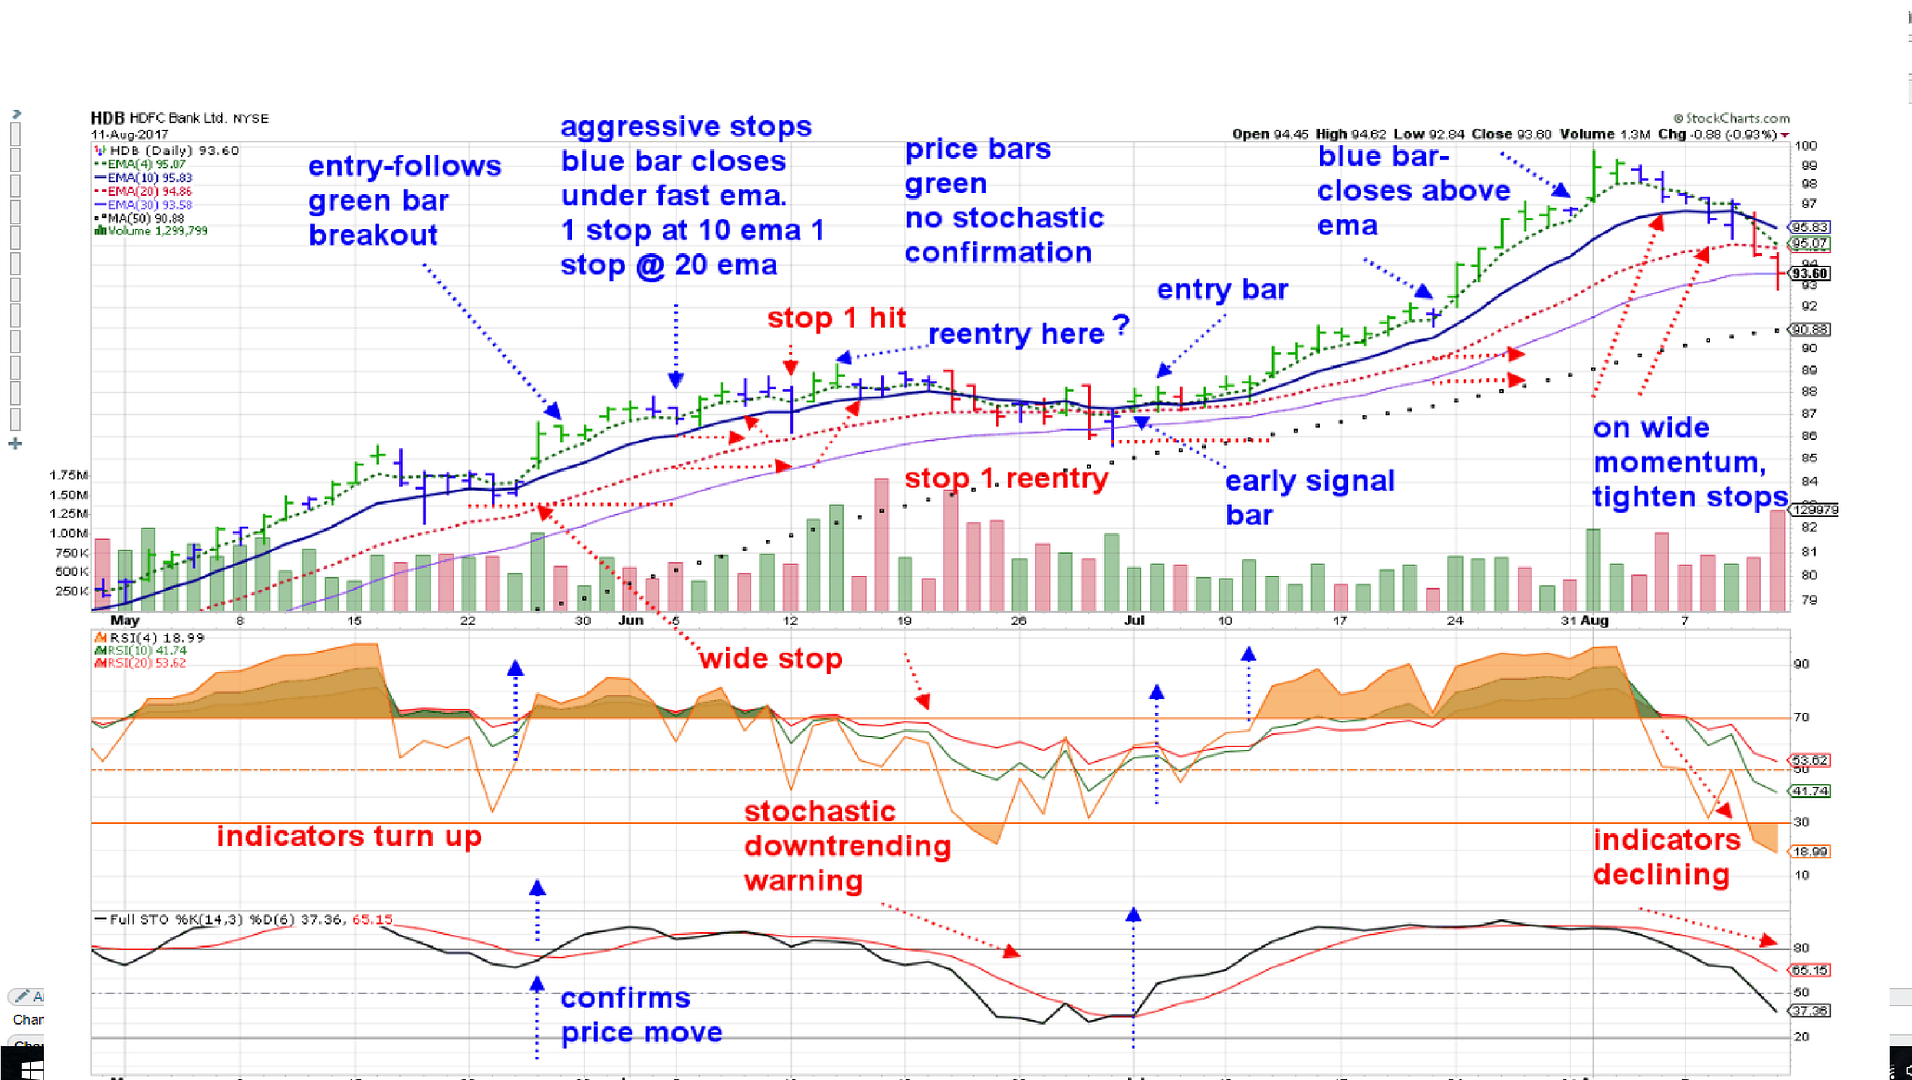
Based on the daily chart, HDB should have stopped out - and -would have netted a gain at the stop even after i sold 1/2- I reentered the next day expecting further momentum and wanted a larger position! AHH Hubris! Fire and Fury! Based on this time frame use, I should have stopped out already using the daily chart-
Since it was a large wide momentum move- that should have been my approach to tighten on the above normal momentum (which I did) take partial profits- (which I did) and then reentered with a tighter stop-loss if I expected further upside momentum to move quickly-
That is the goal of taking partial profits- but i got greedy and wanted to get back in with some size- A view of the weekly chart shows a signiicant nice uptrend- but it also shows the heightened momentum pull away.
That said, i am discussing HDB with a friend and illustrating a chart of HDB with the Elder Impulse color coding-
Goal is to stay with a trend as long as it is intact-Not getting in at the bottom, and not selling at the top- but trying to capture the majority of the movement, and yet have some logical methods by which to place stops , take a profit, take a loss, and when to reenter- One could select any of many variations-
Weekly chart needs to be in an Uptrend-
Indicators can confirm the entry on the trade before it is taken-
Ema's are ideally in correct sequence-although perhaps congested- and from a pullback, basing period within the larger trend
Following a higher green bar close- Entry is considered the following day IF the fast RSI is above 50 and turning up, and stochastic indicator has the fast line upcrossing the slow line.
stop to below the low of the prior blue bar low-.
Stops are not raised daily- unless one is very aggressive- ideally 2 stop levels would be employed once the trade is in positive territory-
don't react early unless a blue or red bar closes below the fast ema. Stop gets raised to the ema below the low, 2nd stop at the next lower ema below that-
Excess momentum gap aways would be ideal to set a higher limit sell for part of the position well beyond where you expect price to reach- Say 20%- and adjust that higher as price approaches-
 |
|
|
|
Post by sd on Aug 12, 2017 17:49:36 GMT -5
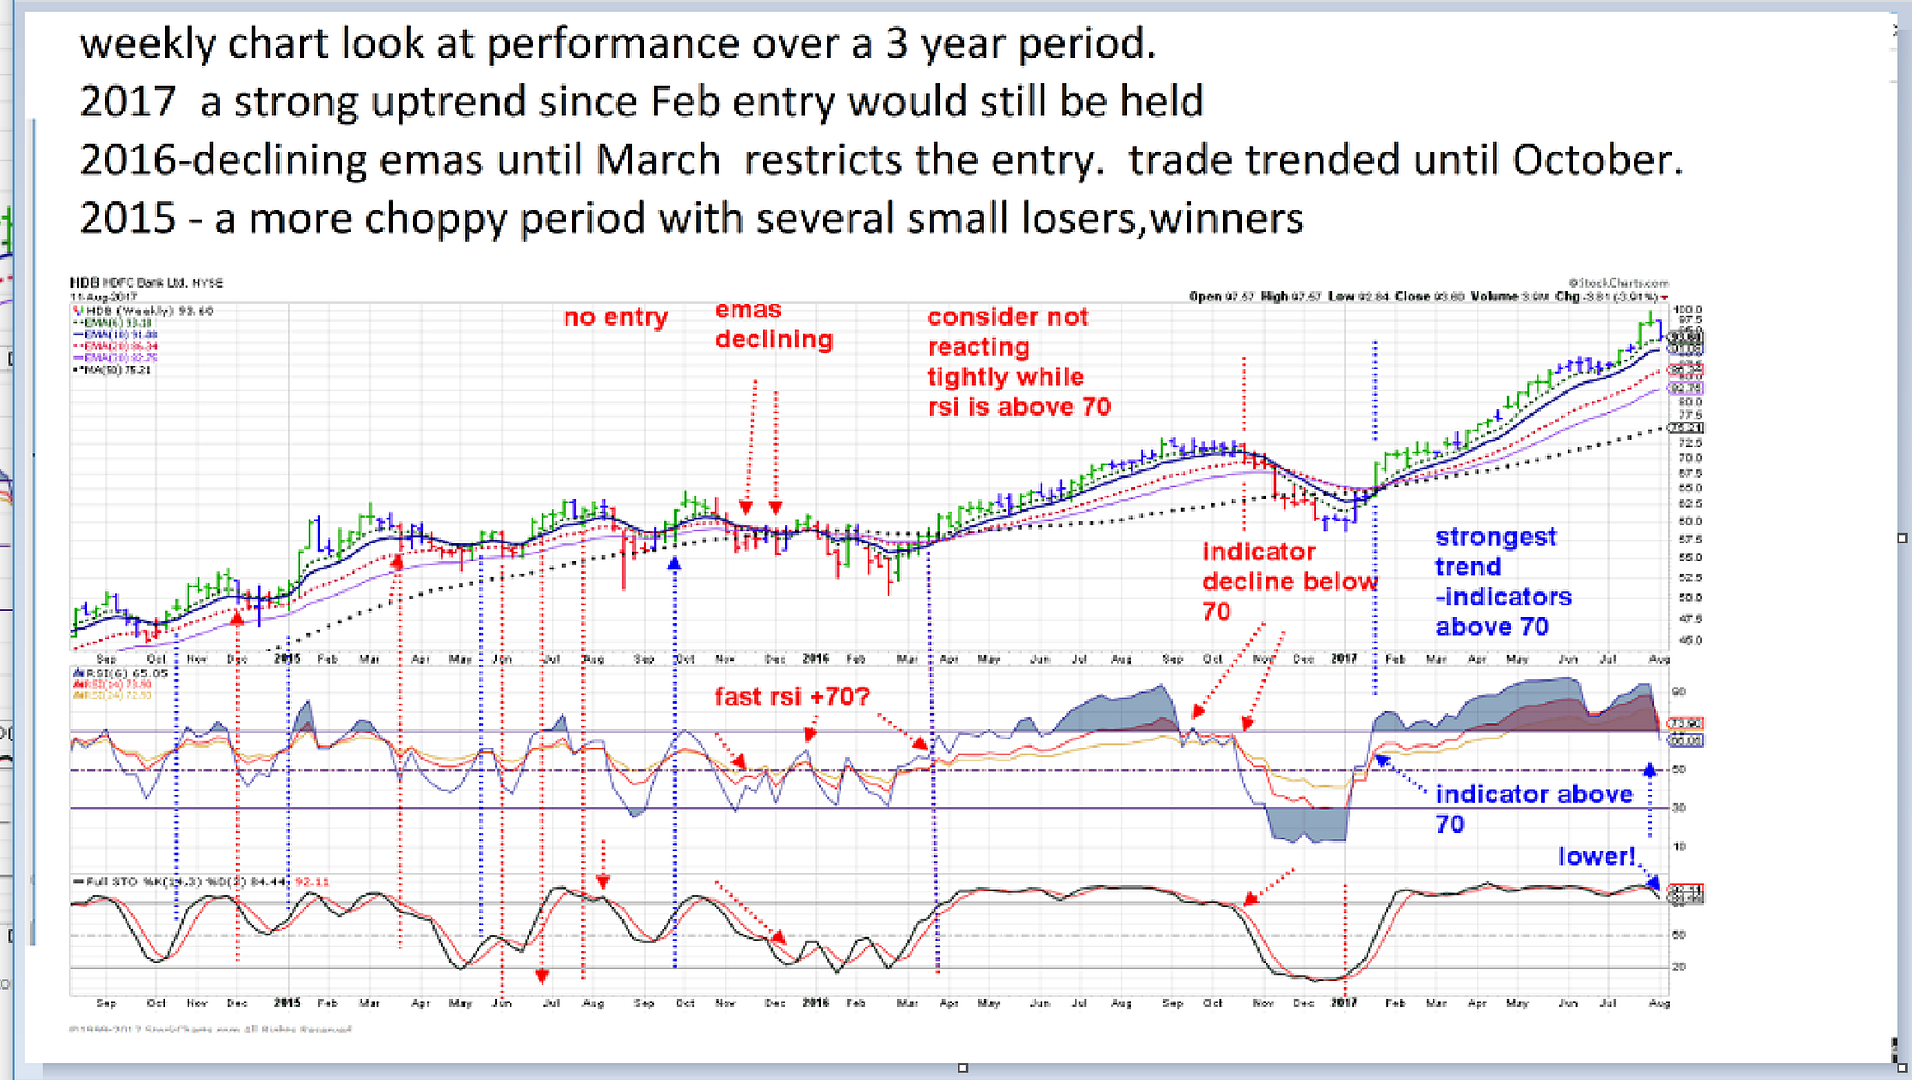
Reviewing the longer term weekly charts and the Elder Impulse signals
a 3 year look back - 2017 trending strong since Feb and the trend still viable-
2016 captured a good portion of a shallower trend.
2015- had a series of smaller choppy periods-
Benefitting the approach is a requirement for the fast rsi to be breaking above mid line- perhaps 60-70 to enter-
EMA requirement is to be technically uptrending/basing- entry if the emas are in decline is not supported.
stops could be trailed at a wider ema - 30 as an example, unless price makes a closing bar lower - variable how this should be viewed-Likely best to coincide with the sector
itself. The weekly view should also recognize when excess momentum higher is occurring and make intentional sells to capture that above normal price pull away.
This chart uses the conventional stochastic setting- Stochastic turns early- and price does not always immediately follow .
 looking at the qqq's 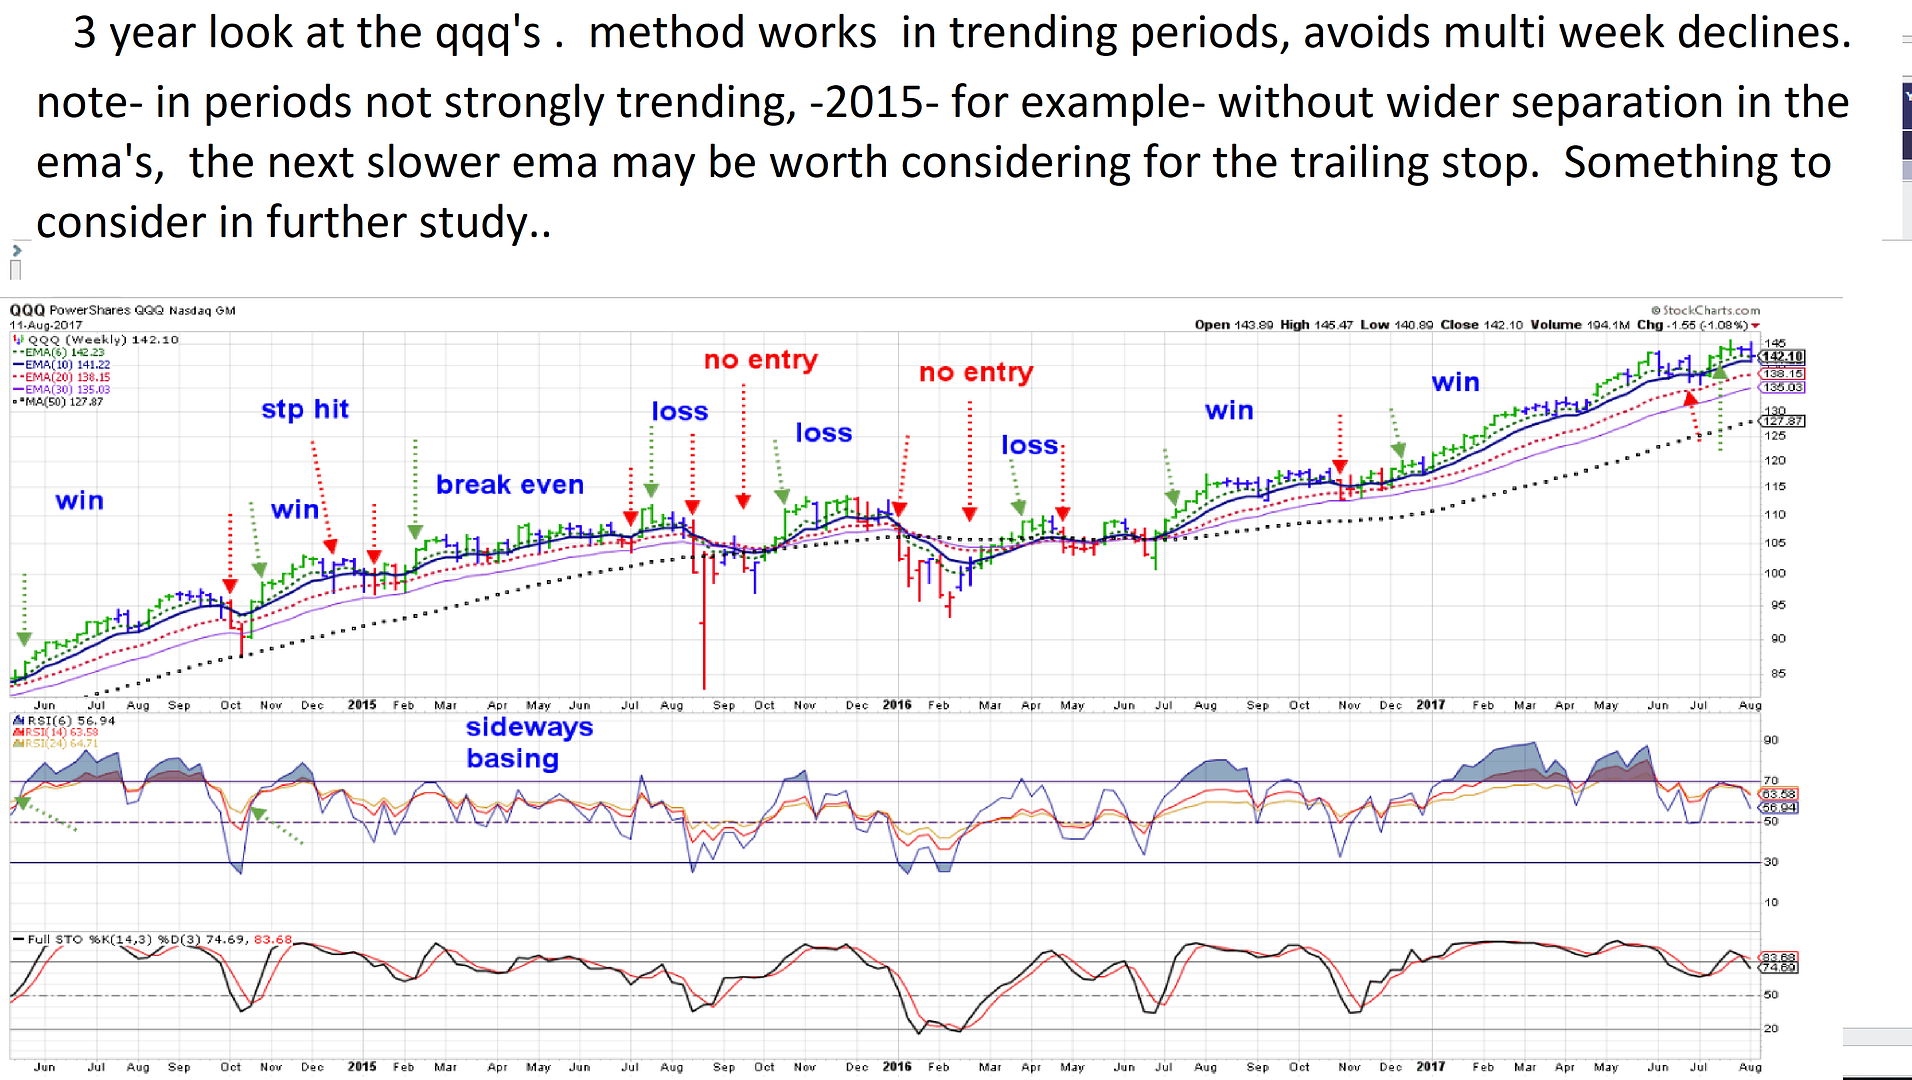
|
|
|
|
Post by sd on Aug 14, 2017 8:28:45 GMT -5
Futures look up-Europe up- Will be taking the deserved loss in Snap at the open with a stop at Friday's low- Lottery ticket...Even though it was a small position-that gap down took it well below my entry-
Expecting to see if my view with the long term trend still very much intact will gain traction beyond thefutures being up at the open- No issues from Korea, but the news of the am is Merck CEO resigning from one of Trump's advisory boards in protest -it seems- of Trumps reserved response to the violence in the VA protests by a right wing white activist mowing into a bunch of protestors with a car- And Trump tweets back that Ken Fisher can now spend time on rip-off drug pricing....What a reactive high school President we have emotionally!Or at least that is How it seems-It has been said that Trump is like a street fighter- and swings back hard when confronted... Why do it in such a public reactive manner? I hope he tones down the Korea rhetoric this week- and that Korea doesn't continue it's bluster and confrontational publicity- Don't poke the street fighter-
stopped out as expected Snap 11.33-at the open- but it went up .5% quickly, and is now up +7%- Share lock up expired today- i really thought based on gthe sell off on earnings, this would go much lower as employees/investors could sell on the open market- Got it wrong!
Everything else is back in the green compared to Thursday & Friday- All market sectors higher as well so it is a wide rally. Poor timing on my part to consider taking a longer view when right at a peak with entries- The market pullback last week set new swing lows for many stocks within the present uptrend.
While i did not get shook out last week on positions, will today's recovery have any follow through this week? Certainly it gives me a reason to view Thursday/Friday as stops for a longer term approach. As i compare both the weekly charts and the daily, and assess my comfort level of sitting through wider swings in price-I am not convinced i can adapt to that longer term weekly view approach with confidence that I can allow for the wider swings in price - without a higher level of fear/discomfort-
It also seemed that even the foreign positions I held dropped in lockstep- certainly we are now much more correlated with the global economies that years ago...
ITA- defense sector declined just slightly - down to 167 .
With today's bullish recovery across all sectors- If i had stopped out last week , I would be looking at gap higher prices at the open today from Thurs/Friday- Nice recovery going on, erasing a lot of last weeks decline, and CTSH, ITA, Botz all right at prior highs-or breaking higher. Remainder still playing catch-up.
IBB- has b een pulling back, today up higher- it offers a low % risk if one used the swing lows of last week as stops-or even the 290 prior range-
If today's move back higher negates last week's pullback - it will be called a missed buying opportunity- But, If you sold into the weakness, or stopped out , you find your position
likely gapped open higher at today's open. Instead of reentering today's upmove a few pts higher- One waits-just to be safer... This is a typical occurrence of active traders and is well documented across the retail investor underperformance-We never know whether today's upmove will become just a bull trap of the decline next week, or the best time to be buying-as the trend higher goes up further....
|
|
|
|
Post by sd on Aug 14, 2017 12:19:38 GMT -5
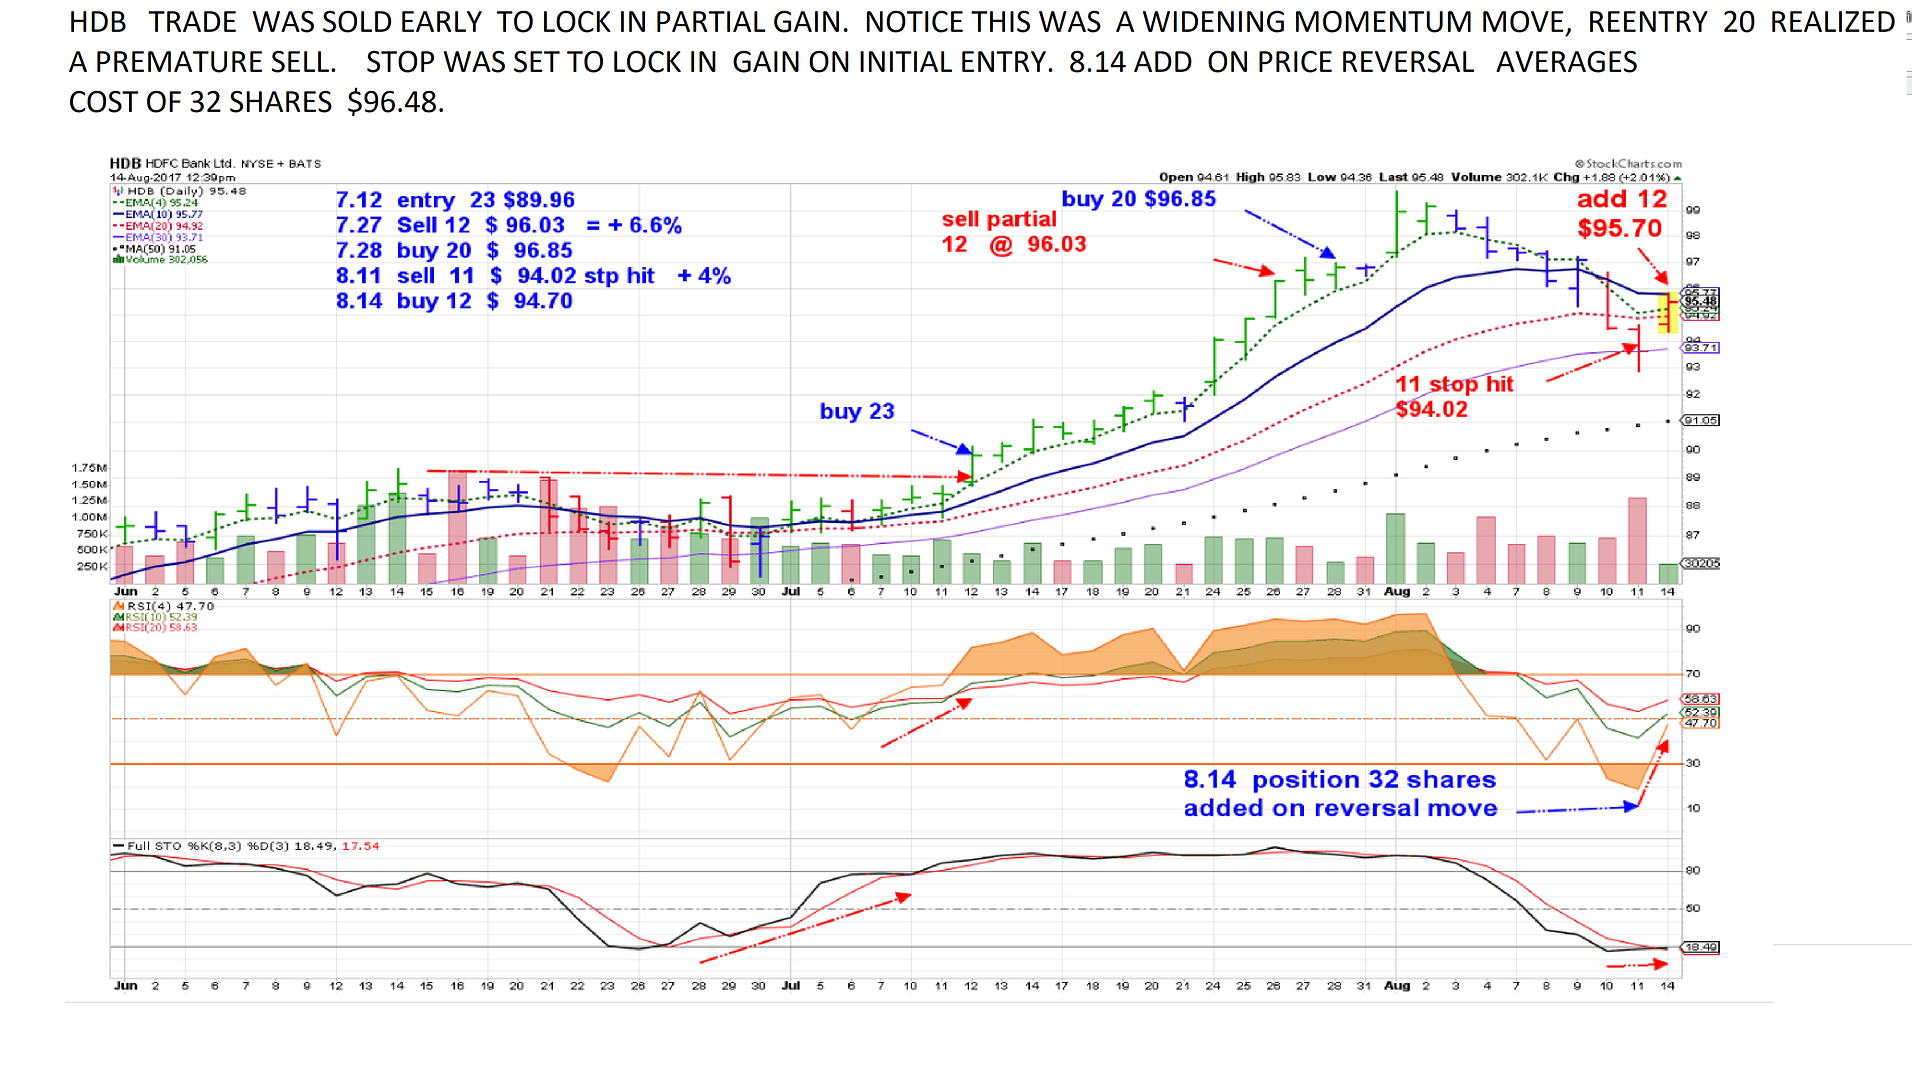
CHART OF HDB ENTRIES AND SELLS- I added to the position this am- - on the price reversal higher today . Indian Financial, and I used unsettled cash i n Scottrade-
The original entry was textbook - on the higher move. The partial profit taking was early-I would assess it as 'premature and anxious-' on my part. price had not stalled , was still above the fast ema, and was not a gap away big momentum move.... and it was only a 6% partial gain-
Also commission costs @ $7 chew up some trades/gains.
Will post a chart of the actual trades made to date- and ideally will post a 2nd chart of what ways the trade could have been improved -
This is positive reinforcement by spending the time to mark up the actions I took, and- in hindsight critique what actions were justified by price action and what could have been done better-
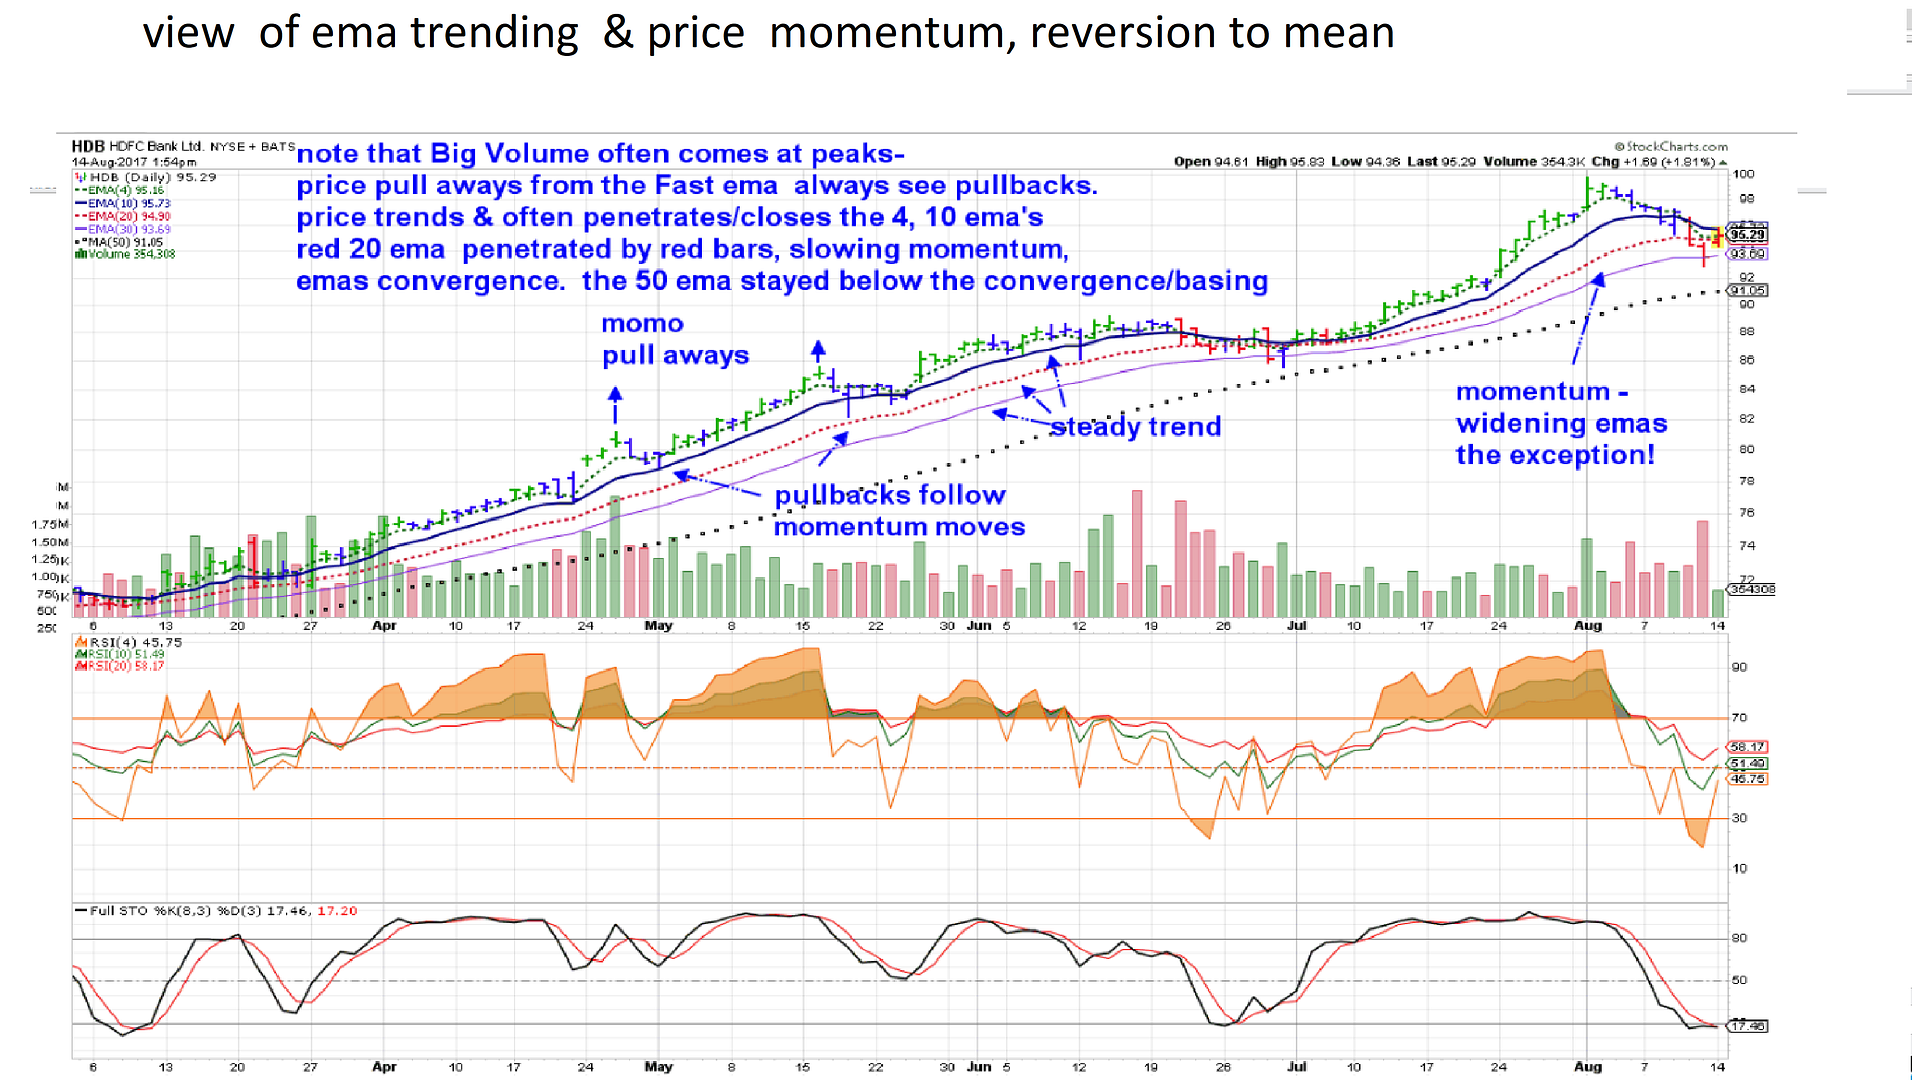
defining what is "normal" price action when price is basing, or trending-
looking back during the recent year - price trended well- price bars occaisionally pulled away from the fast ema (perhaps an opportunity for a partial sell) as they always pullback lower-
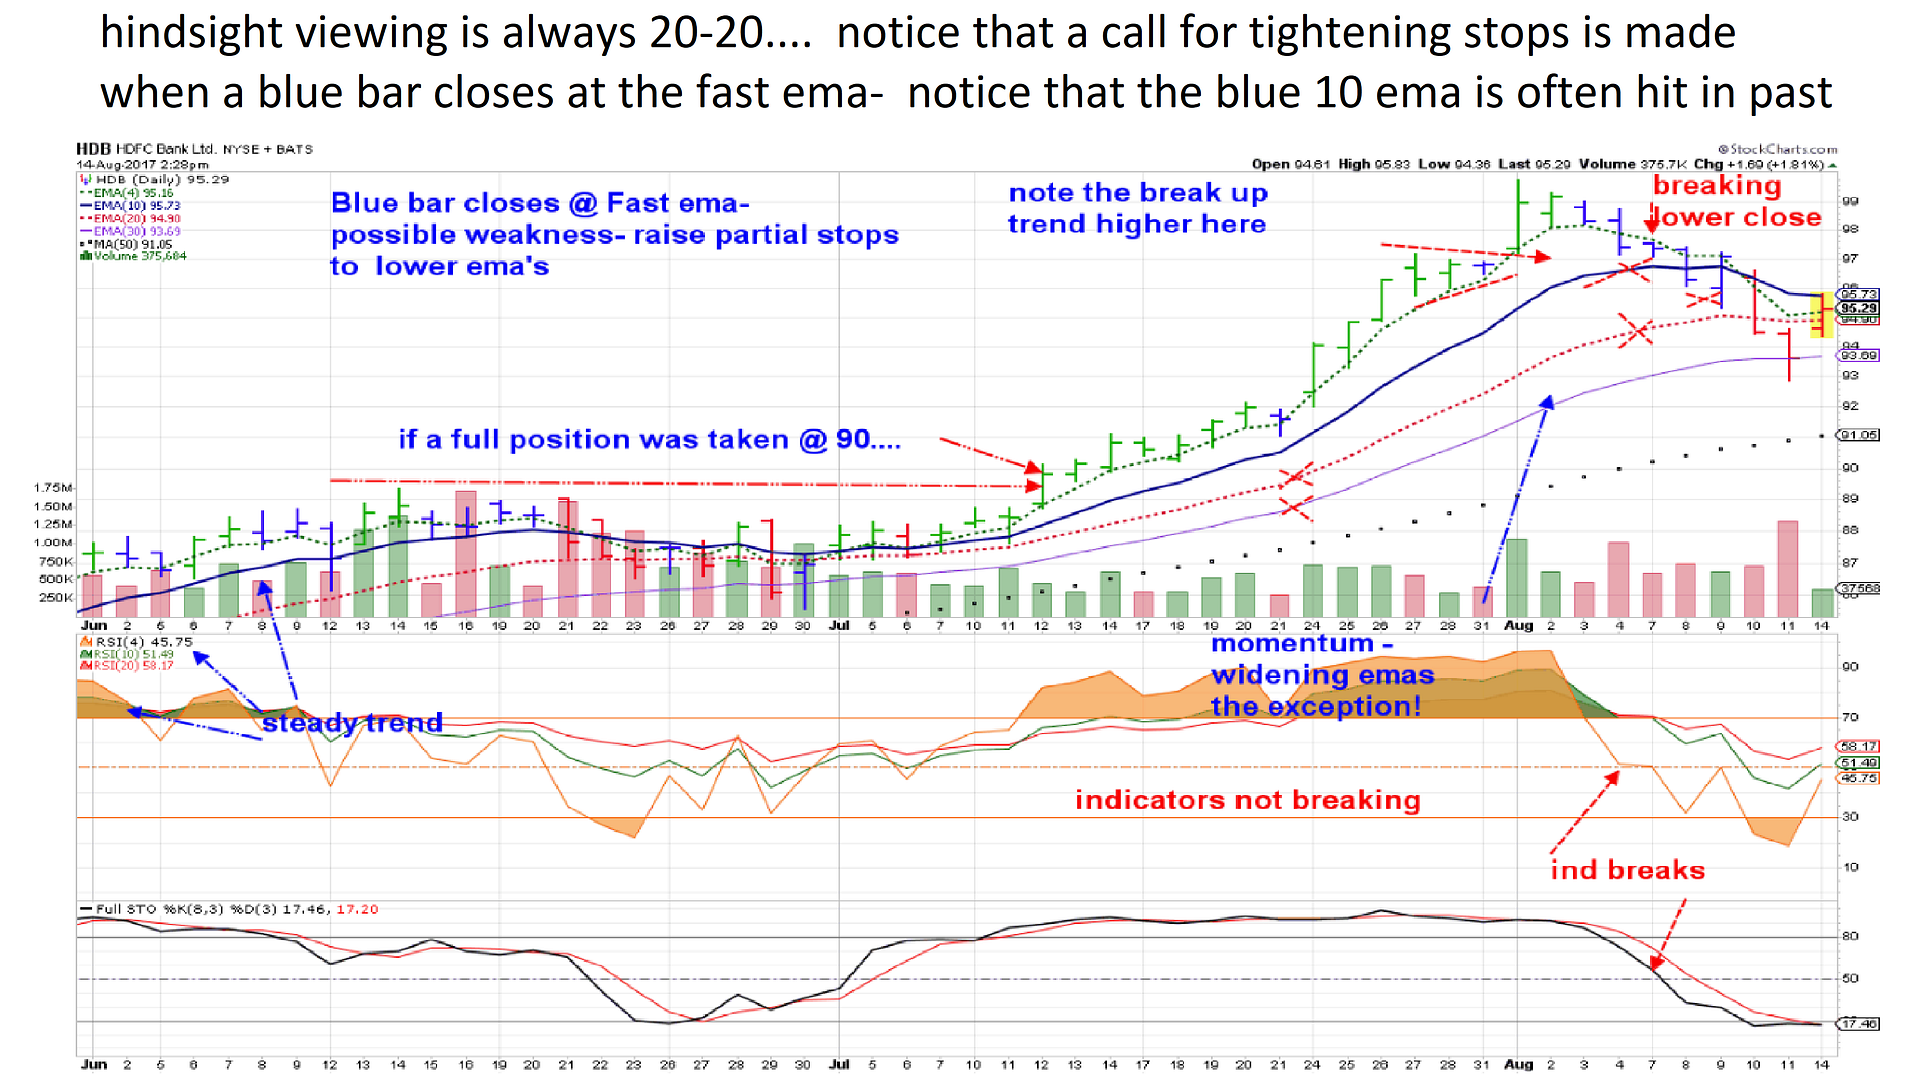
Price behaved well for months, with the fast ema & 10 ema getting penetrated as "normal" - but the trend continues higher- The 20 ema served well as a potential wide stop-loss- But notice in the recent weeks, the extreme momentum move with price moving upwards at an increase in slope , the widening space between the emas, and the rising RSI values solidly increasing above 70.
Recognizing the increased momentum is generally not sustainable, identifying potential topping/climax would be prudent to make at least partial sells ...
 and a last look at a hindsight-20-20- Woulda, Coulda, Shoulda- and a last look at a hindsight-20-20- Woulda, Coulda, Shoulda-
Keeping the same valid entry on the move higher- and looking at the past trending months, when the 1st bar (blue) Closed at the fast ema- stops would have been raised- to one or two ema's below the blue bar. Knowing that in past trending periods, pricew often penetrated the fast and 10 ema, stops should be kept below those to stay cleafr of intraday volatility on a 2nd blue bar pushing lower intraday. That did not occur, and as we have seen and noted in the horse race, it is not uncommon for a price bar or two to pullback just prior to a larger up move.
July 27 price makes a new high, following 3 strong up days, and the following 2 days are tight inside bars -sym triangle. The Tight Blue bar Closes above the fast EMA- at this point, ema's are getting wider, and price breaks higher with a topping bar Aug1. Stops could have been raised prior to the breakout to the wider 20 ema, 30 ema- -Following the wide momentum break higher bar, prices makes a higher close followed by a blue basing bar with a lower close near the fast ema- Notice the widening bulge between the fast ema & 10 ema-
An Aggressive stop could be set at the 97 - bottom of the breakout bar- or the optomistic trader could move up on the 10 ema knowing it was exceptionally wide from the fast ema-
and perhaps a 2nd stop now at the 20 ema- All in an effort to allow a winning trade some room to run wider, but locking in some decent profits on the larger % of the move.
Being aware of outsized momentum moves compared to what the average trending period is worth letting the trade run and not taking too small a profit because I am 'anxious'-
 |
|
|
|
Post by sd on Aug 15, 2017 8:15:46 GMT -5
Reviewing HDB and other positions this am-
Assuming a methodology around holding a core position view a weekly view, and trading a partial based on the daily ....t...- Will use HDB as an example- In reviewing the weekly 91 charts- approx 1/3 trended strongly for many months- some still are doing so-
as can be seen , periods of higher-pull away momentum are relatively rare on the weekly, can be seen clearly on a daily-
Ideally, a part of the core position- could be applied to chase the excess momentum move as it goes higher, and as it stops out, profits used to repurchase on the pullback-
Presently, I added yesterday to the HDB position- and the daily prompts me to put my stop just below the last week's low.
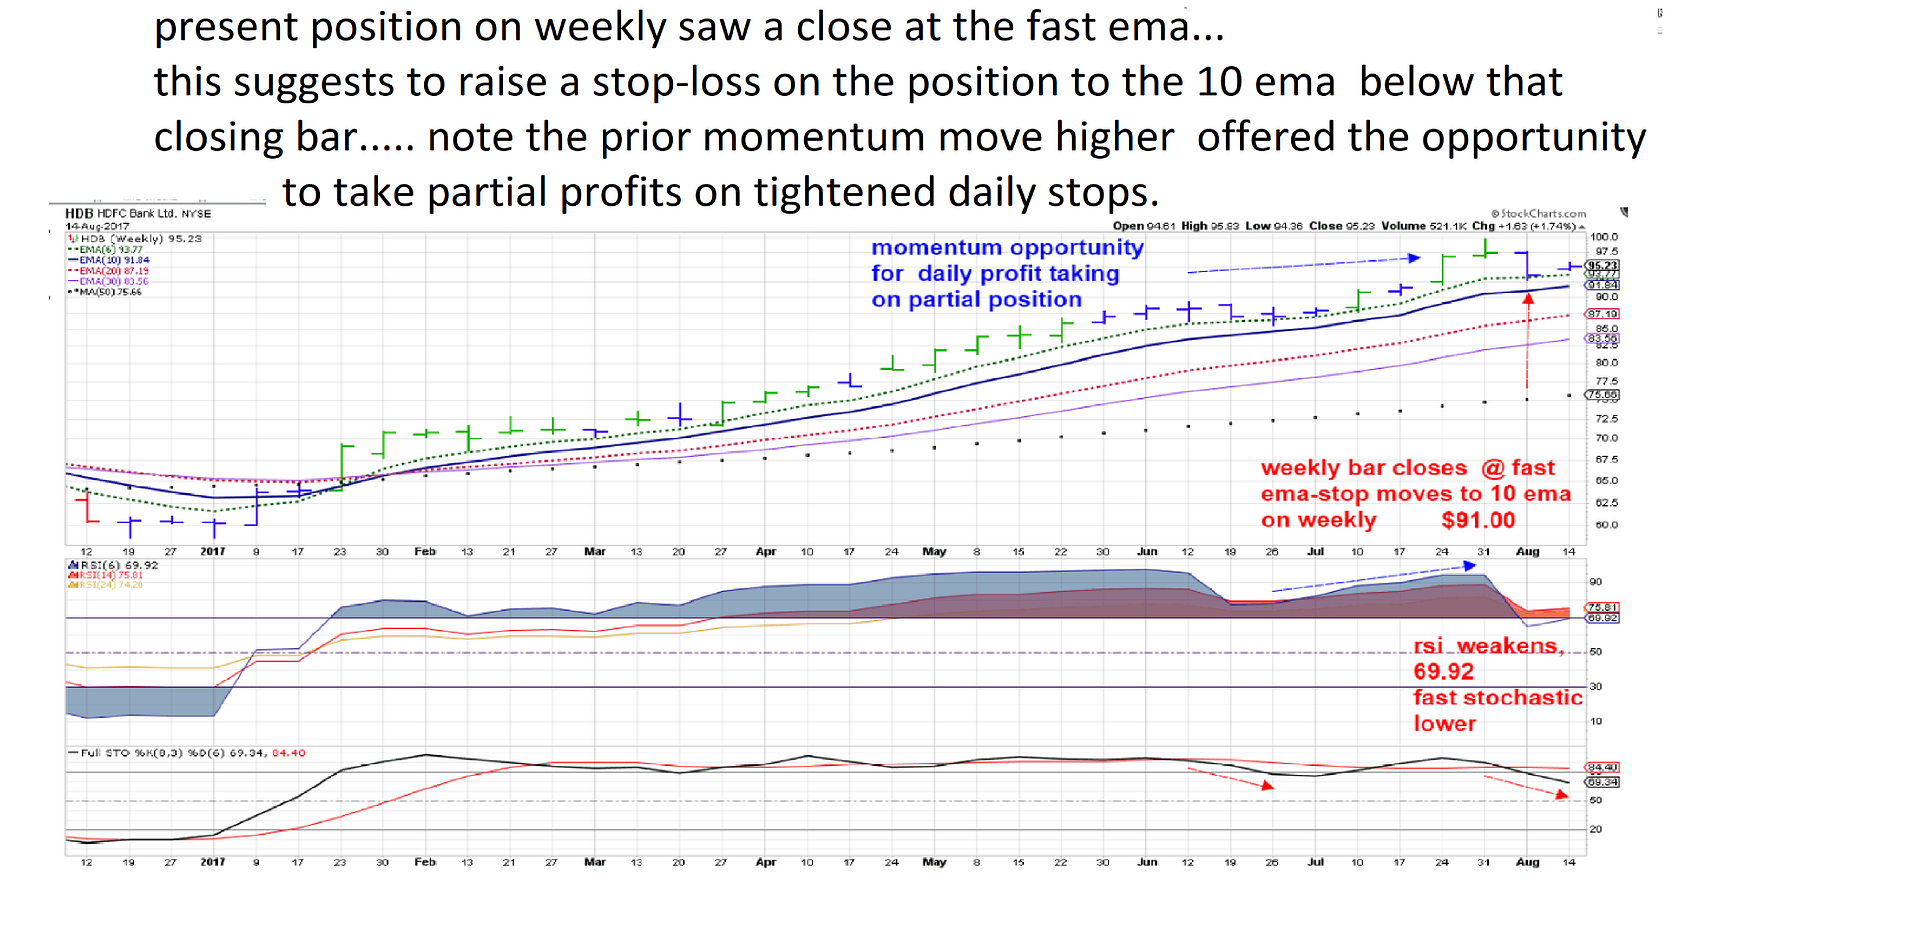
The weekly chart has been trending for 7 months without a touch of the 10 ema- and the closing bar last week closed bearishly at the fast 6 ema.
This close at the fast ema requires stops to be raised to the 10 ema- 91.00 .
 |
|
|
|
Post by sd on Aug 15, 2017 10:18:48 GMT -5
weekly study
As i give consideration to the weekly approach with stop adjustments, it is far easier to apply that to something that has a history of periods of trending well-
In my 91 prior positions-2017- only about 1/3 actually held sustainable trends, while 2/3 either got choppy or some declined over this past 2017 year-
An approach that is successful in those smoother trending stocks will not necessarily perform well for the wider 2/3 that did not trend well- and ultimately the goal is to be able to
implement an approach on a wider variety of less than ideal candidates that may better reflect the trading universe-
To that end-I think that wider volatility swings in price offer more well defined opportunities, and slower volatility may be more difficult to set up guidelines/conditions for entry and exit. The DBB weekly chart offers a way to backtest/study- and perhaps set some guidelines that can be applied successfully that could have wider applications.
Posting the longer term WEEKLY chart here- The price bars are compressed because of the duration, and I will take a future look at the charts in smaller chunks and "test".
DBB could very well become a small part of one's diversified long term portfolio (or Mine ) and particularly if I can see myself having positive results in executing a more systematic approach across the entire Portfolio- That's where I am ultimately heading - Trading account- Portfolio account-Rules to adjust stops- take entries, take profits, hold core positions.... The trading account has been blessed by this strong bull market in 2017- but a more systematic approach, following rules and not discretion - would have yielded even better results YTD.
I feel that this type of "Study" is beneficial for myself, and would encourage others to perform a similar exercise for their particular approach.I will post the various "Backtest" Study charts when time allows me to follow up - dbb chart 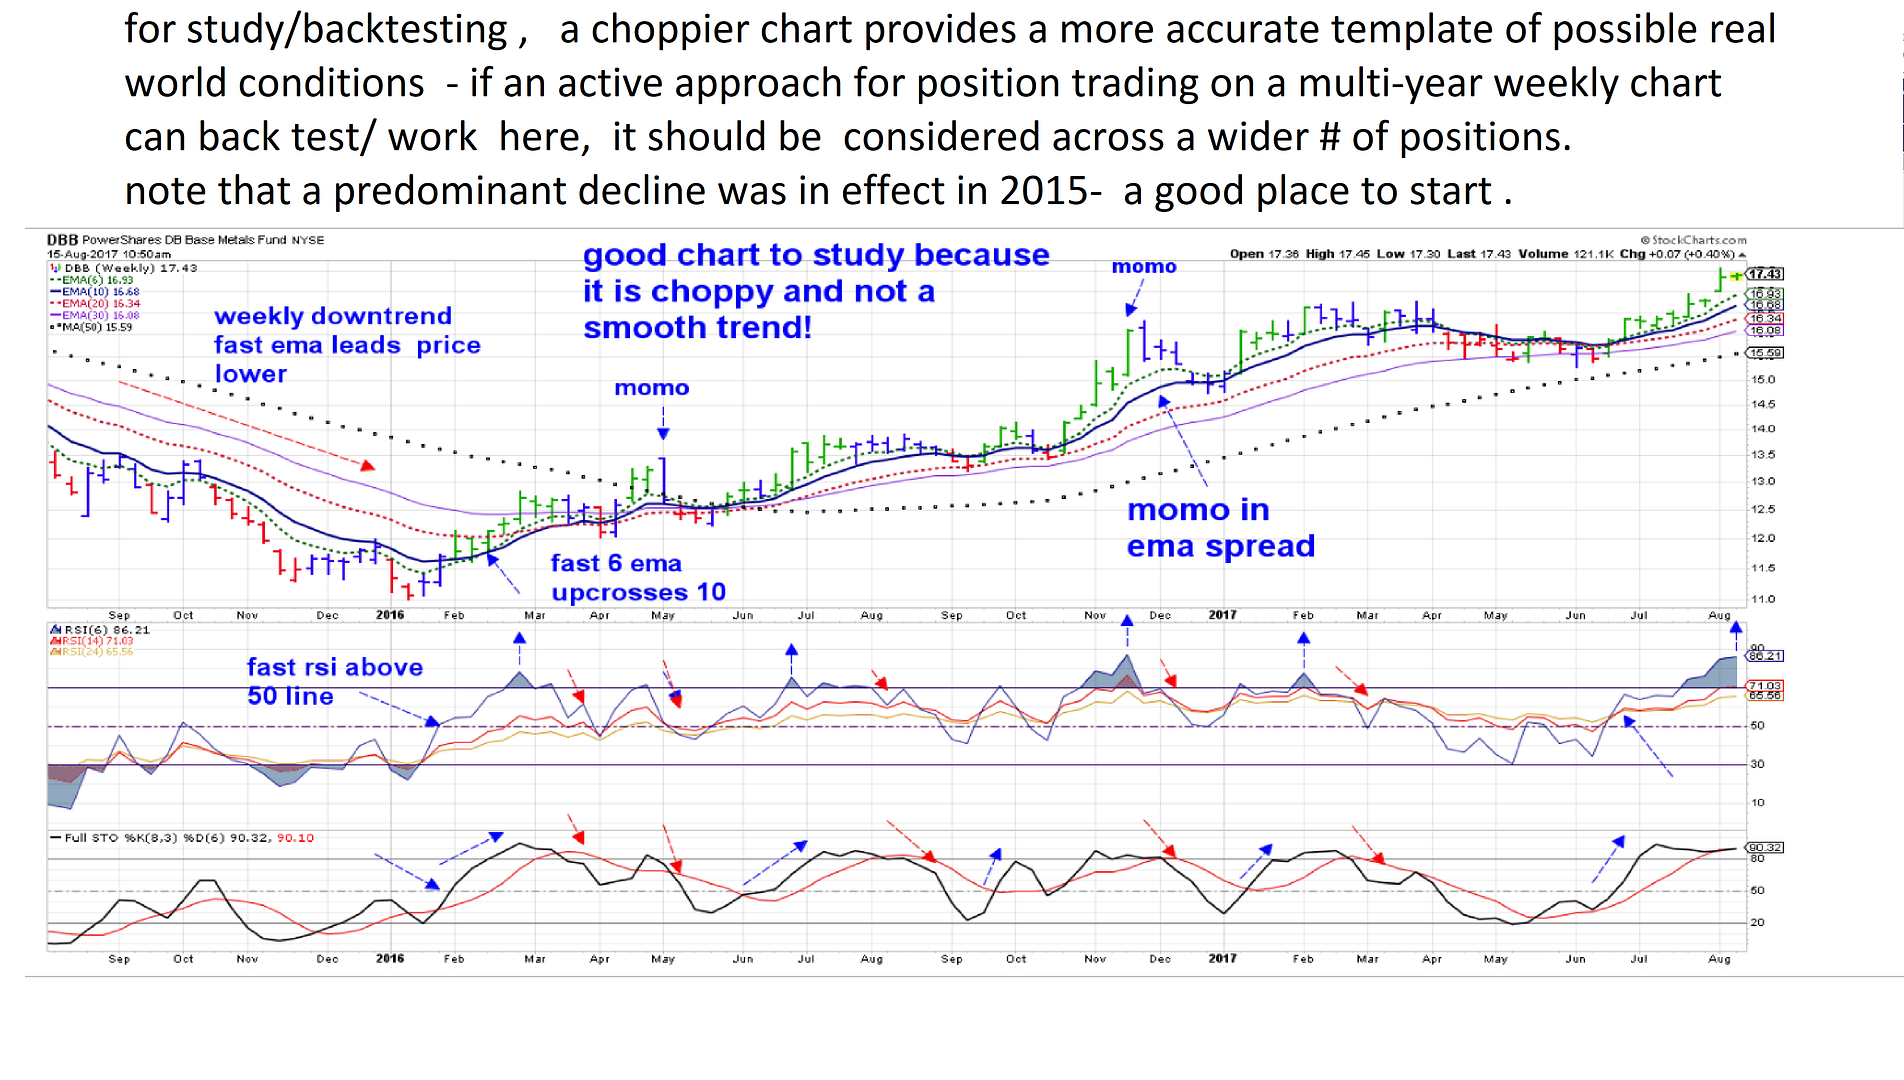
Going back in time to 2015 when the predominant trend was down . All moving averages were in a decline and inverted. I high lighted several trade signals-
Trade A would be early - on a weekly bar closing above the declining 6 & 10 ema- The Buy entry there could be at the market Close on Friday- but to make it simpler, assume a Buy the following Monday. It should not be a Buy during the week- even though price likely made a higher close intra week than it did on Friday- That would be similar to making a buy on a daily chart based on the moving price during the day- Wait to see how the bar closes to make a trading decision.
Let's assume that during a downtrend entry we know there is increased Risk, so we enter with a 1/2 position.
lets enter the remaining 1/2 position following a green bar close and the fast ema above the trailing 10. The initial entry sets a stop under the low of the weekly bar that signals to take the entry- and can later be adjusted. - Trade A needs the fast RSI to be turned up and ideally crossing the 50 level- and stochastic fast also should have crossed higher.
Trade B is on the green bar close-
As this trade had some follow through to the upside, and then declined- it is also the same as what can be seen on any daily chart- The question becomes when -and where- do you adjust stops tighter? Since the trade is taken with 2 positions, the exit should be scaled out of similarly with 2 separate stops -unless there is a major price breakdown. Perhaps when a green bar fails to be seen, drill down with a daily chart to determine where to set the higher profit stop on a winning position-
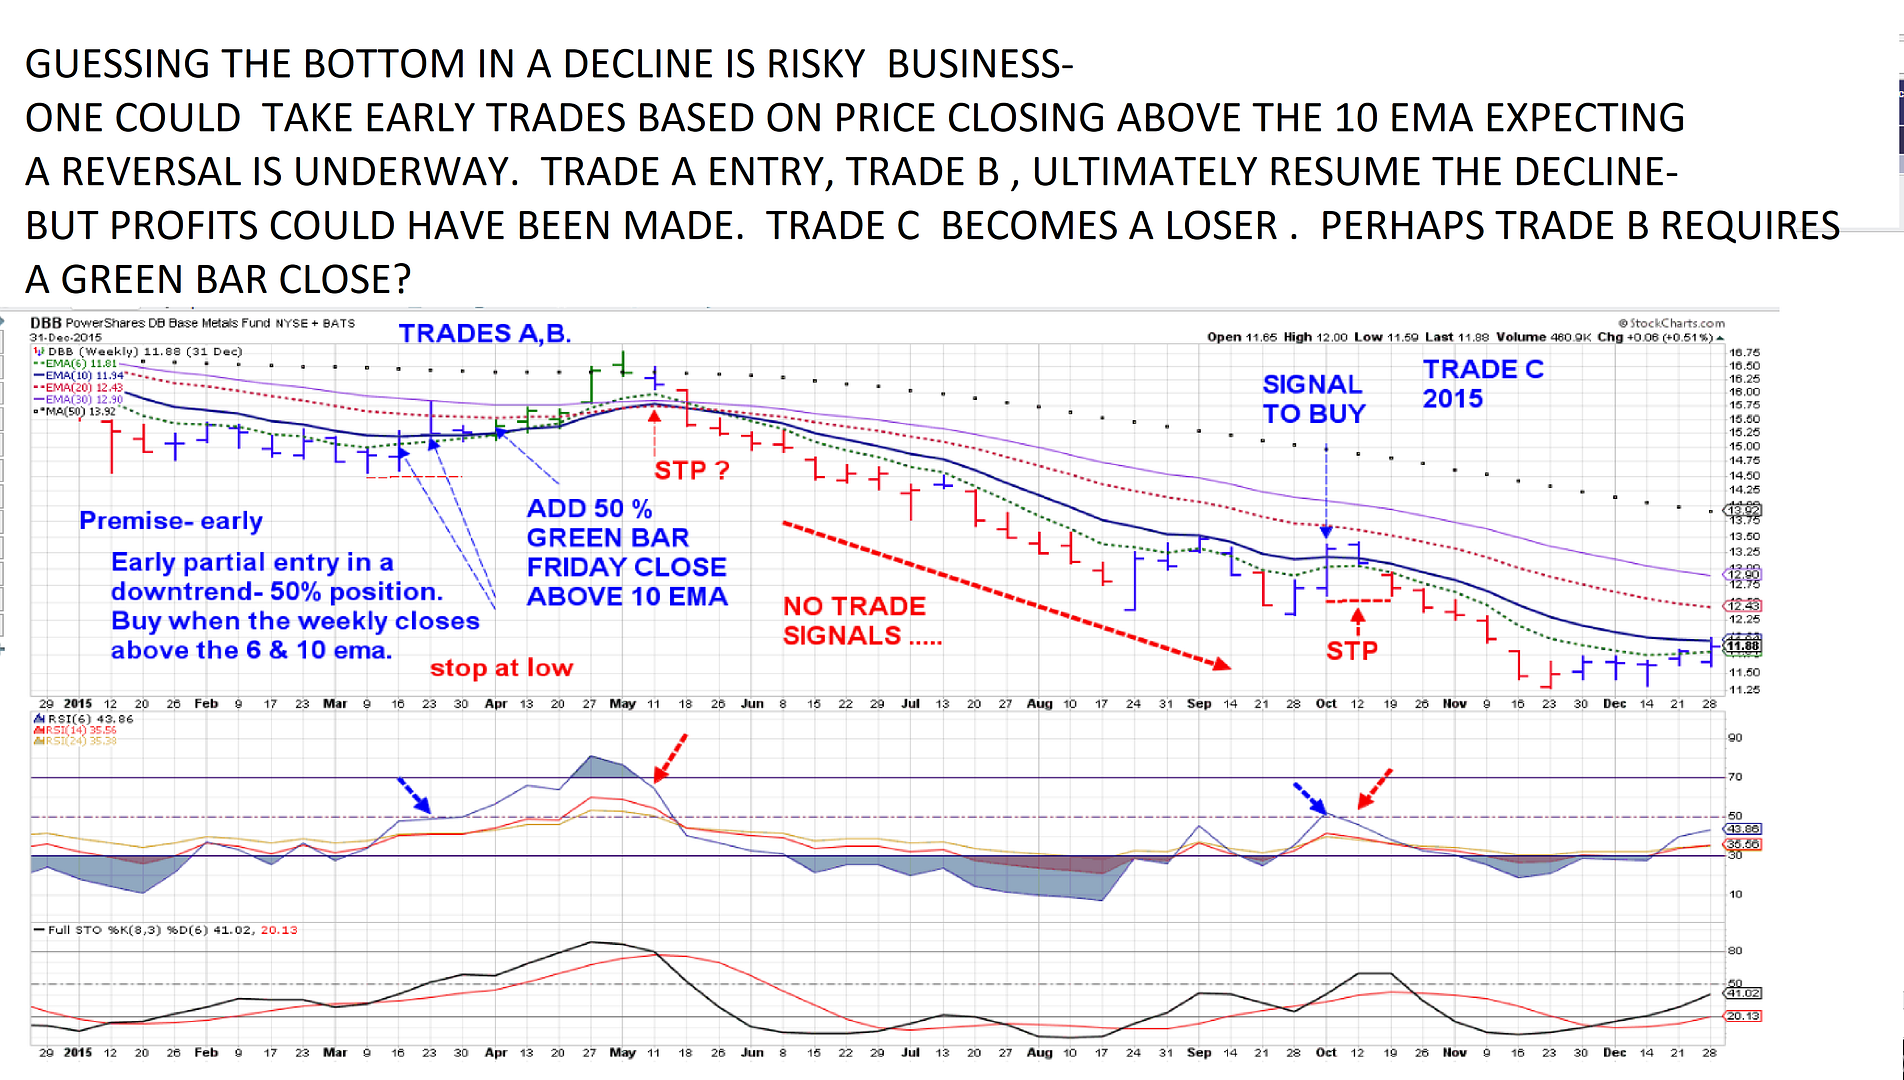
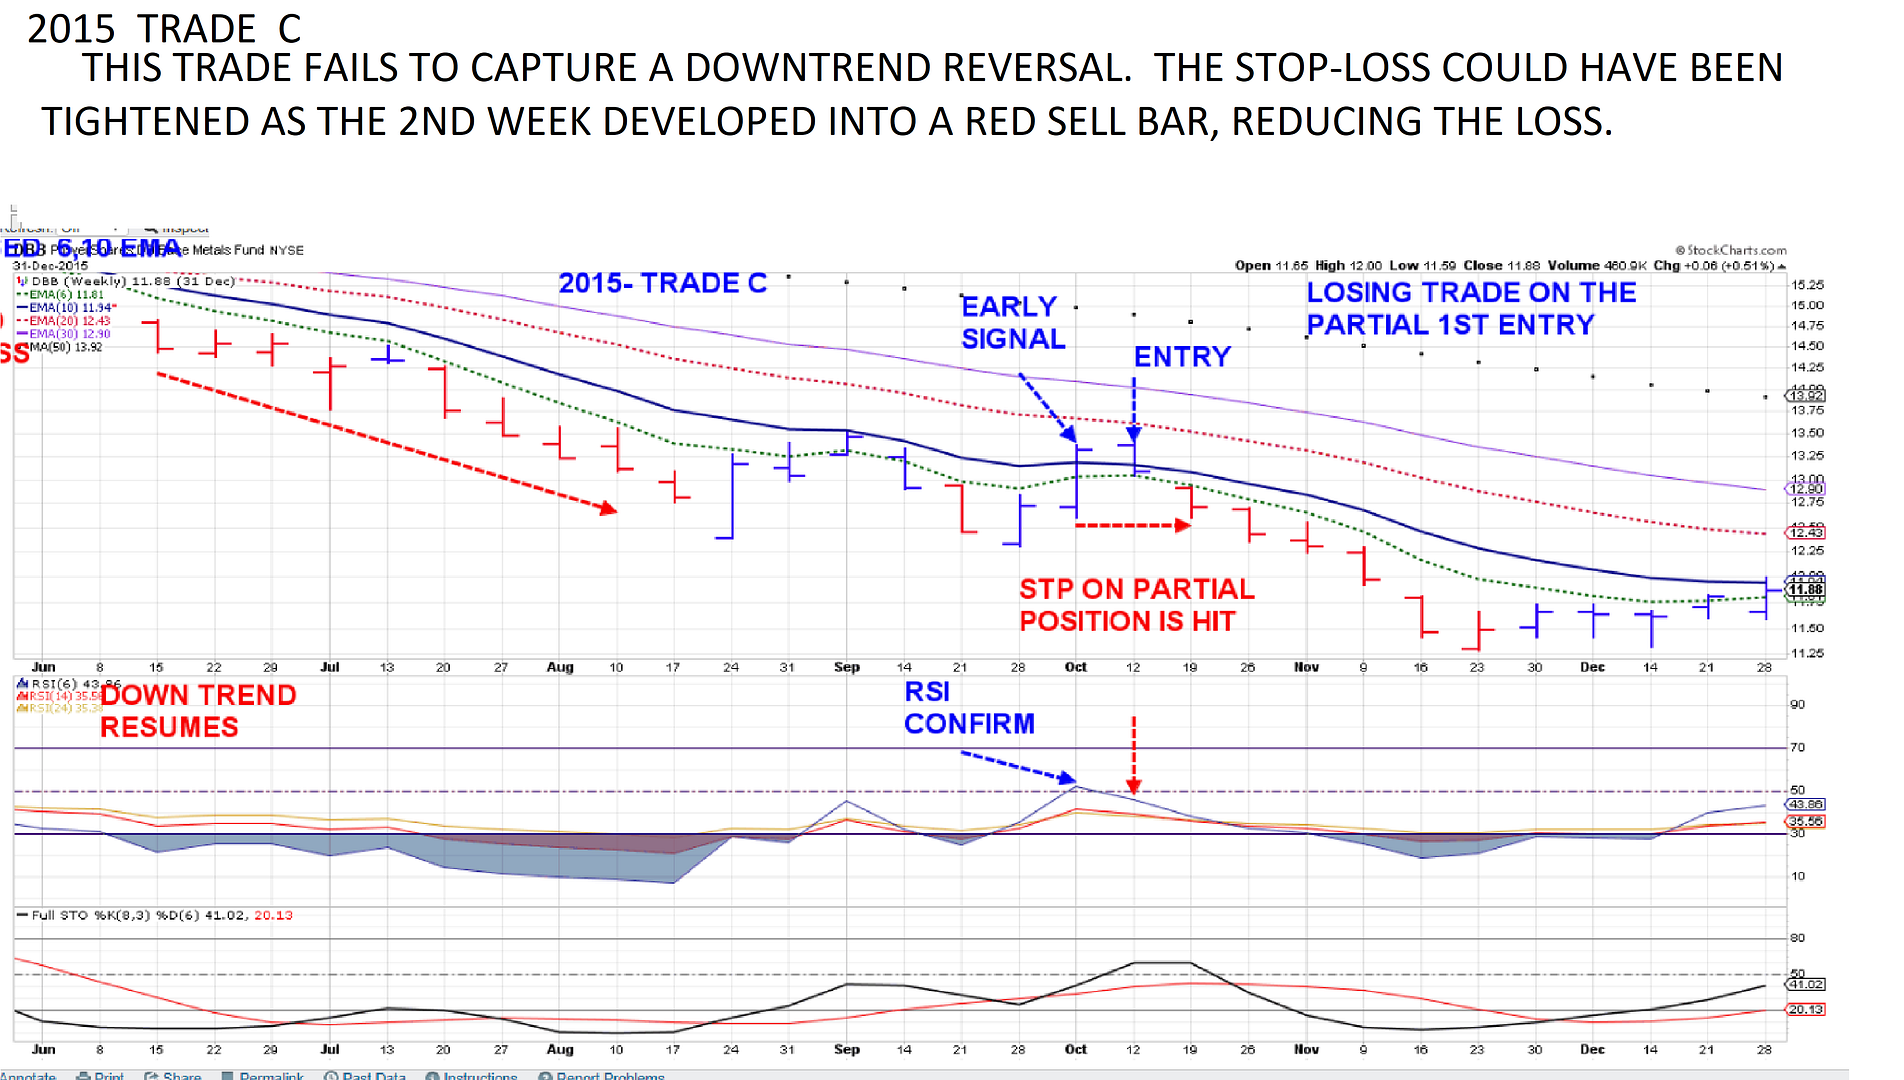
TRADE ENTRY C JUNE 2015-
The trend continued to decline... Finally, the red bars momentum gave way to a slower blue bar- The designated early entry permission that I am considering here likely will perform much better on pullbacks within a decline within a predominant uptrend- But let's follow this through.
We have a blue bar close above the declining 6 & 10 ema- This signals to take an entry on the Monday open. Notice that the RSI had crossed the 50 mid line- and stochastic was correctly upturned. Also- The price bar formation for the prior weeks had tried to make a turn higher. Price never was able to make any headway on that entry-and the following week price opened below that bar and declined further- . This could perhaps have been viewed with a daily chart vs a weekly to evaluate whether to raise the stop tighter intra week-
2016- D-H TRADE SIGNALS
Jan 26 weekly bar closes above the still declining 10 ema- wide bar, RSI crossing the 50, stochastic making a cross higher. Order fills at the open on the bar on Feb 1- which closes as the 1st green bar in 2016. Since it was a green bar- closing above the 6 & 10 ema, the second 1/2 order fills at the open on the 2-8 bar- While the faster 6,10 emas are turning up now,
we are early in the attempt to make a true trend reversal- when all emas are in sequence and moving higher- stops which were initially set at the blue bar low for the 1st position, and only slightly higher for the 2nd position get rewarded with 3 following weeks of higher closes, and a fast 6 ema upcrossing the 10,and 20 ema-.
Momentum slows with 2 tighter green bars in March, indicative of a basing operation . The Fast RSI declines with the slowing momentum, but holds above 70- stochastic converging with the slow red line. 3.21 Blue bar penetrates the fast ema- and makes a lower close- By this time, the 2 stops should have been raised- The latter E entry stop is tightened up to the low of the blue bar- or the 10 ema, and the D entry stop brought up to Break Even. Stops could have been tightened prior to this- but there wasn't any momentum gap away to chase-
the stop at the 10 ema gets hit 2 weeks later on the red bar penetration lower on 4-1. Profit was made on that stop getting hit- with a red bar, the remaining stop Could be raised up to the low of the red bar to lock in a small gain- or left at the B.E. area- In Practice- I likely would raise the stop to the bottom of that red bar.
note that APRIL into MAY, the declining emas flatten out and everything converges in MAY- This suggests a Base/trading range could be built-at this level-
The $11.00 swing low made at 2016 has to be considered the Point of Failure....
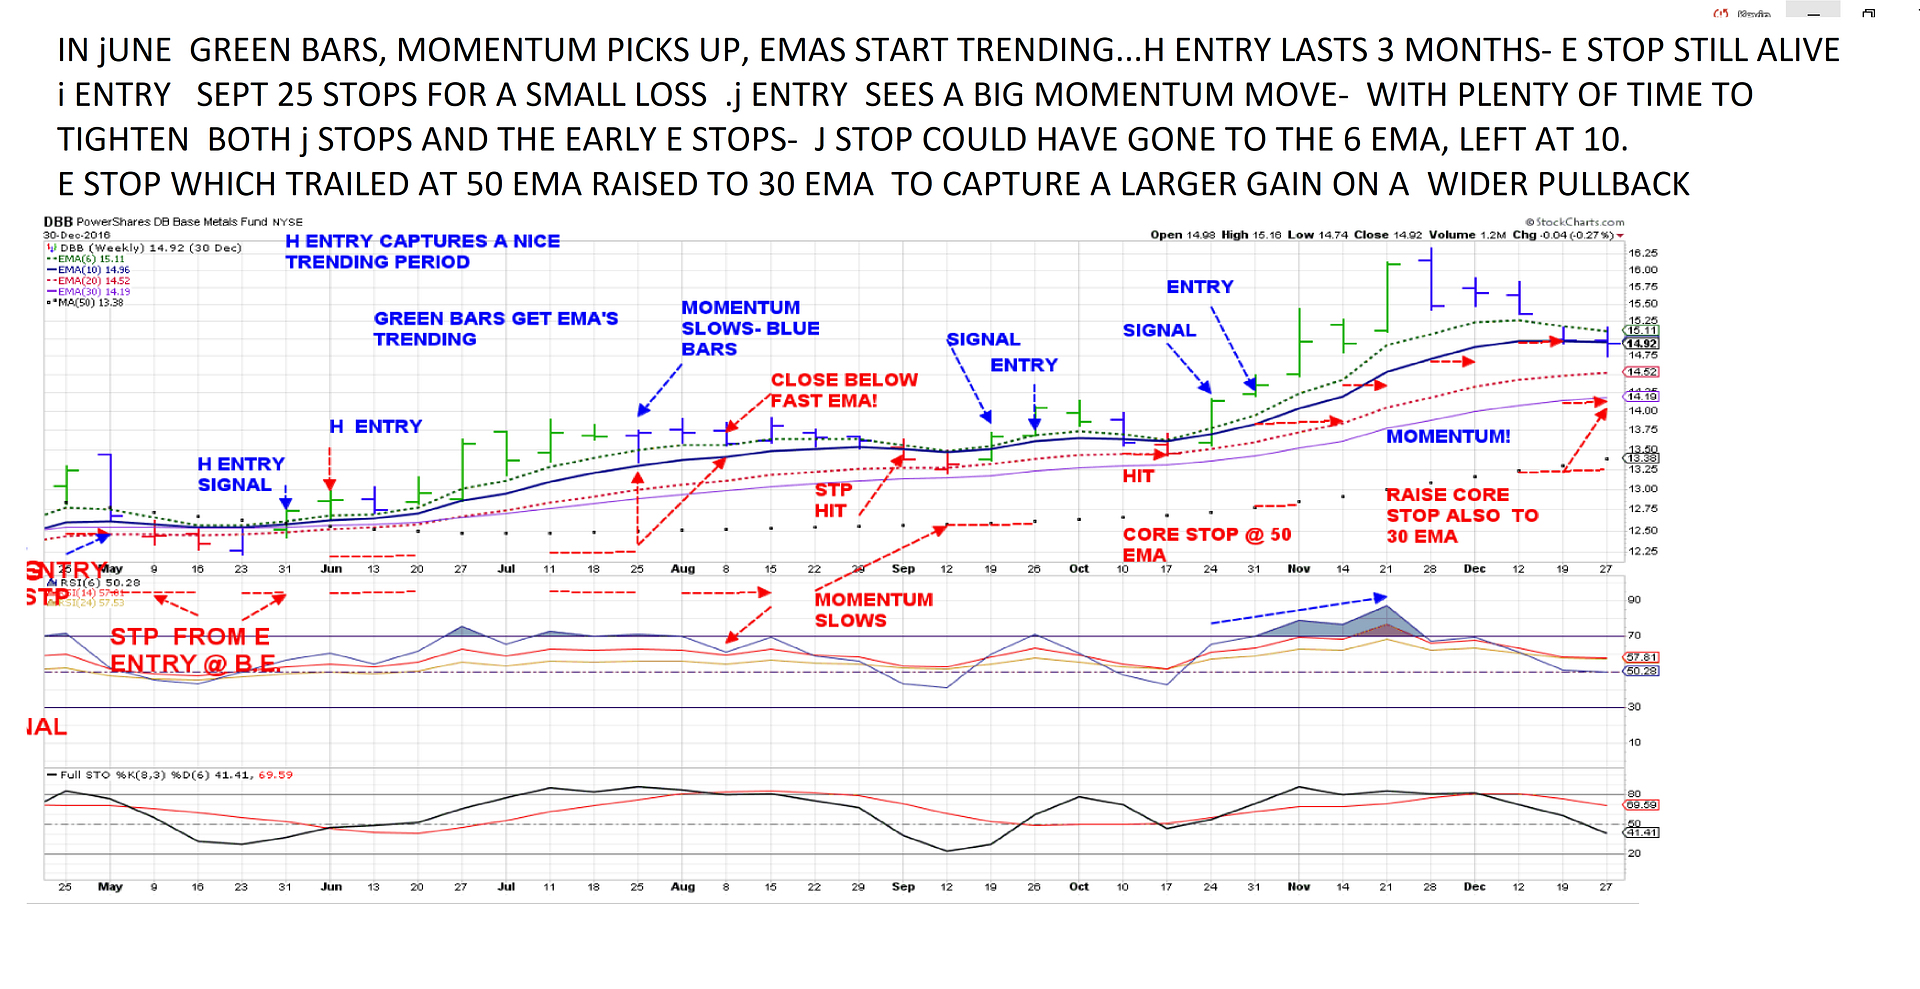
DBB 2016 D-H TRADE SIGNALS 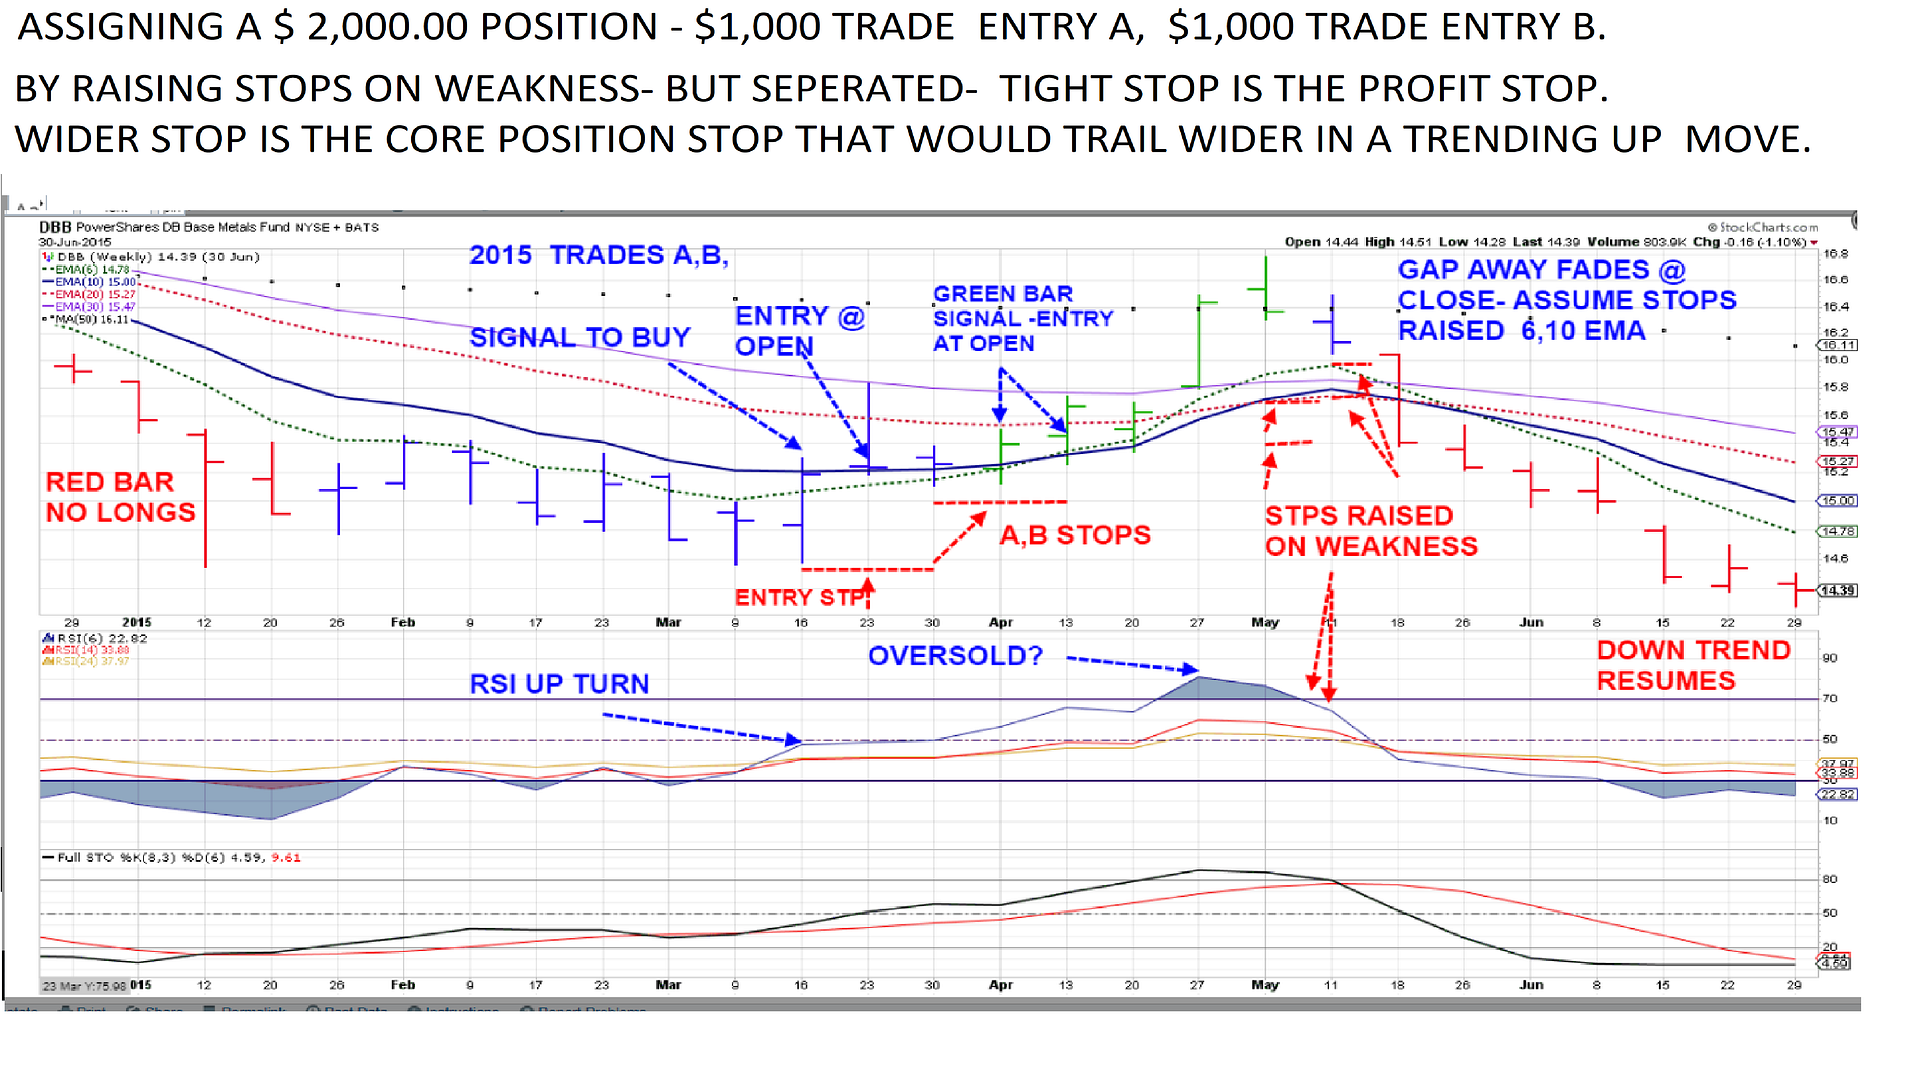 MAY - DEC 2016 MAY - DEC 2016
PRICE TRENDS IN JUNE....position holds gains for 3 months and stops out on a slowing in Sept. blue bars and rsi declining below 70 stop in Sept. A re-entry signal occurs a few weeks latergreen bar- and -stops out -for a loss if the stop waits onthe 10-10 bar to close- below the fast ema before being raised to the 10 ema- it stops out on the red bar open 10-17.
a reentry signal the next week 10-24 gets an entry in a strong momentum up move that lasts for 3 weeks before a wide ranging blue bar with a lower close occurs. At this point, since this is a wide momentum move- one option would be to aggressively tighten to the fast ema, instead of the 10 ema- That would not make much difference as price ended up gapping down to hit the 10 ema stop. At the same time, because of the excess momentum move, the E stop from early on that had been moved to the 50 ema earlier- let's go for a bit more gain, and take it up to the 30 ema- and see if a new trend higher holds-
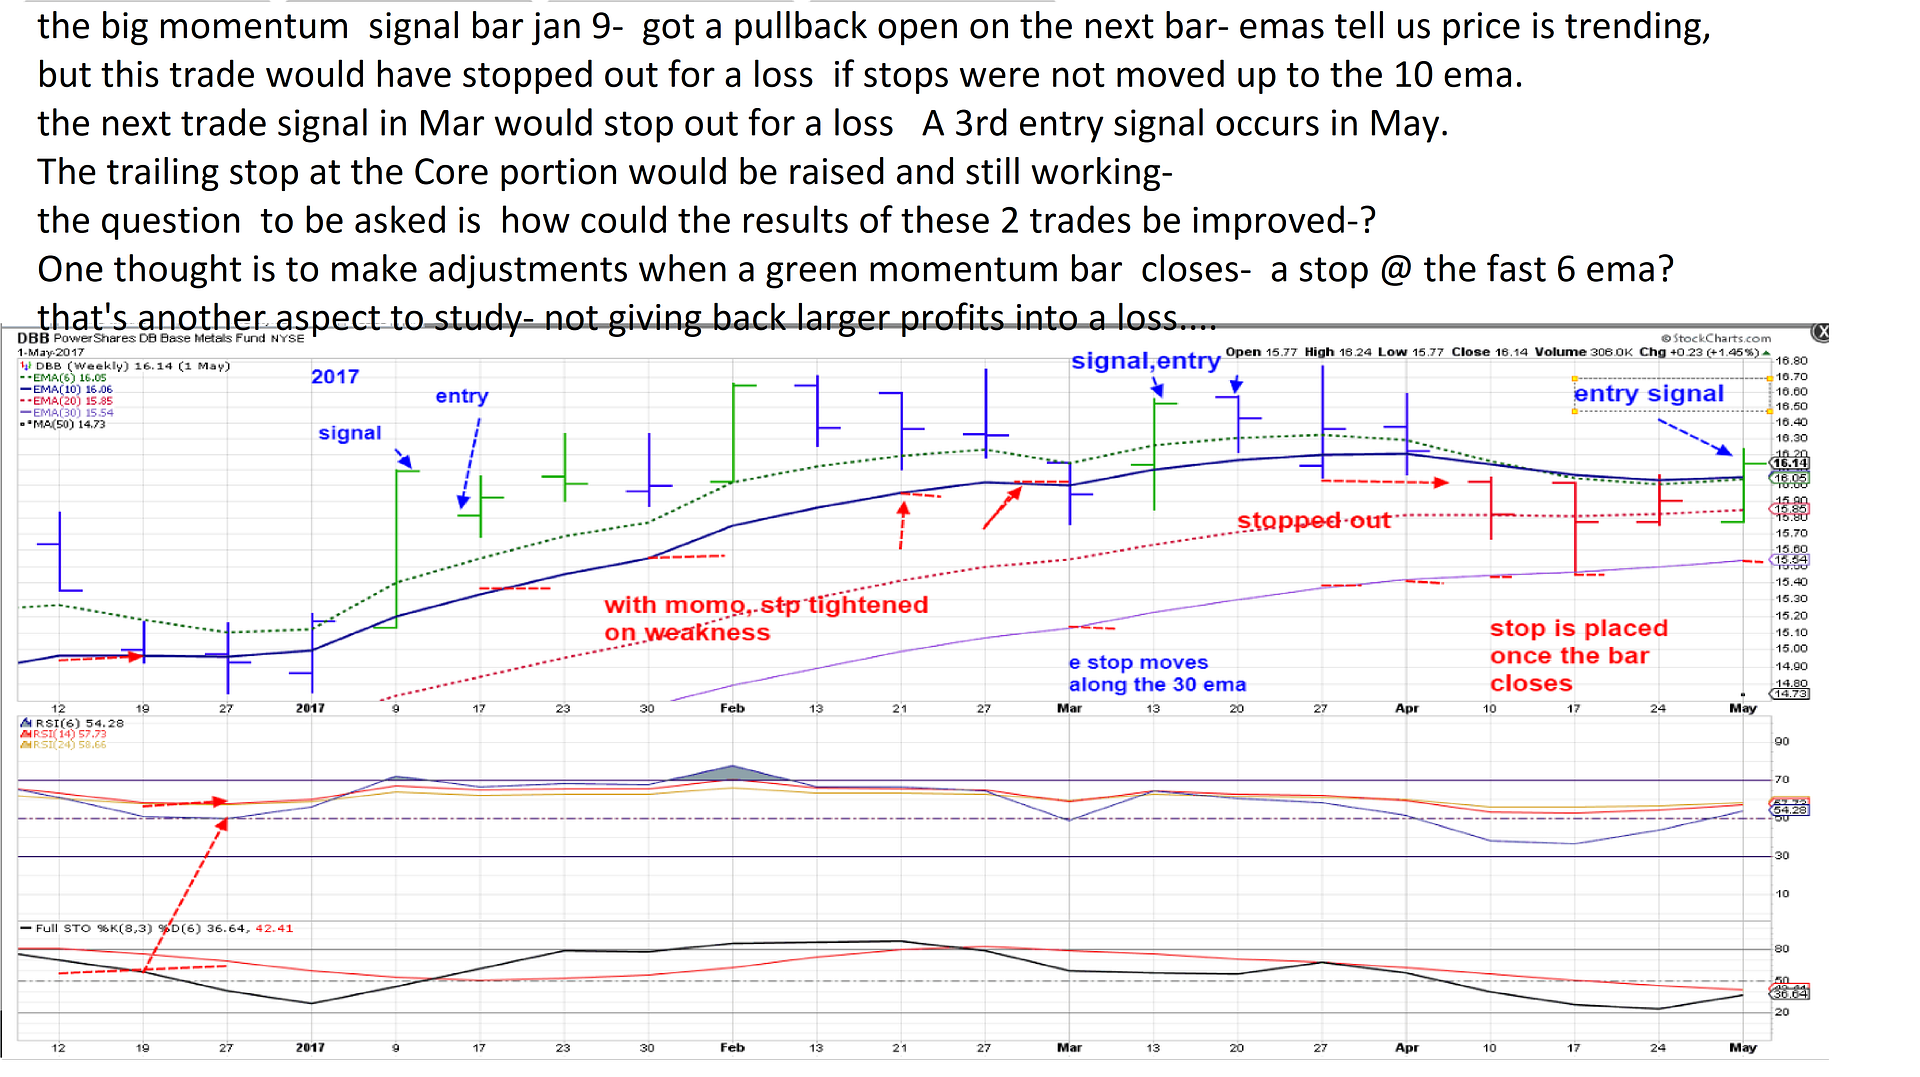
2017 really initially appears it should have been profitable- EMAs were trending - but the 1st large momentum bar was very wide- signal bar, and the entry was lower but there wasn't any follow up momentum- it comes to mind that other options could be used- for example with each successful green bar closing, a stop-loss could be trailed at the ema below that completed bar- but that's not looked at here- moving the stops up to the 10 ema as momentum slows capture only a small gain . The second trade is a loss.
In May another signal to Buy occurs
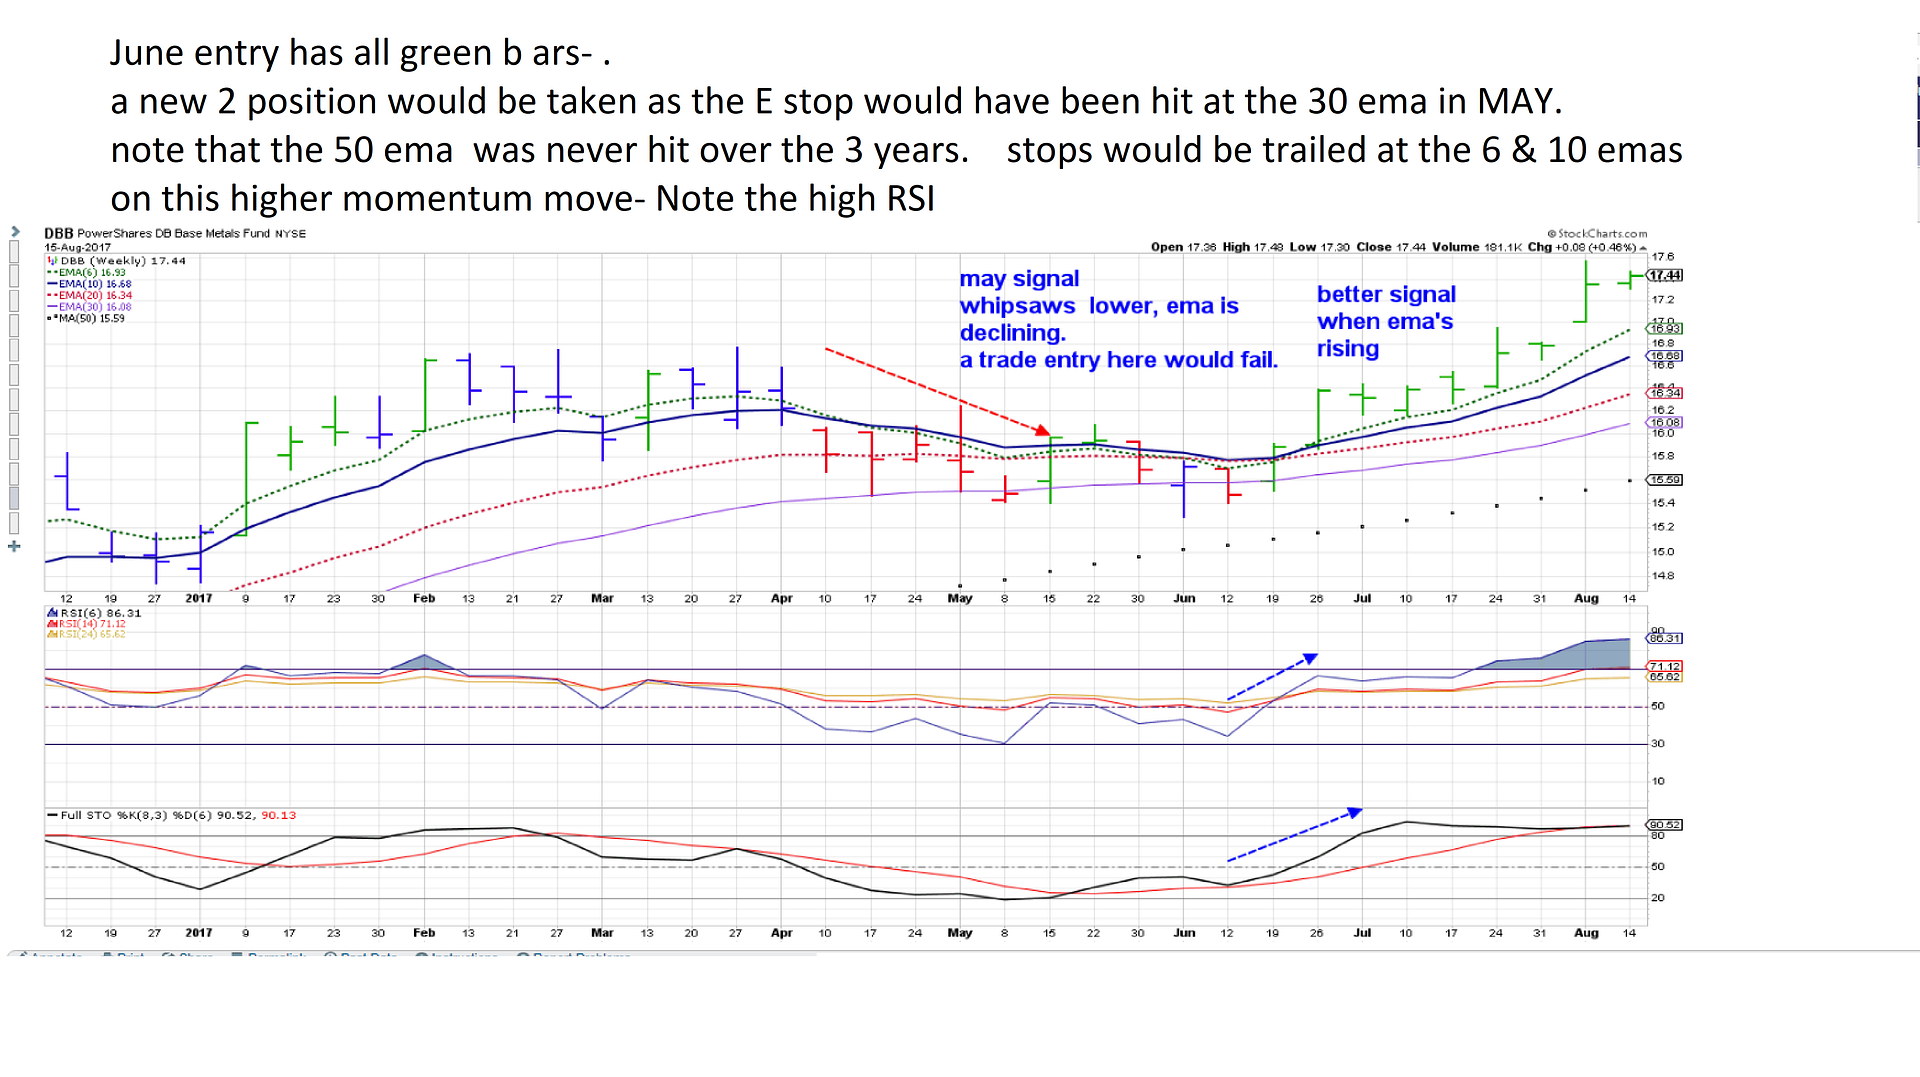
Final chart up to present finds a strong momentum move with a full position being taken- 2 entries as the trailing stop moved up to the 30 ema booked a long term gain as price pulled back- the 50 ema was never touched the entire time-
While this was a good start to backtest- It leaves plenty of thoughts as to how it could be adjusted..
|
|
|
|
Post by sd on Aug 16, 2017 9:55:47 GMT -5
As seen in the prior post with DBB, waiting on the 1st green bar to close as an entry signal -essentially entering at week 2- leads directly to the realization that the weekly moves higher have already covered the moves of the prior 5 days.... Which sometimes was the majority of the up move contained in the 1st week-
Looking at a stock I have a position in - BOTZ since it started to make a primary up trend move- I'm going back prior to my entries to where the trend started to turn up- and will examine
the approach of entering after a green bar close on the next bar. Entry stop below the low of the entry signal bar. Once price is trending , stops could be trailed lagging at the 10 ema- but tightened on any blue bar directly under price closing bars, and particularly when the fast RSI breaks below 70. Since hindsight tells us that this is a strong trending stock, it is perhaps just an "ideal" situation. and does not reflect the wider volatility of other positions-
But, this is worth a study of both the Elder Impulse Green, blue, red bar approach that includes a momentum MACD input- and moving averages....Also Not really reviewed in depth, but the RSI
and stochastic may be looked at for confirmation, and perhaps early warnings (divergence) of price momentum changing.
Simply will start with Price bars.
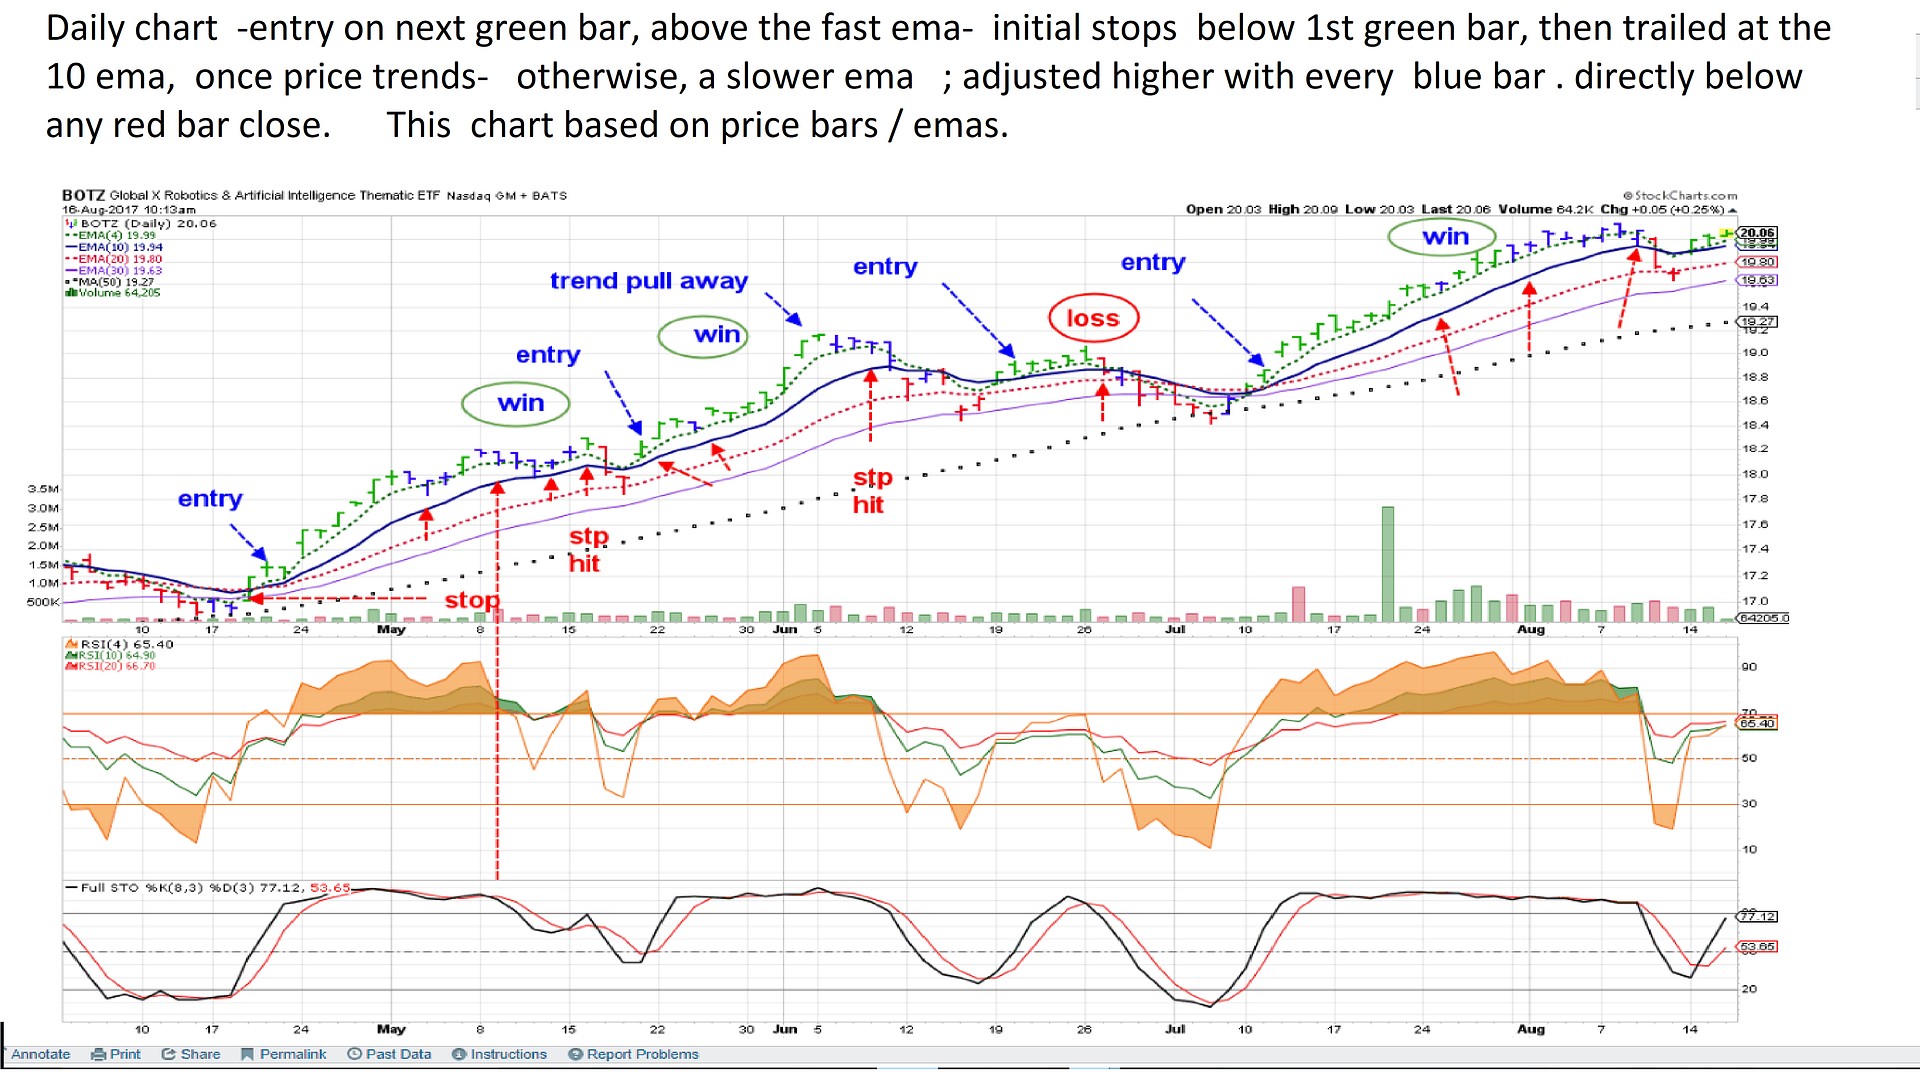
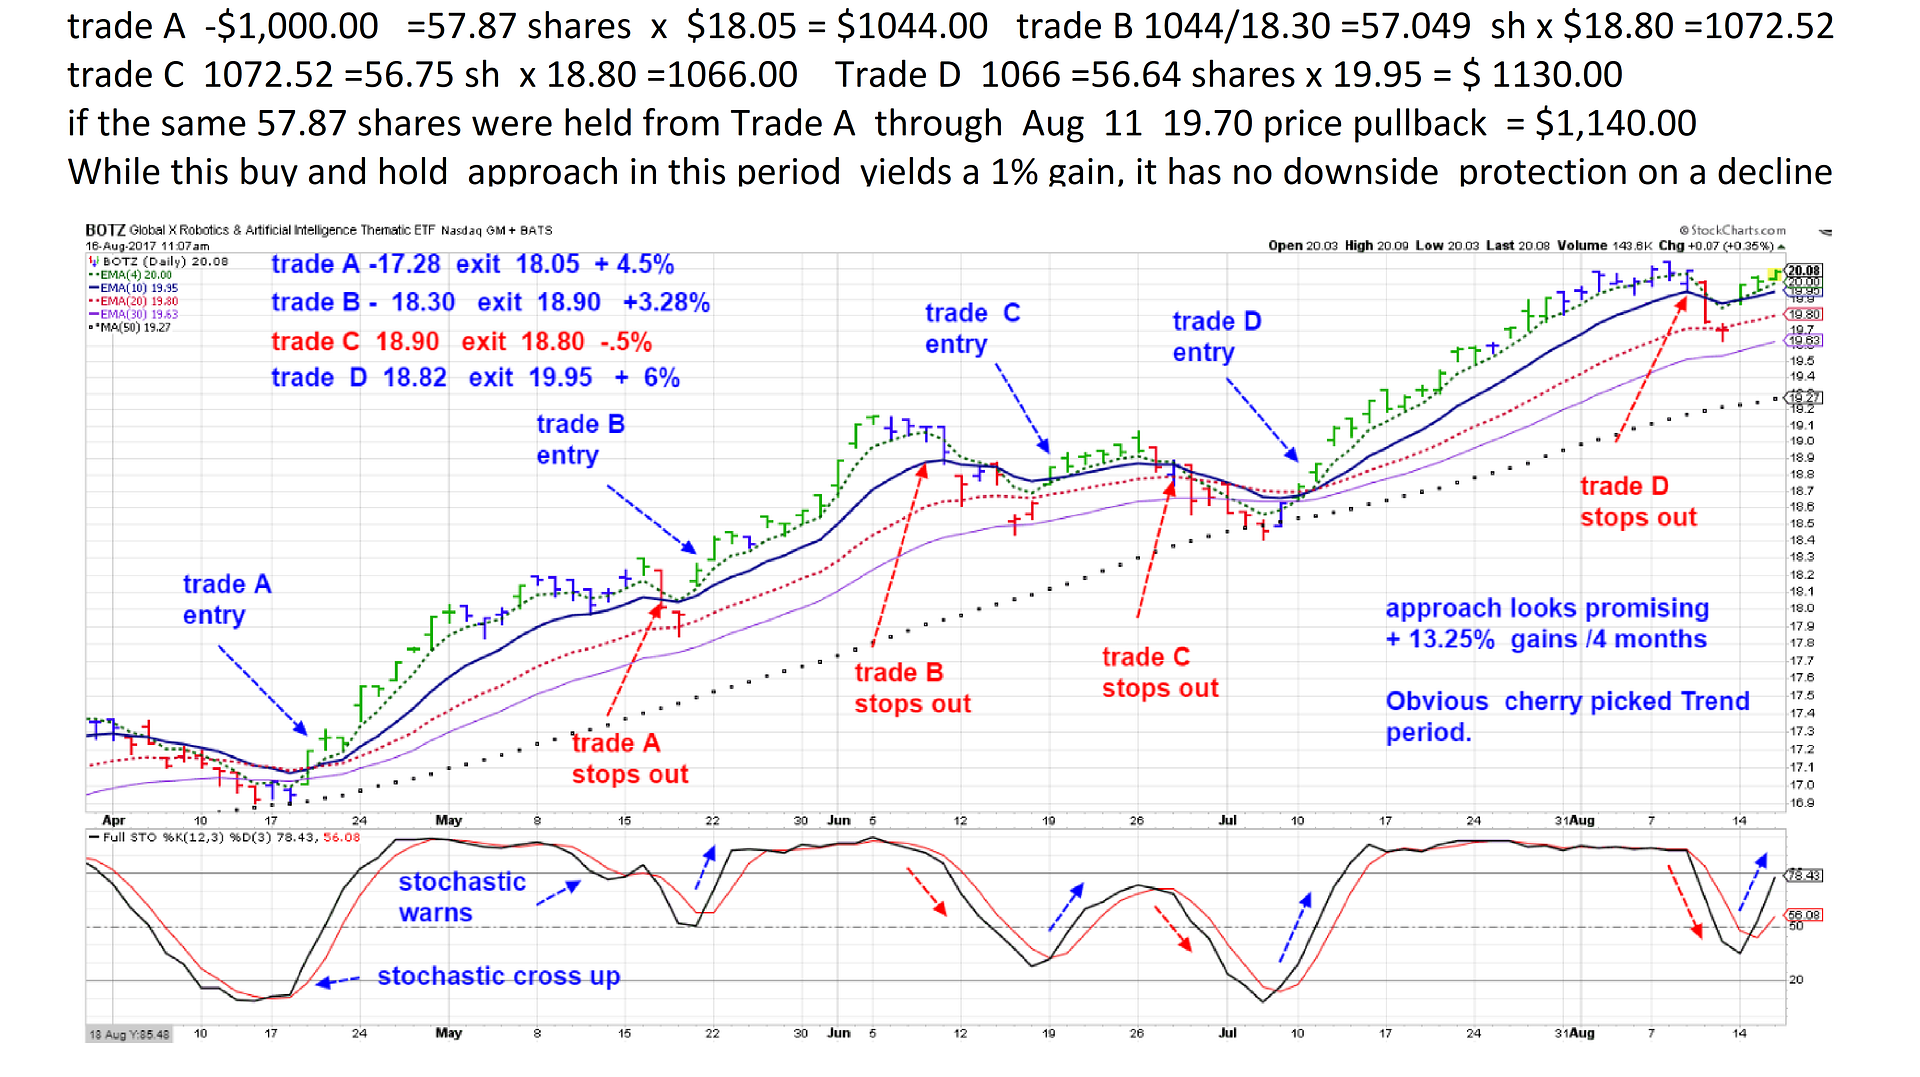
another look at Botz illustrates that a Buy and Hold approach yields a slightly larger gain over the multiple trade approach- In fairness, commission costs would have really diminished the results on only taking on a small $1,000 entry- and paying 8 commissions @ retail cost = $8 x 7 = $56.00 commission costs - or 43% of the $130.00 net gain.
Keeping in mind that such high commission impact can be found by trading small positions through lower cost brokers- Fidelity about $5.00 IB Just $1-/100 share would be just $8 in cost.
Not to get off the track- Commissions have to be accounted for- but the focus is to consider technical elements of this trade signal approach.
While the Buy and Hold has a slightly better gain, it has absolutely No downside protection.
I think this is a very important consideration - particularly if one is already trading and has a mindset they are in an extended market- We know corrections occur, we know they can be sharp and fast-
The other item to point out- is that this particular approach worked well with trailing stops placed along the 10 ema- other -more volatile stocks could be considered by understanding the ATR past history, and perhaps selecting a wider ema or trailing further behind on the 10 ema- Unless there was a bar that required tighter adjustment-
I wanted to view a consistent approach applied with a basic set of guidelines-eliminating as much discretion as possible.
but some other profit maximising tweaks could be used- The one that is obvious is during those relatively rare moments when price momentum jumps away- Note the bulging of the fast ema and possibly the 10 ema away from the slower ema's-
One option would be to keep part of the position trailing at the 10 ema, and another to trail at the fast ema- and perhaps set a limit high well above price for that more aggressive portion- capturing the greater momentum- Also- big momentum spikes are often signified with tell tale topping signs and lower closes-
 and the weekly chart: and the weekly chart: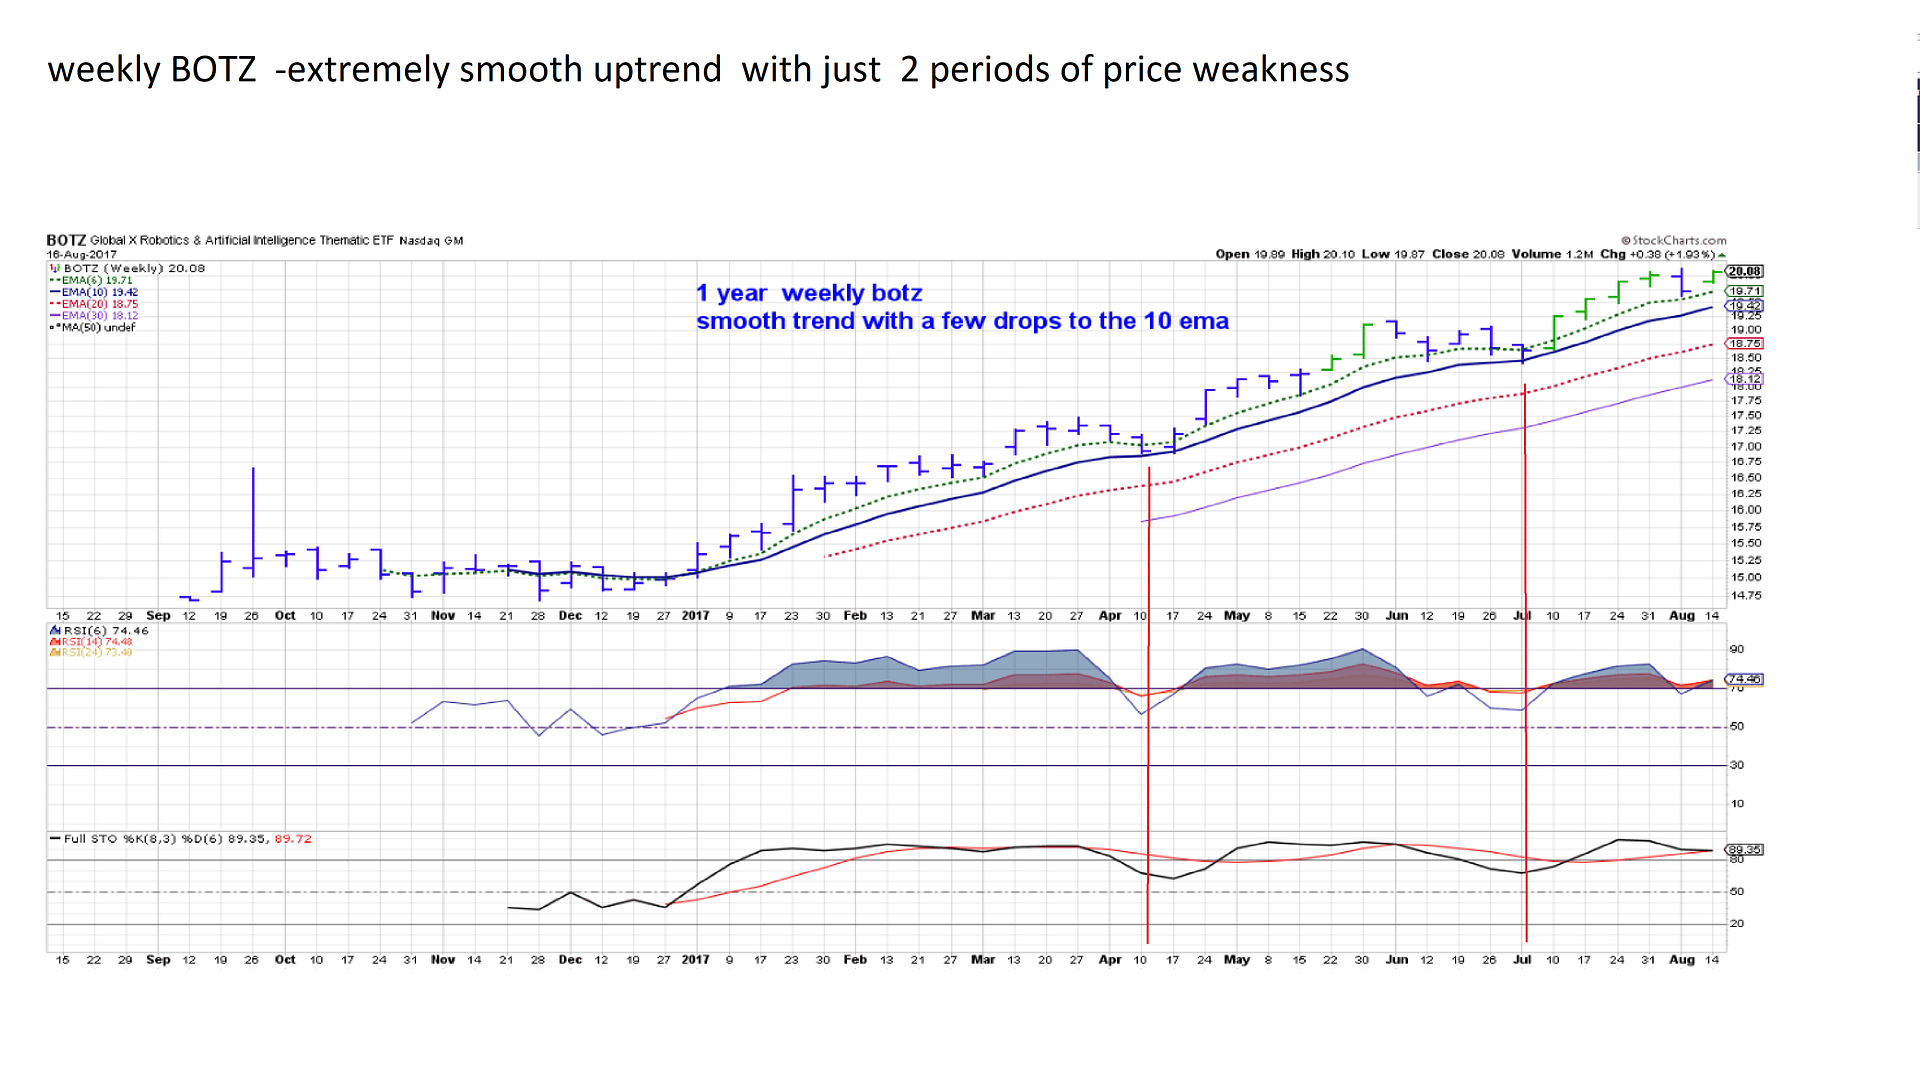
|
|
|
|
Post by sd on Aug 16, 2017 16:29:03 GMT -5
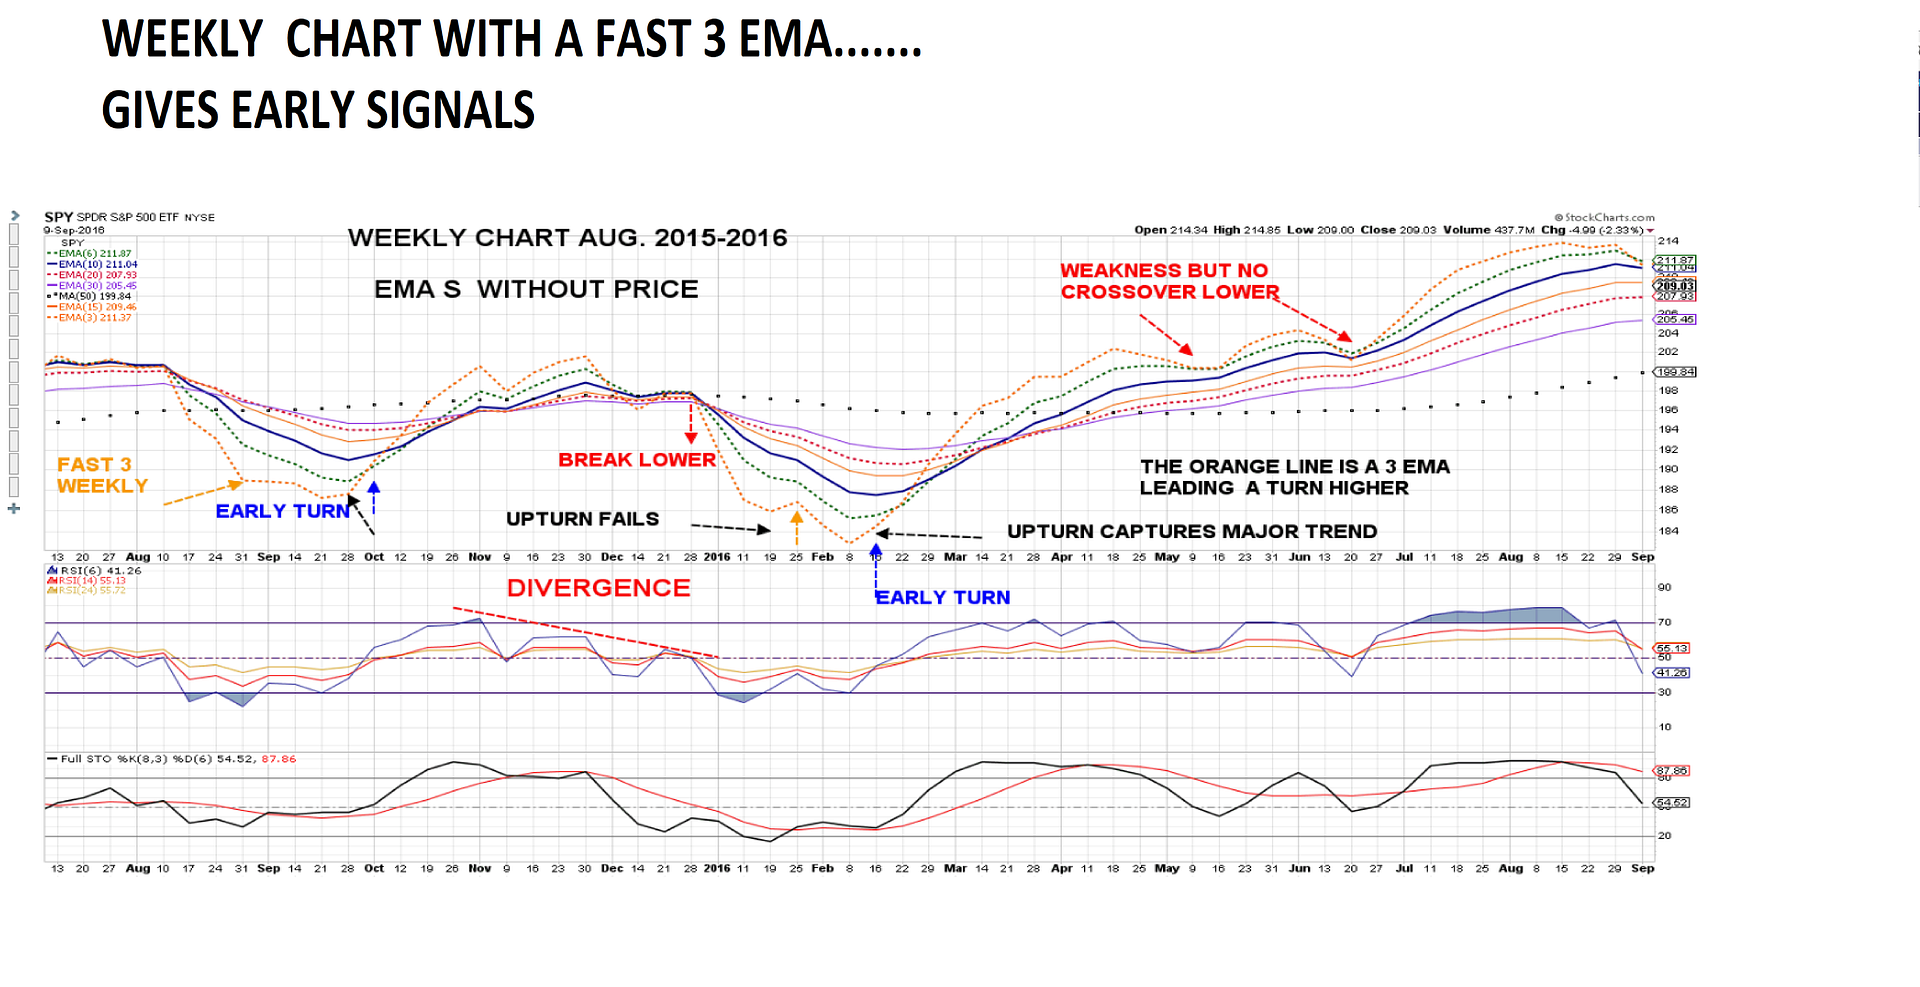
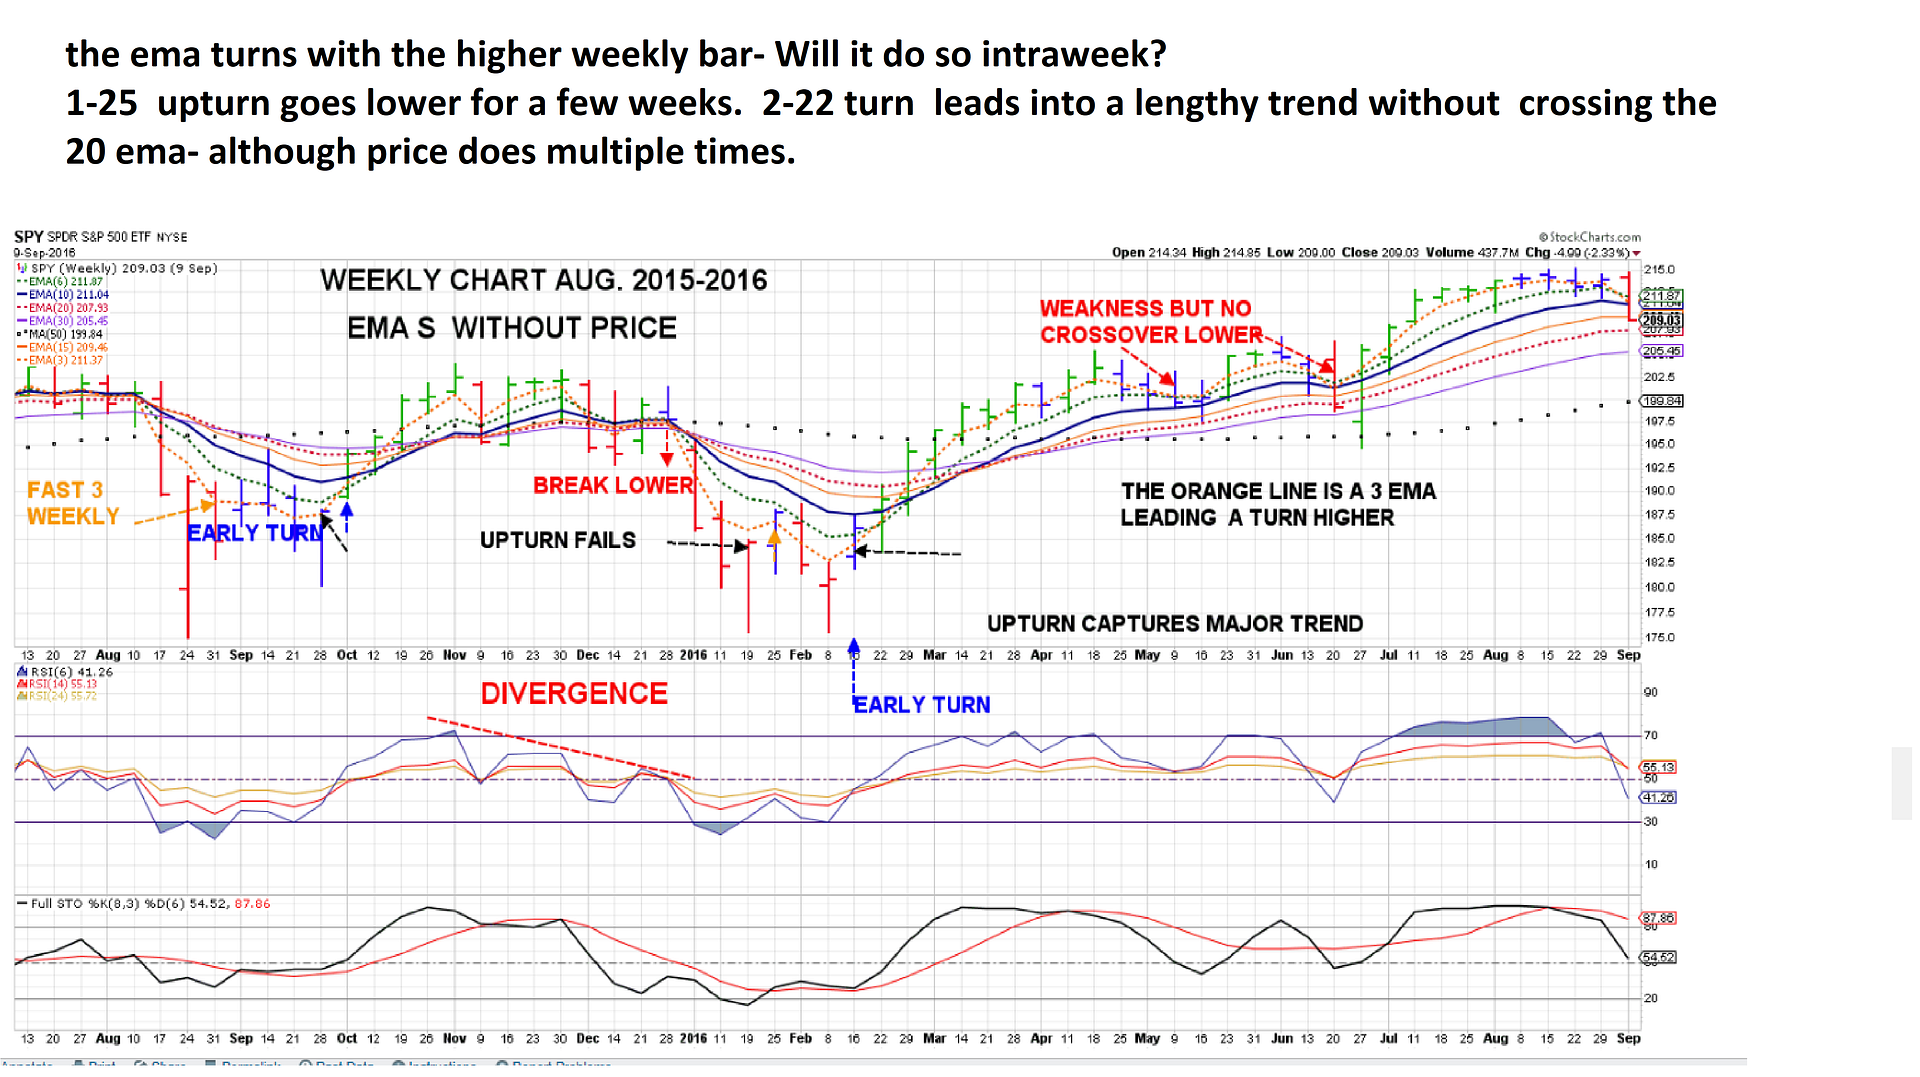
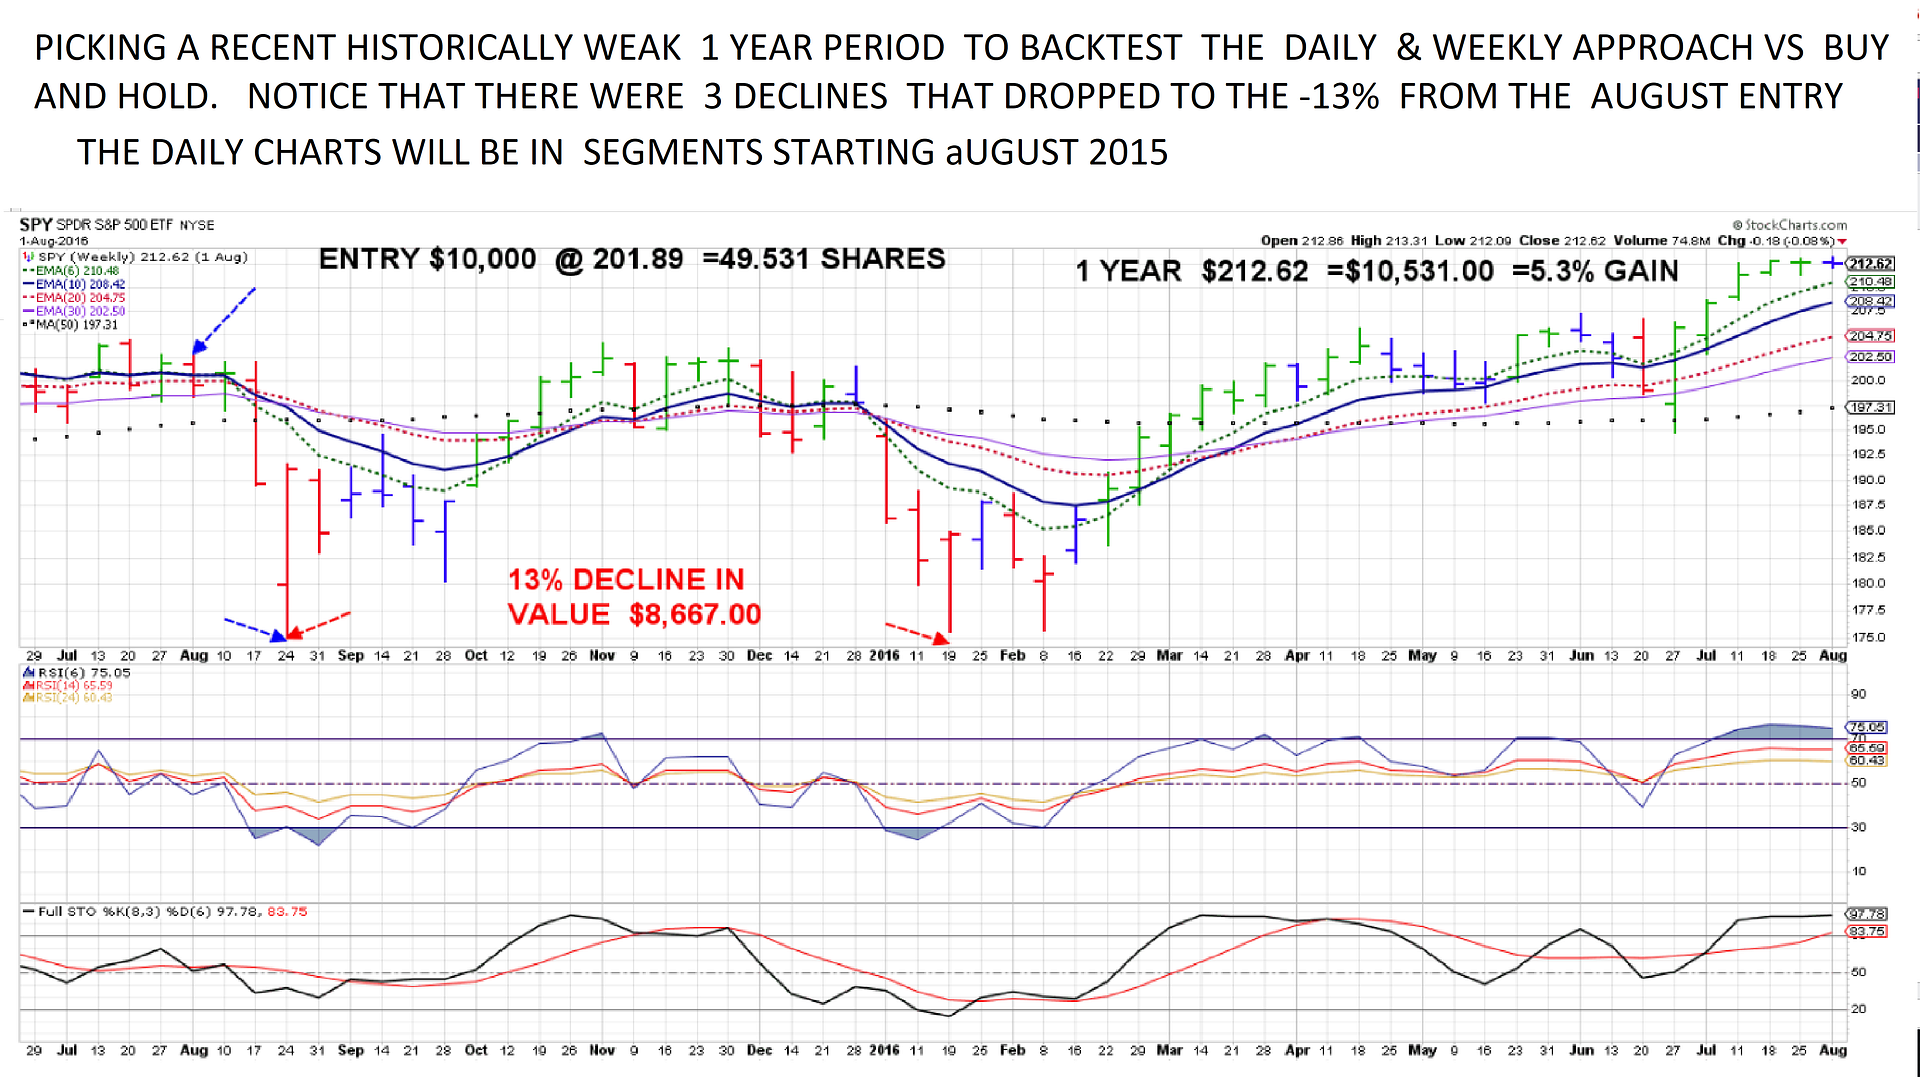
COMPARING SPY Looking at a period of volatility AUGUST 2015 -2016...
Weekly chart starts with a $10,000 investment in August 2015 and held through several 13% declines to end up in August 2016 with a 5% gain.
Due to time limitations- and i think improved results- I'll start with the Daily approach-
recognizing when the trend was all down should require some different entry requirements- We'll see ...
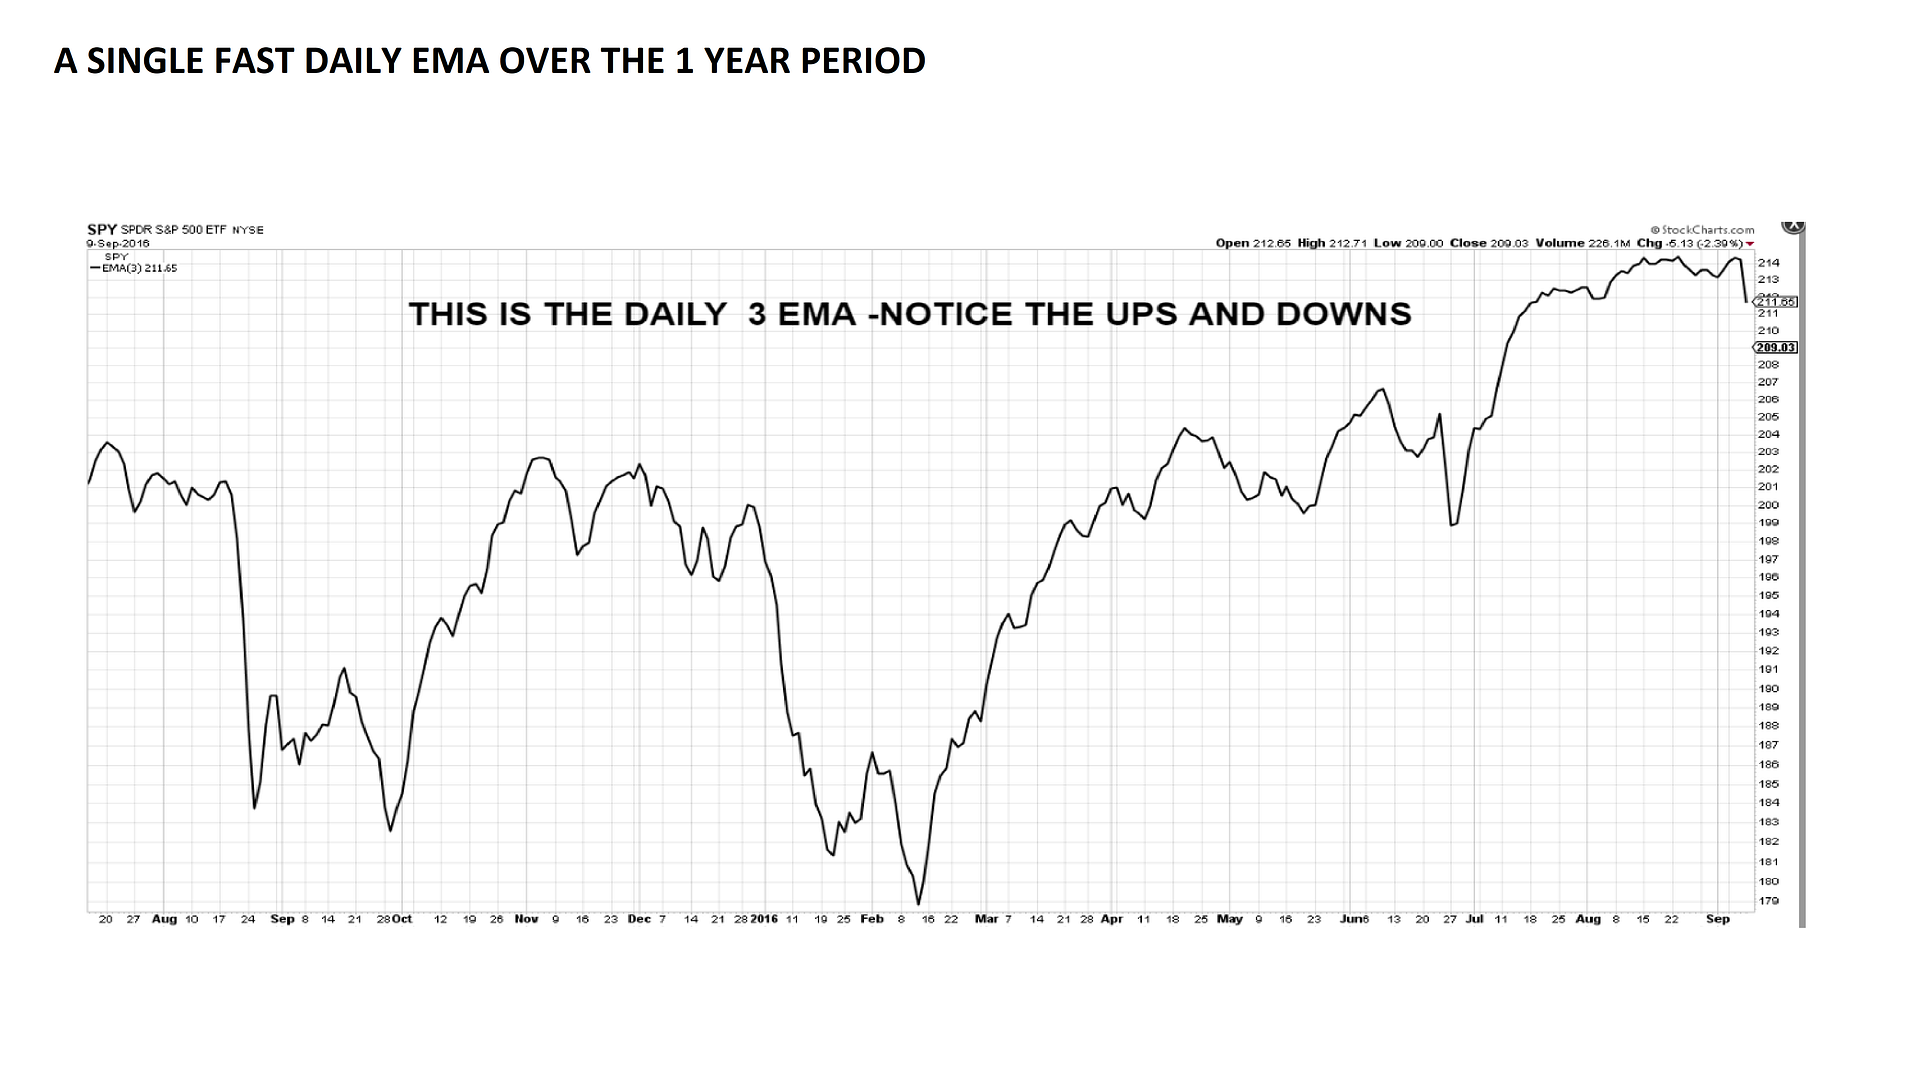
A LOOK AT A 1 YEAR DAILY CHART- PLENTY OF VOLATILITY!
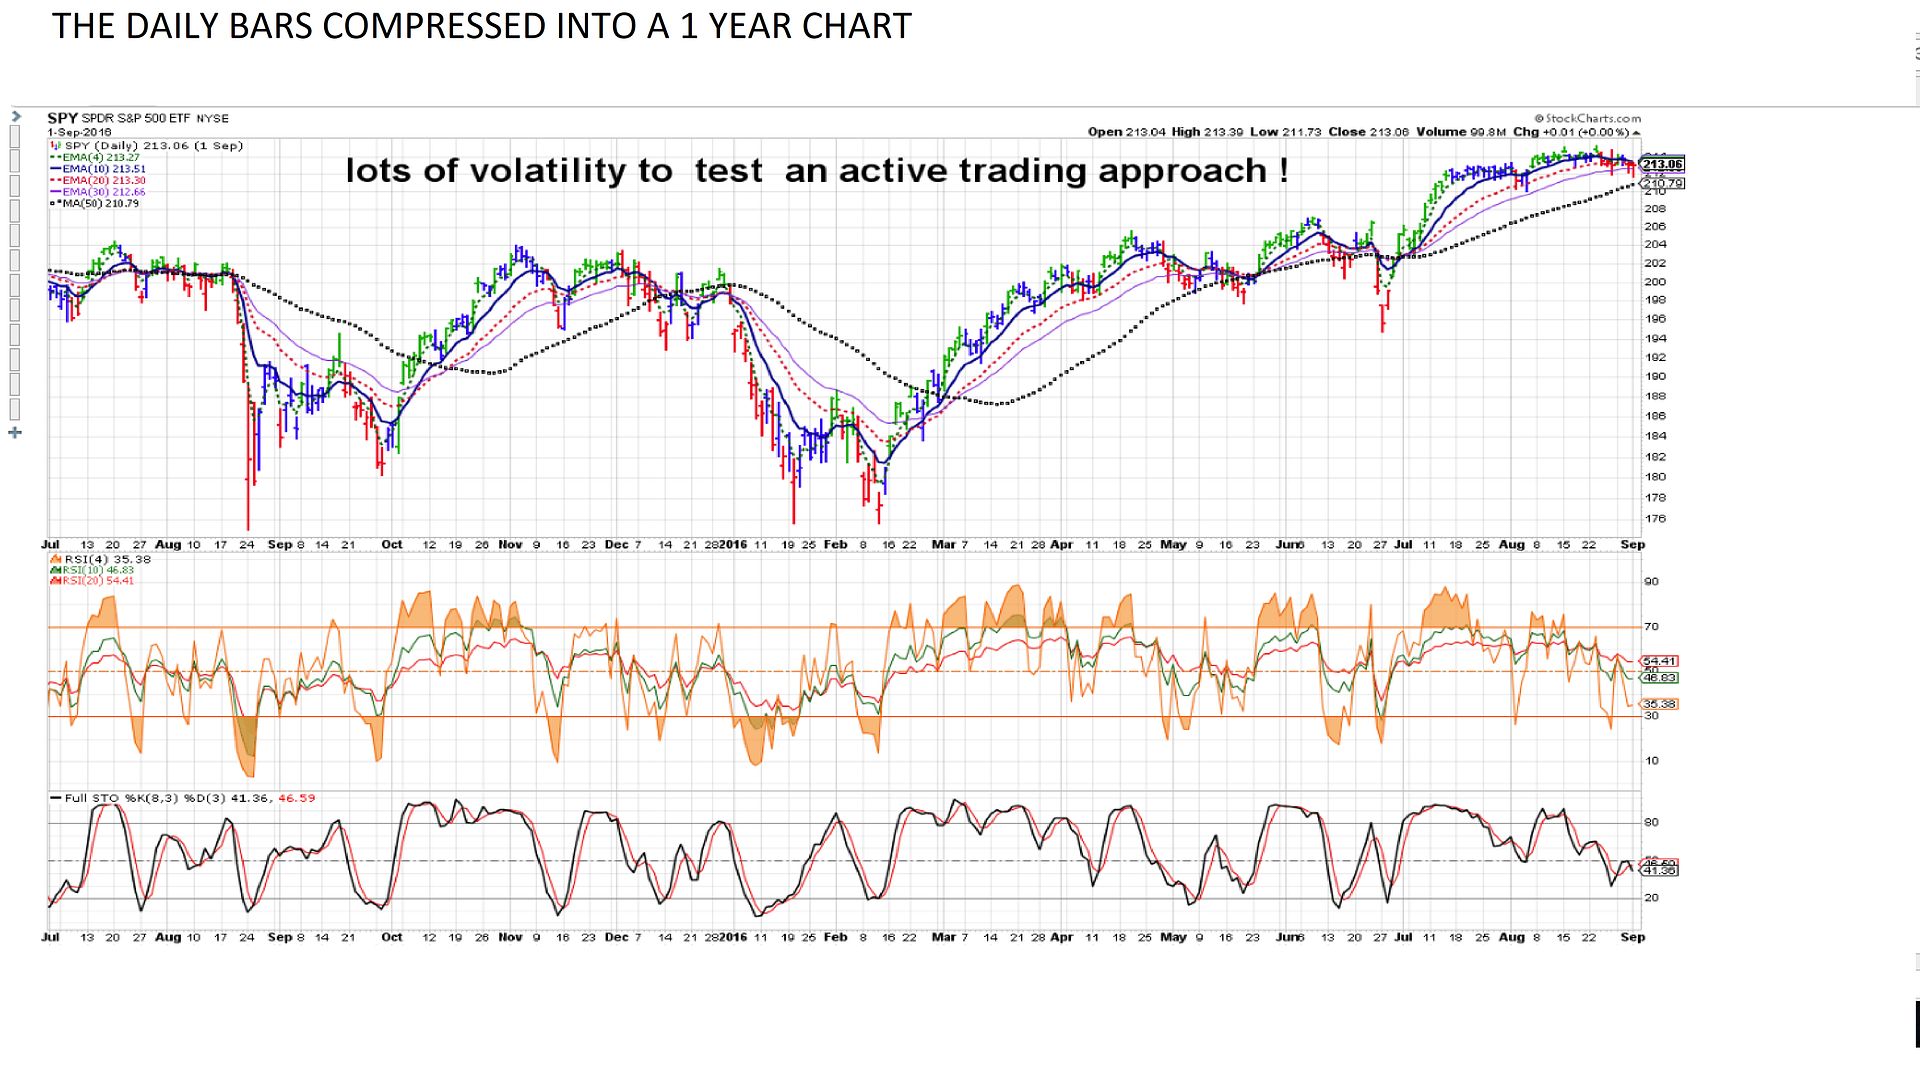
Frustrating computer interruptions- Try this again
Get a bit brief-
Volatility is where traders reportedly make the big bucks- Retail traders get chopped up in the process- This is You and ME! this study is a starting point to consider regarding how i have approached my trading with more discretion than system- and success comes with a trending market - A trending market forgives mistakes and might even make us think that we got this whole investing/trading stuff in the bag! What happens when volatility returns? Chop, Chop,
Chart study of 1 year where volatility was the norm-
I tried to not custom fit the approach - and keep it systematic as the starting point- Not including any indicator inputs to start with, and No discretion-
When primary 6,10,20,30 emas are declining- No entry until price CLOSES above the 20 ema along with a fast 6 ema ready to cross-higher-or crossing- Ignore bars that do not Close- above....Yes, there was a lot of potential opportunity in the 3 weeks that occurred from the red bar low 8-24- until the signal bar made the close- Not part of this study....
Entry is Buy the Open the next day, with a stop under the signal bar or the fast ema value below that bar. As the trade progresses in your favor, and the emas turn, stop can be trailed at the slower 20 ema- but if a bar penetrates the fast ema, or closes below- the option is to tighten stops to the 10 ema or the low of that bar- If it's a red bar- stop is set at the low.
Won't worry about trying to capture momentum moves in this study. For anyone interested in this type of approach- the colored bars are from Stockcharts choices- "Elder Impulse" . I find some multiple RSI values interesting ,and stochastic often does an early indication of a price change- Don't want to make this interprative or complicated
at this point- let's see how this actually performs- as is- If anyone reading this finds i have made an egregious (sp?) error- it's not intentional.
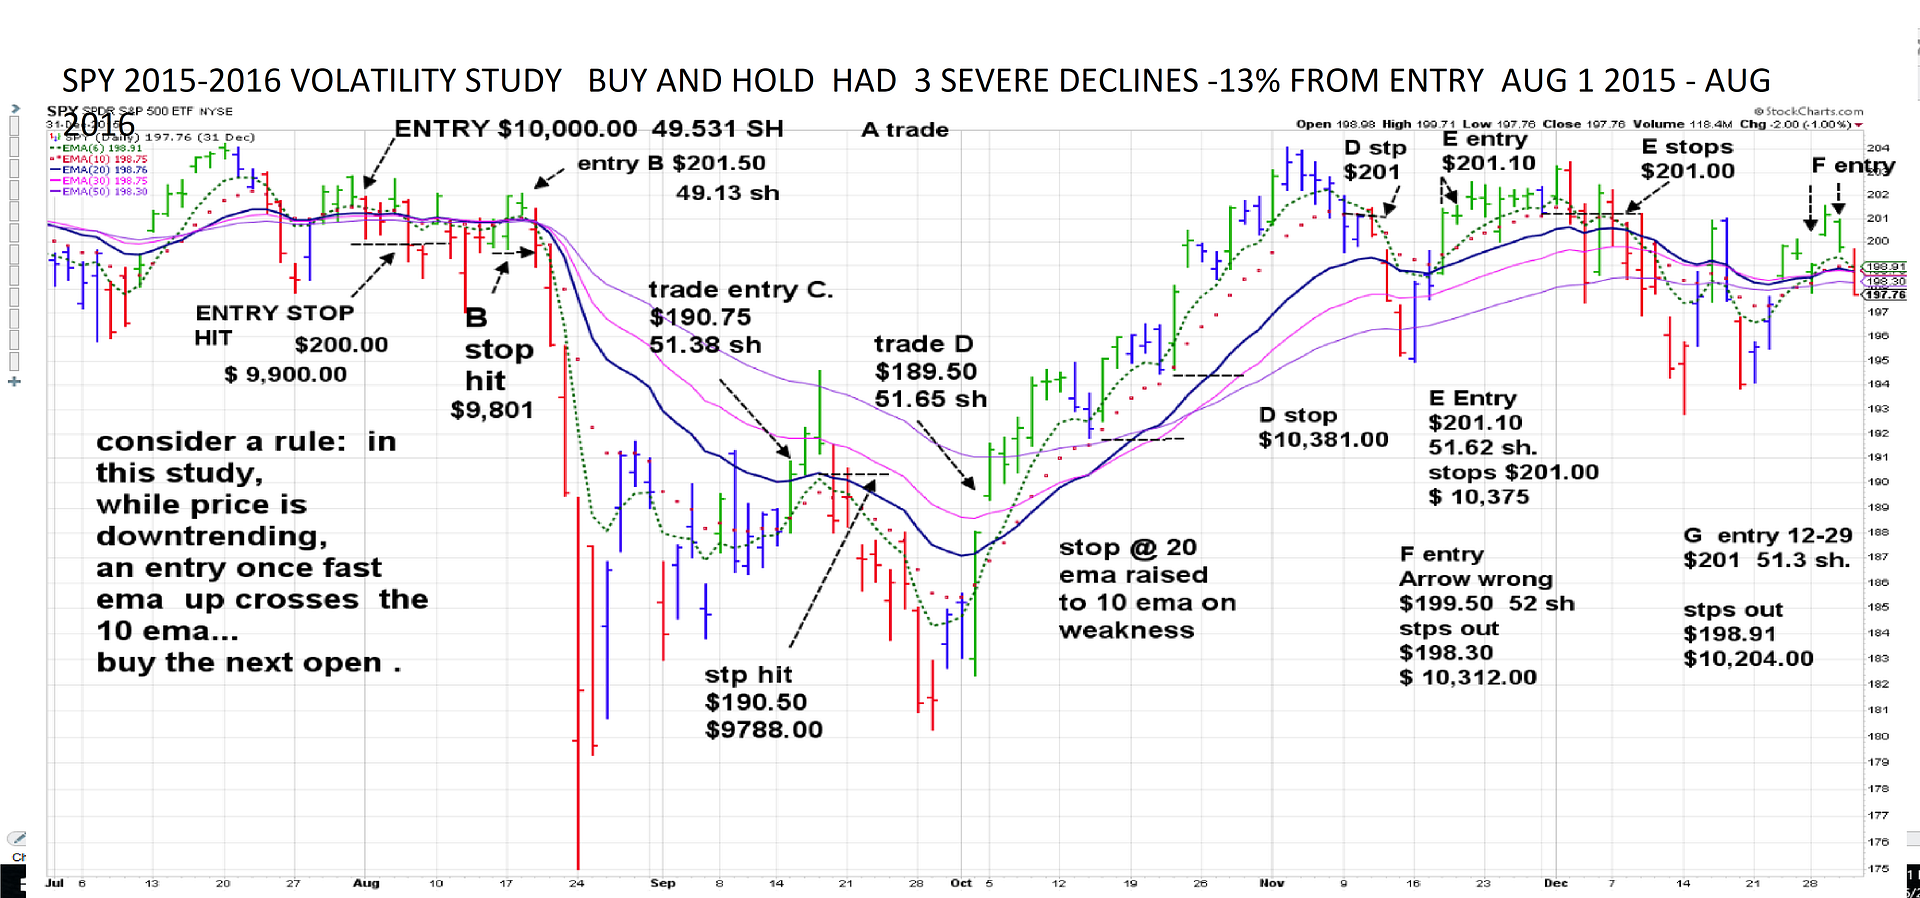
We bought on Aug 1 with $10,000 and promptly stop out, Trade A- I bought in the midst of a flat range as noted by the convergence of the Emas- but i needed a starting date-
We stop out at A at our Entry low since it closed below the signal bar. Trade B pushes higher from a small pullback- 2 green bars - and the close above the emas on the 2nd bar calls for an entry the next day 8-18. stop is put at the 2 green bars low..it stops out the very next day, and then the sell-off begins in Earnest-3 huge red bars take price down 13%! We ignore all the following bars, including a couple of green bars- because we don't have a close above the 20 (perhaps should include a 15 ema ?)
Trade C signal 8-15, entry good 8-16 but is followed with a tall topping tail the next day- Stop is set at the 10 ema- I just caught a mistake- the stop would open lower- $188.50- for a loss of an additional $100.00 or so-
Well, This sucks- 3 losing trades in a row! but guess what- Price again takes a nosedive- and we aren't along for the ride lower!Doswn to $181.00! No Stress!
The signal for Trade D occurs on 10-2- a big bold momentum bar that comes from way lower and closes above the fast Thats 2 weeks later- yes, a couple of blue bars signal an early reversal- but that's not the rules- We enter on the green bar close above the 20 ema with the fast 6 ema uptrending and ready to cross-It was such a large bar that the 6 ema takes 2 days to make the cross- The open gaps higher- but we have a market order to BUY the Open- We pay up a $1.50 above the prior signal bar Close- but that's Momentum!
We are in this move for 26 days! along the way higher, a couple of blue bars penetrate and close below the fast ema- almost to the 10- Waiting to tighten the stop until the bar closes is difficult if watching a price decline- in real time- Profits diminishing- Particularly when 3 days earlier there was a price pull away-well above the fast ema-
But that's a tweak to consider later- Stops should be put at the 10 ema below the penetrating bar after it closes. We stop out nov 9 because of the penetrating bar the prior day at $201- and - we are now up 2% above our entry (deducted the $100 approx on the previous lower stop) different than what's on the chart .
We then follow with trades E,F, G - as price action seems to be trending lower- On the chart i show the G value at $10,204- should be closer to $10,100. -I will carry that value to the next chart- December looks to be in a gradual decline- and the other emas are converging and declining- so the fast 6 ema became the signal
iN THIS CHART, We start seeing entries labeled H, I as 1st reactions from a decline- They both stop out for losses, and price continues the downtrend-
Side notation- This is likely a typical failure in most decines- the 1st reaction fails to reverse the downtrend unless it has a basing period- JMHO-
Notice the 20 ema in this chart is the red dotted line-and - as this chart will show- perhaps reacting to the 10 line will not be as productive as using the 20 ema-
That's the purpose of conducting this 'study'- to gain a greater awareness of what we 'assume' vs what actually is.
The benefit of the approach is that the stops execute for small losses, but what becomes apparent is that the tighter stops generate many more trade executions, followed by
reentries at a higher price- based on hits to the tighter 10 ema- At least during this period. It may well be worth a revisit to this approach using a wider 20 ema to see the results. This is chart 2 - Chart 3 will be coming
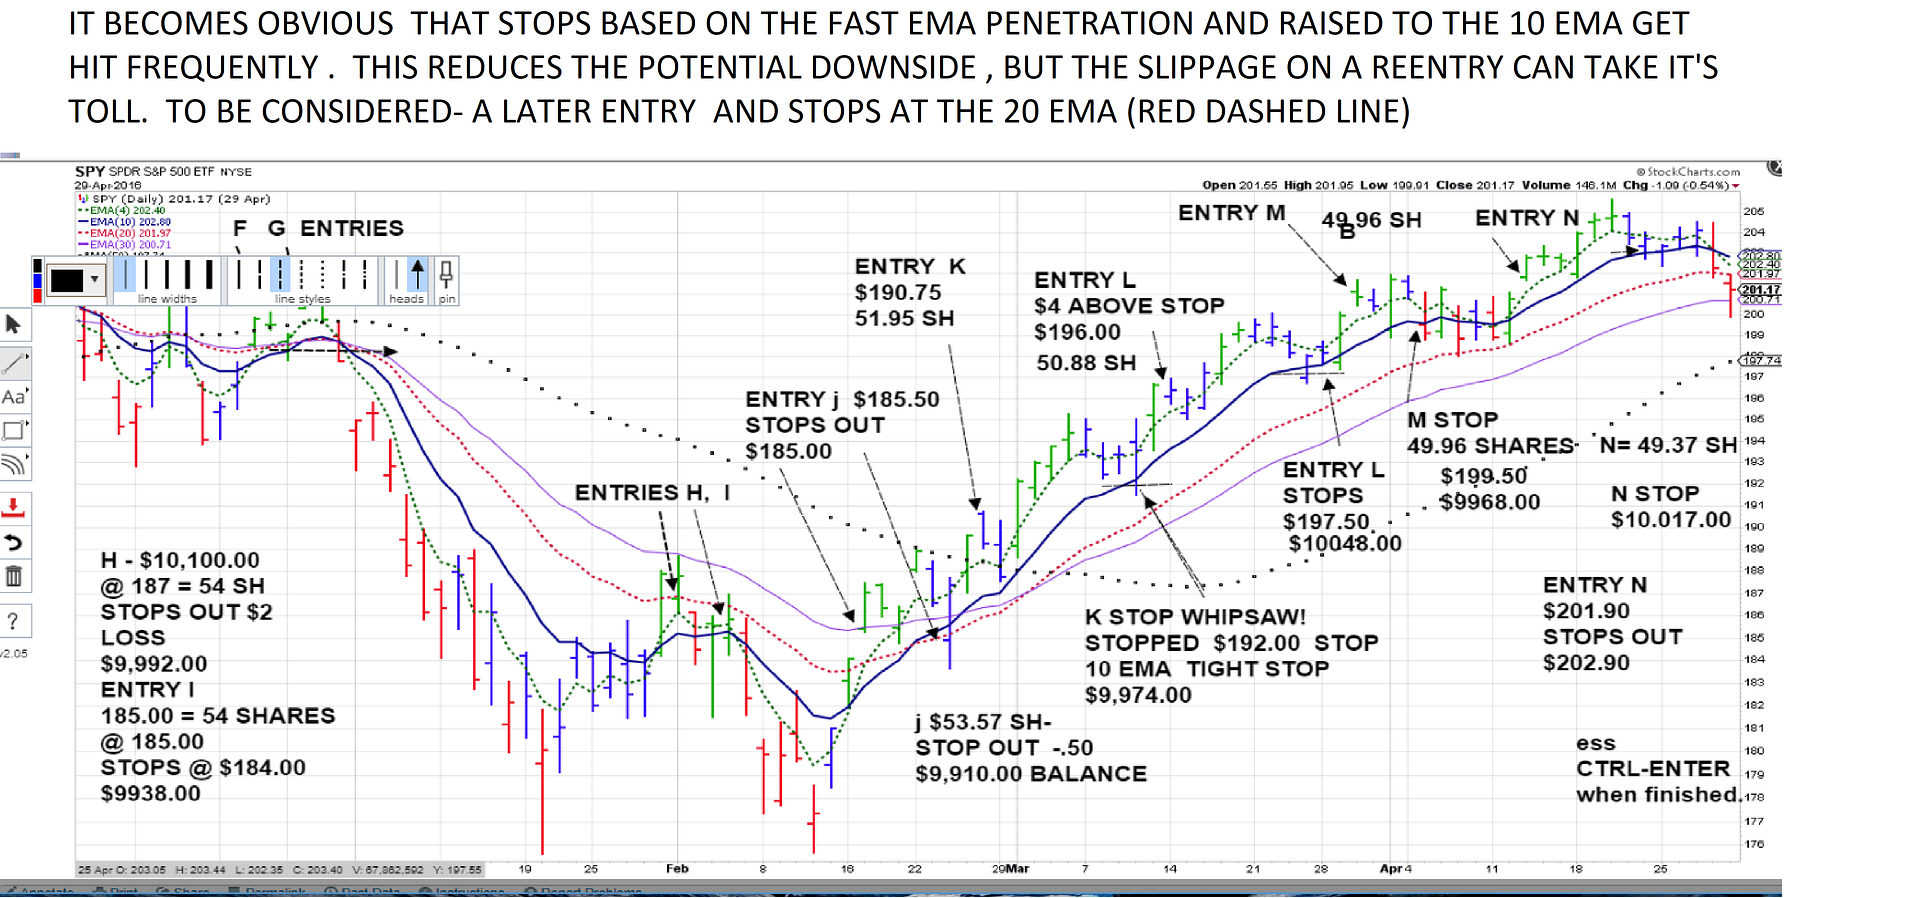
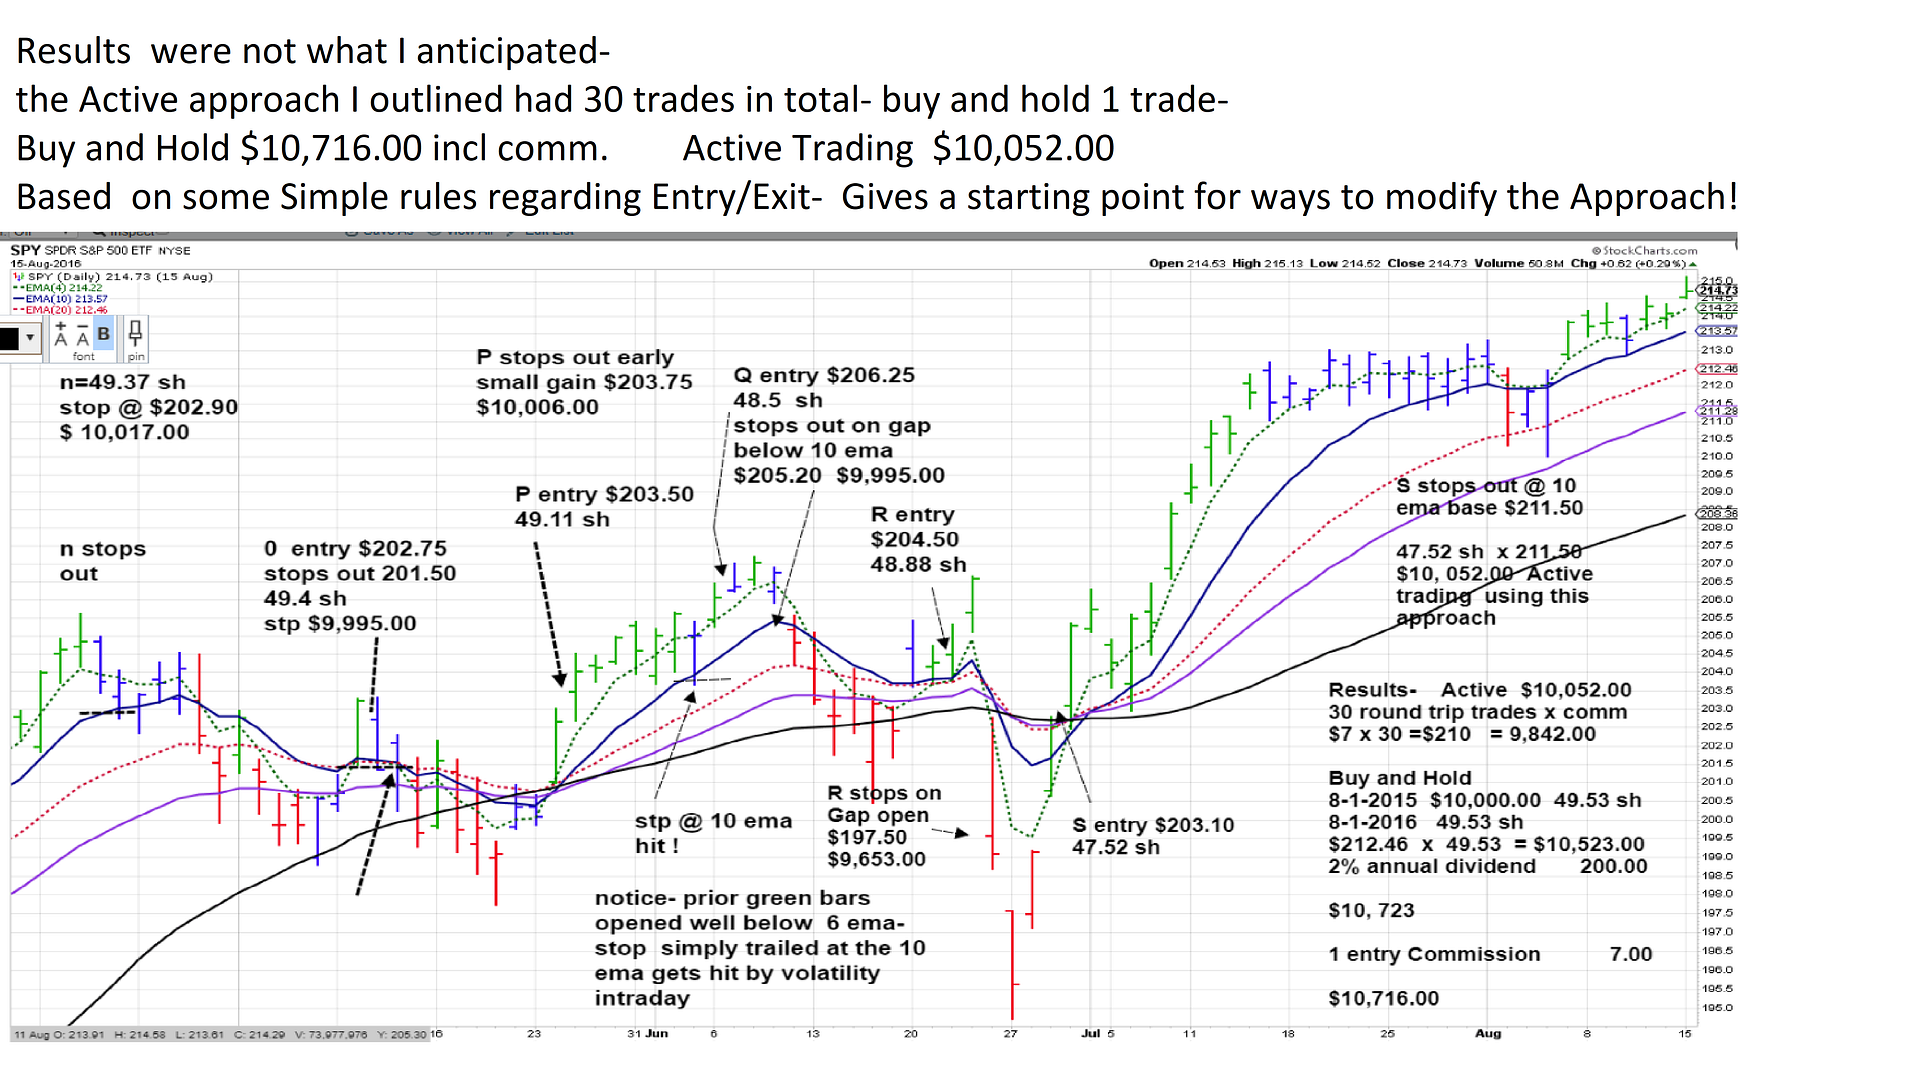
Concluded the April- August look- The Final Results were not what I expected - Prior to doing this exercise, I expected that the very simple approach would outperform over this period- particularly with the 3 larger declines.... Nothing is as simple as it would appear at face value- Intentionally did not try to "Curve Fit" and keep the analysis straight forward...
Buy and Hold $10,716.00 Active Trader- after commissions ($7) $10,052.00 30 total trades -(15 round trip entry,exits)
The simple Active Trading approach I outlined -using the Elder impulse bars with a relatively tight stop on entry, and a tight trailing stop- were the Basic system.
No indicators other than price to moving averages were referenced-...
This does not mean that the Elder impulse colored bars don't perform - Just that the simple method I outlined- did not deliver the expected better results-
This provides the opportunity for Hours of further review, and perhaps including some indicator confirmations, placement of stops -
All should be viewed with Trend & momentum .
Notice that many of the Green signal bars made a larger initial up move , followed by smaller bars- several entries stopped out earlier on minor pullbacks below the fast into the 10 ema- The trades were then reentered at a higher price point following the next signal bar- Eliminating early stops - as long as the trend was still in play-
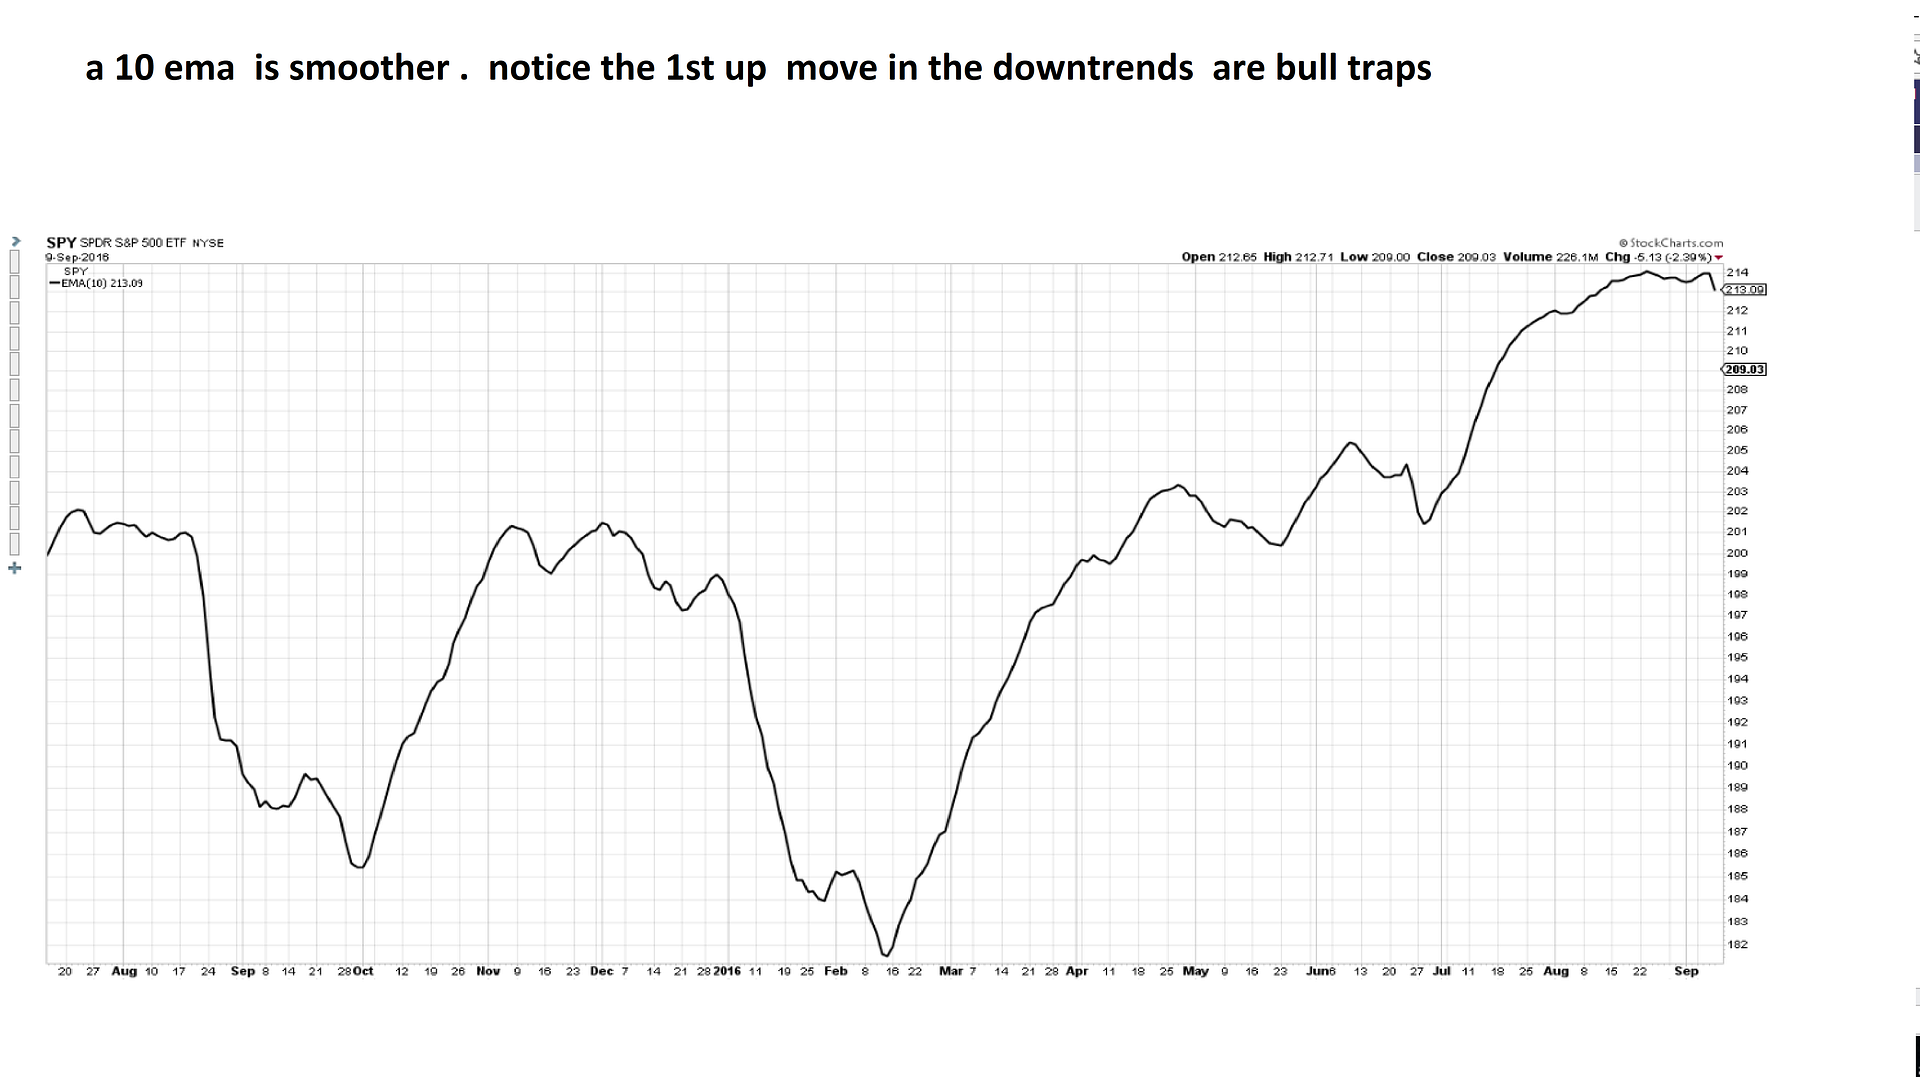
On moving averages- Moving averages are smoothing mechanisms of price- reduces the graphic volatility of a price bar to a smoother line...
One starting point would be to just graph the moving averages alone- without price- and see what that tells....
 |
|
|
|
Post by sd on Aug 17, 2017 18:22:36 GMT -5
|
|
|
|
Post by sd on Aug 18, 2017 9:13:17 GMT -5
WHILE THE INITIAL STUDY of the Elder Impulse Bars did not conform to Elder's intent of the approach- See Stockcharts Chart school articles :
stockcharts.com/school/doku.php?st=elder+impulse&id=chart_school:chart_analysis:elder_impulse_system
stockcharts.com/articles/charthingychers/2012/01/digging-deeper-into-elders-impulse-system.html?st=elder+impulse
The goal was to study/ backtest a premise of an approach- Elder's application is for longer term signals .
What was noticed in my initial look, was the entry after a green bar often came with a larger up move, and the following moves were often smaller-
Is there another way to consider getting in the day before the green bar forms on the up move-
Also- what's an appropriate exit during an early entry when the slope of the ema is down, and similarly- what works during periods when slope has turned up?
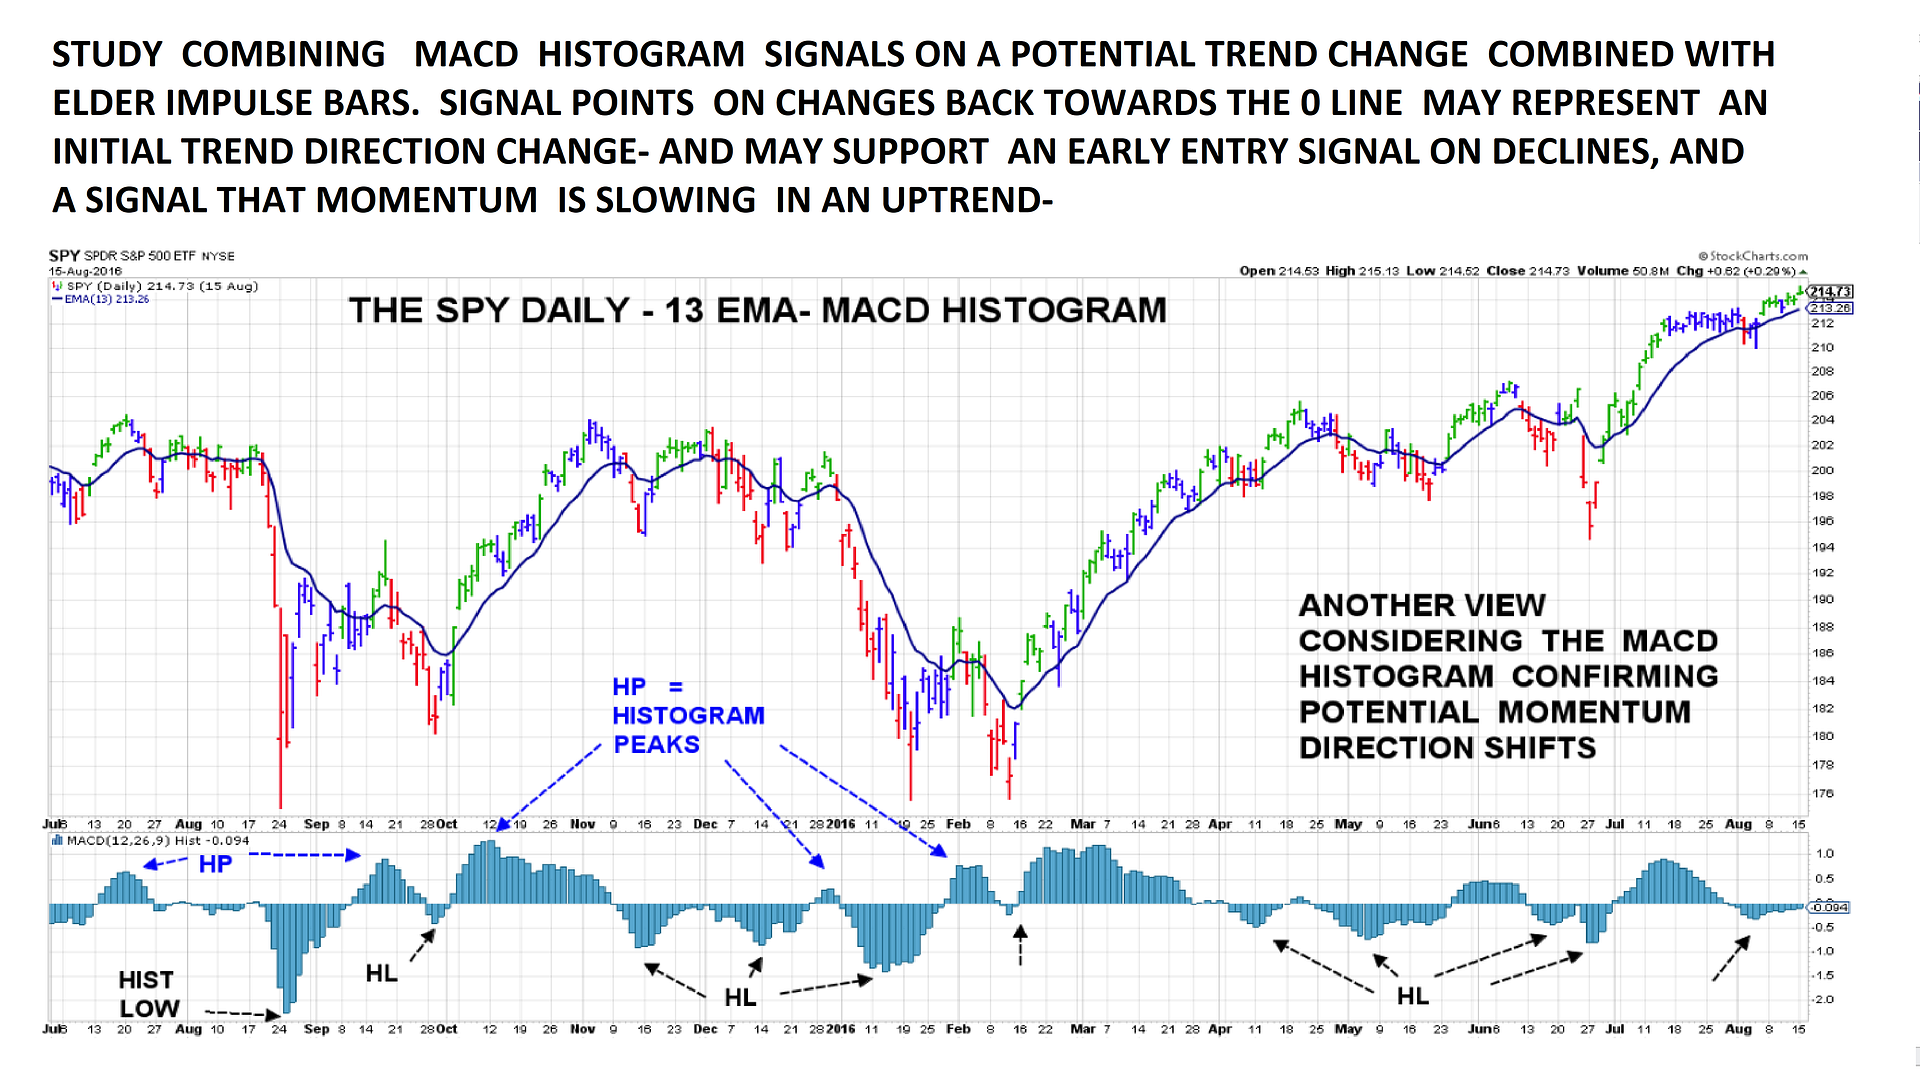
When the histogram is clustered around the 0 base line- slightly above or below, the moving 12-26 averages are likely in convergence- and non-trending- signals in non-trending periods are not to be taken in the same light as signals in directional periods.
Peaks away from the 0 line- the next block that steps back closer to the 0 line often indicates a turn in the momentum- so the look at this as a potential early signal- both at price tops and bottoms, and in the context of the trend slope- will be looked at.
The Elder impulse colored bars will also be part of this study.
 |
|
|
|
Post by sd on Aug 22, 2017 9:29:33 GMT -5
Took some losses over the past weeks-Being more defensive- looking to add to the Global market exposure- previously holding Teck, Vale, Vedl, HDB, PIN, Adding to mining positions to offset- with intl exposure- Buying LIT, COPX, note that DBB up strong this year on the global economy-
Note that saw on CNBC- Global miners -PICK_ certainly outperforming..Not a position. just noting-
Took a substantial loss of approx -7% in tqqq, the position being exposed to tech with overweight leverage in the TQQQ- That had also contributed to my performance earlier this year-
As part of a defensive move to lessen US centric exposure- shifting the weighting to global trends because of the growth & potentially better valuation - and the momentum...
|
|
|
|
Post by sd on Aug 23, 2017 7:11:02 GMT -5
Interesting article in SA on the Pacer Trend Pilot ETF approach using 50/200 moving averages to time the market entry/exit-likely also with additional criteria....
This is also a popular "exit " signal for many Technical analysts/chartists as it ideally may capture the larger moves in a potential decline-
The question becomes one of when do you reenter- because price always leads ; the moving average lags price- so waiting ffor the 50 to upcross the 200 will find price above the crossover point.
seekingalpha.com/article/4101053-index-investing-lazy-short-time?app=1&uprof=44&isDirectRoadblock=false
www.paceretfs.com/products/trendpilot
www.paceretfs.com/library/videos/
In the preceding Elder Impulse segment based on bar color as the primary entry/exit, the results ended up underperforming Buy and Hold during a choppy market period of fairly substantial pullbacks- That was perhaps an overly simplistic approach- but it does serve to illustrate that the color bar criteria for entry and exit that I intentionally outlined did not capture enough "Alpha" to be the primary signal for entry/exit.
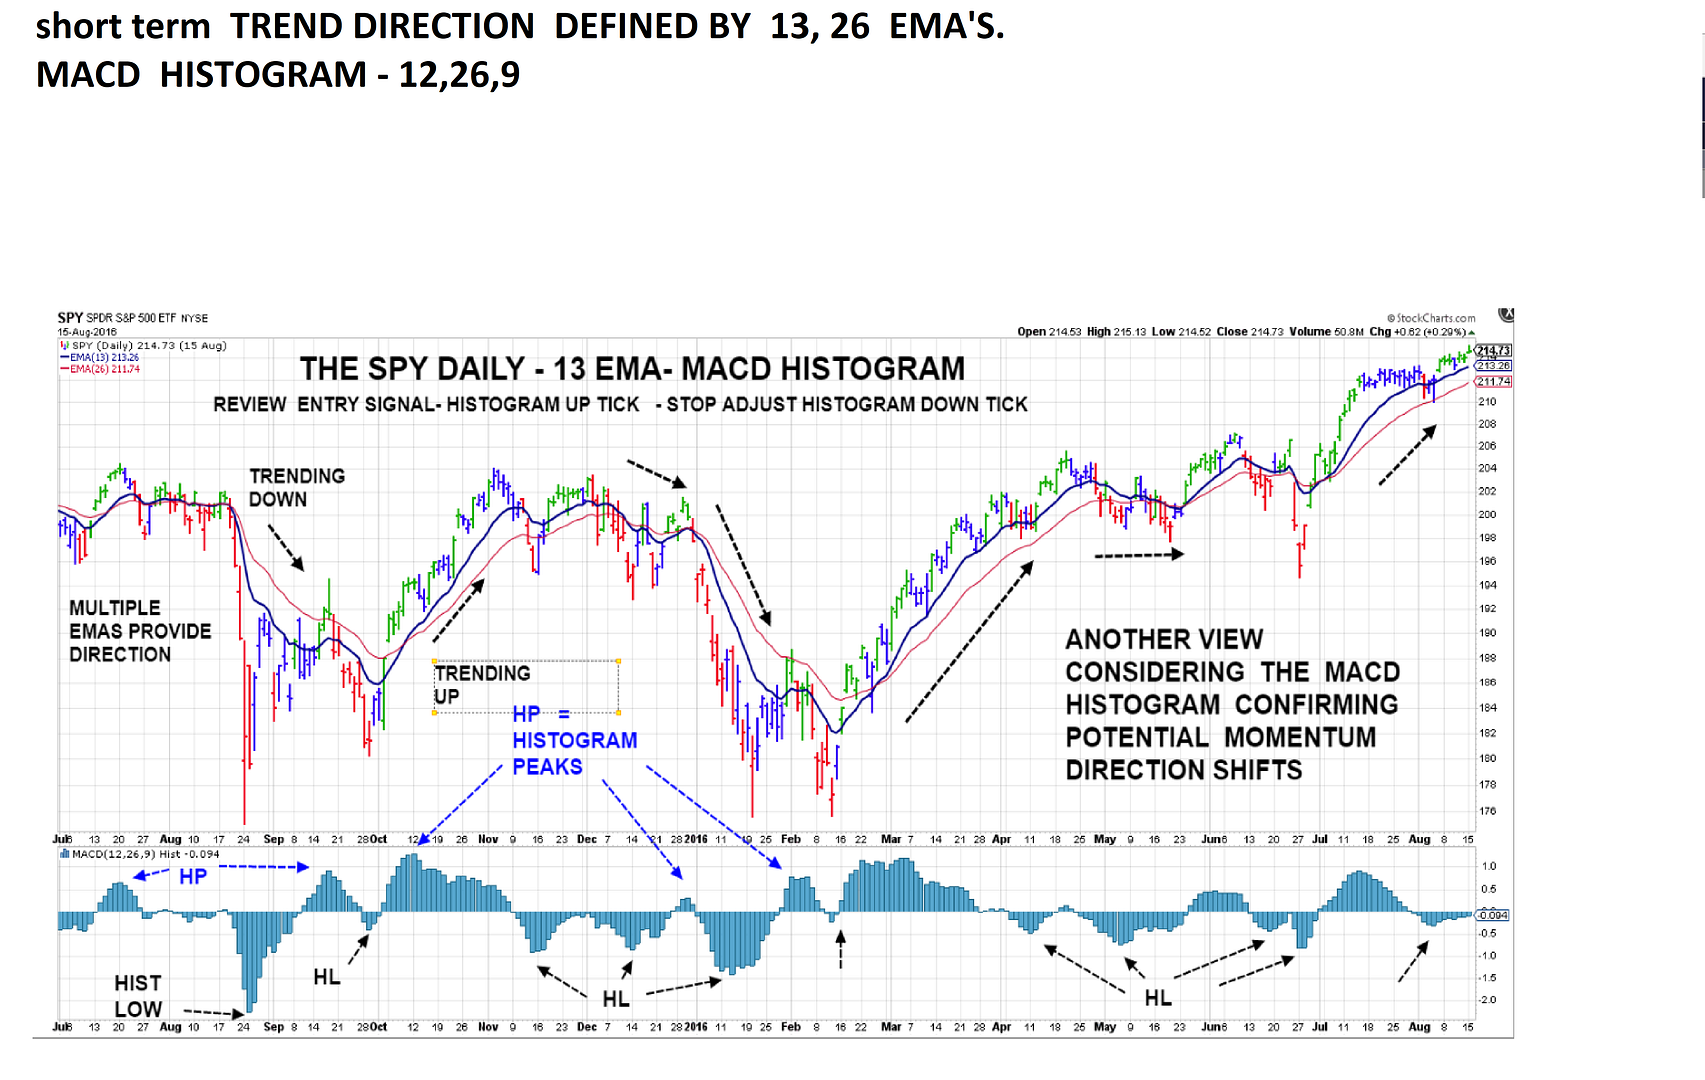
Another way to consider better entries, exits, and perhaps flat periods would be to start with adding an indicator - to get potentially useful signals of the strength of the price move, and perhaps a change in the momentum not readily detected by price bar action. The Histogram is a graphic based on the MACD -Moving Average Convergence,Divergence
stockcharts.com/school/doku.php?st=macd&id=chart_school:technical_indicators:macd-histogram
The histogram bars will turn in advance of the 0 line cross by the actual MA lines, and can perhaps be viewed as an early indicator - As with all things in TA- the indicator is simply responding to changes- and is not always to be taken literally- For example- a downtick back towards the 0 base line does not always indicate an immediate price trend change- See divergence- but it's worth a look - and further study .
In the goal of adding to the Elder Impulse color bar 'study' the goal would perhaps be to be in the position when the 1st green bar occurs-meaning an entry on a Blue bar.
The initial chart is attached, but a closer look will be later as Time permits.
EDIT 8.26
Reacting to individual Daily price bars or candlesticks can be timely- in swing trading -a Climax shooting star top - or long tailed doji/hammer at a bottom - often will give early tradable signals that a trend may be about to change direction- Similarly, the same can be seen in weekly bars and candlesticks- but the weekly signals perhaps carry more weight and significance since they are comprised of the input of 5 daily bars- This will also Lag the daily individual signal.....
In the daily chart above, price made substantial reaction moves from oversold, then pulled back and went back lower- This is not uncommon in watching a stock that is in a sharp decline- the 1st reaction move often seems to be followed by a move lower- and a 2nd reaction - particularly when it bases- has a greater like-li-hood of succeeding in a reversal move. Just my
biased opinion....
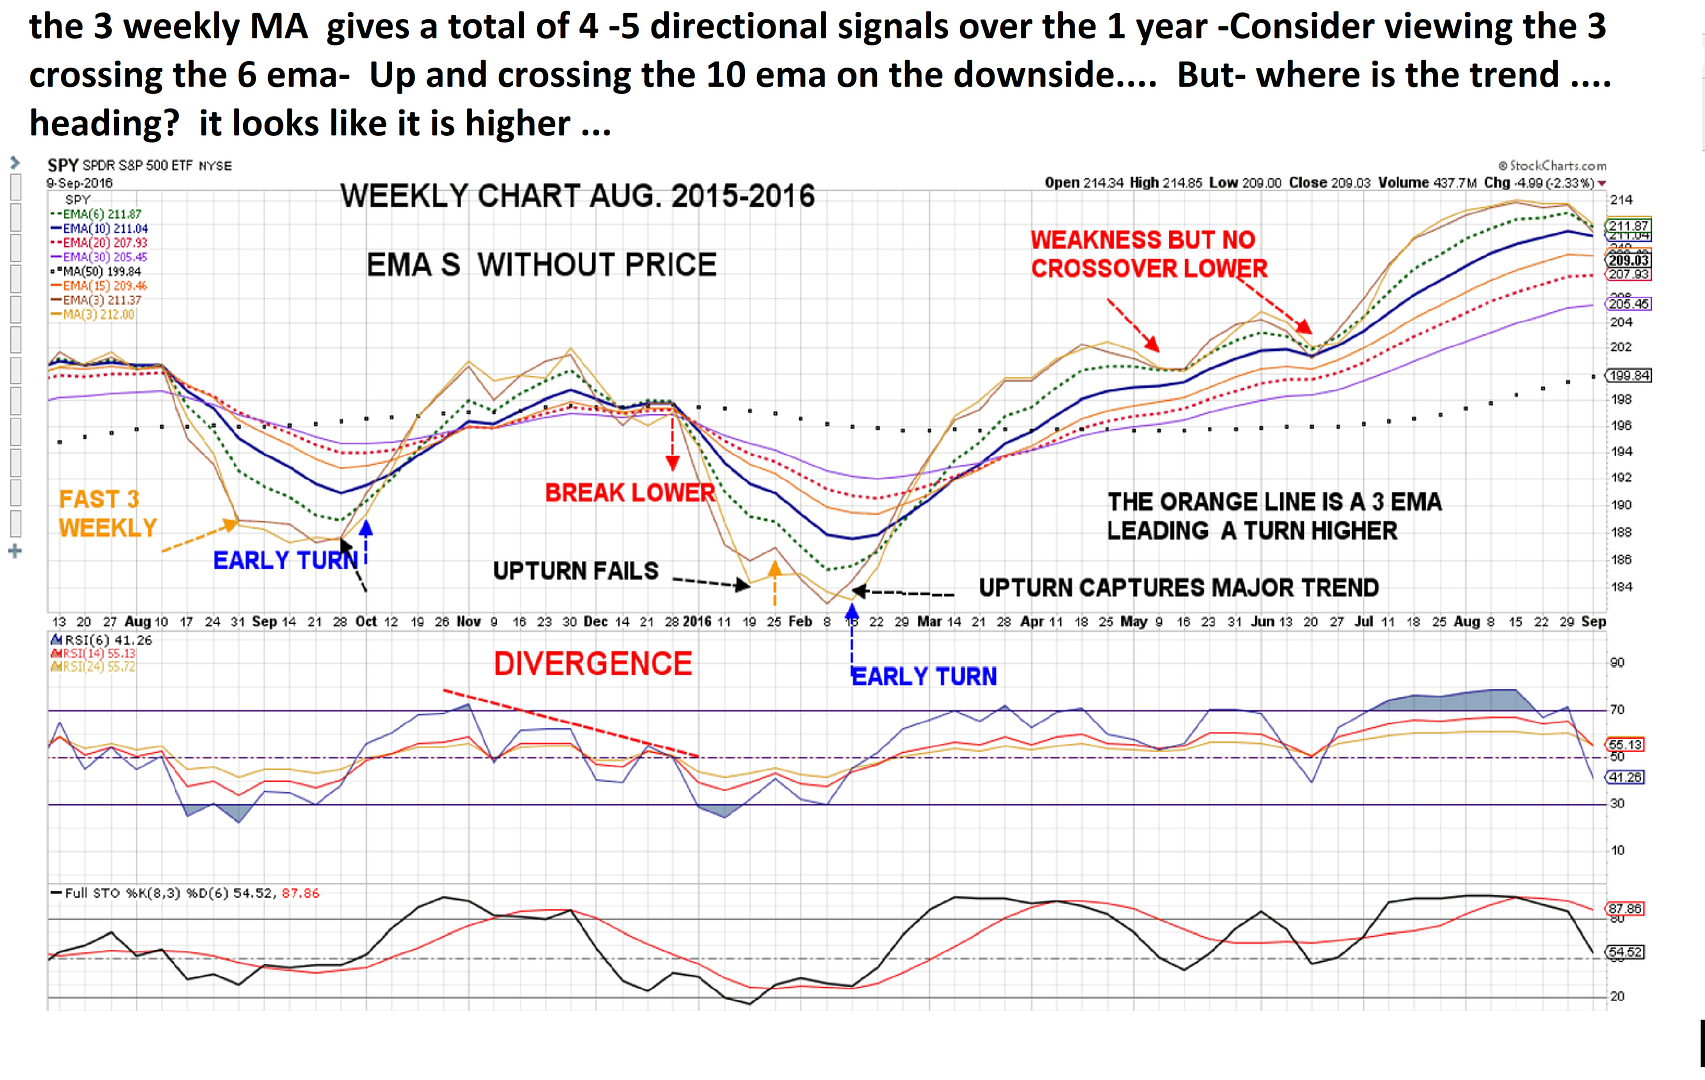
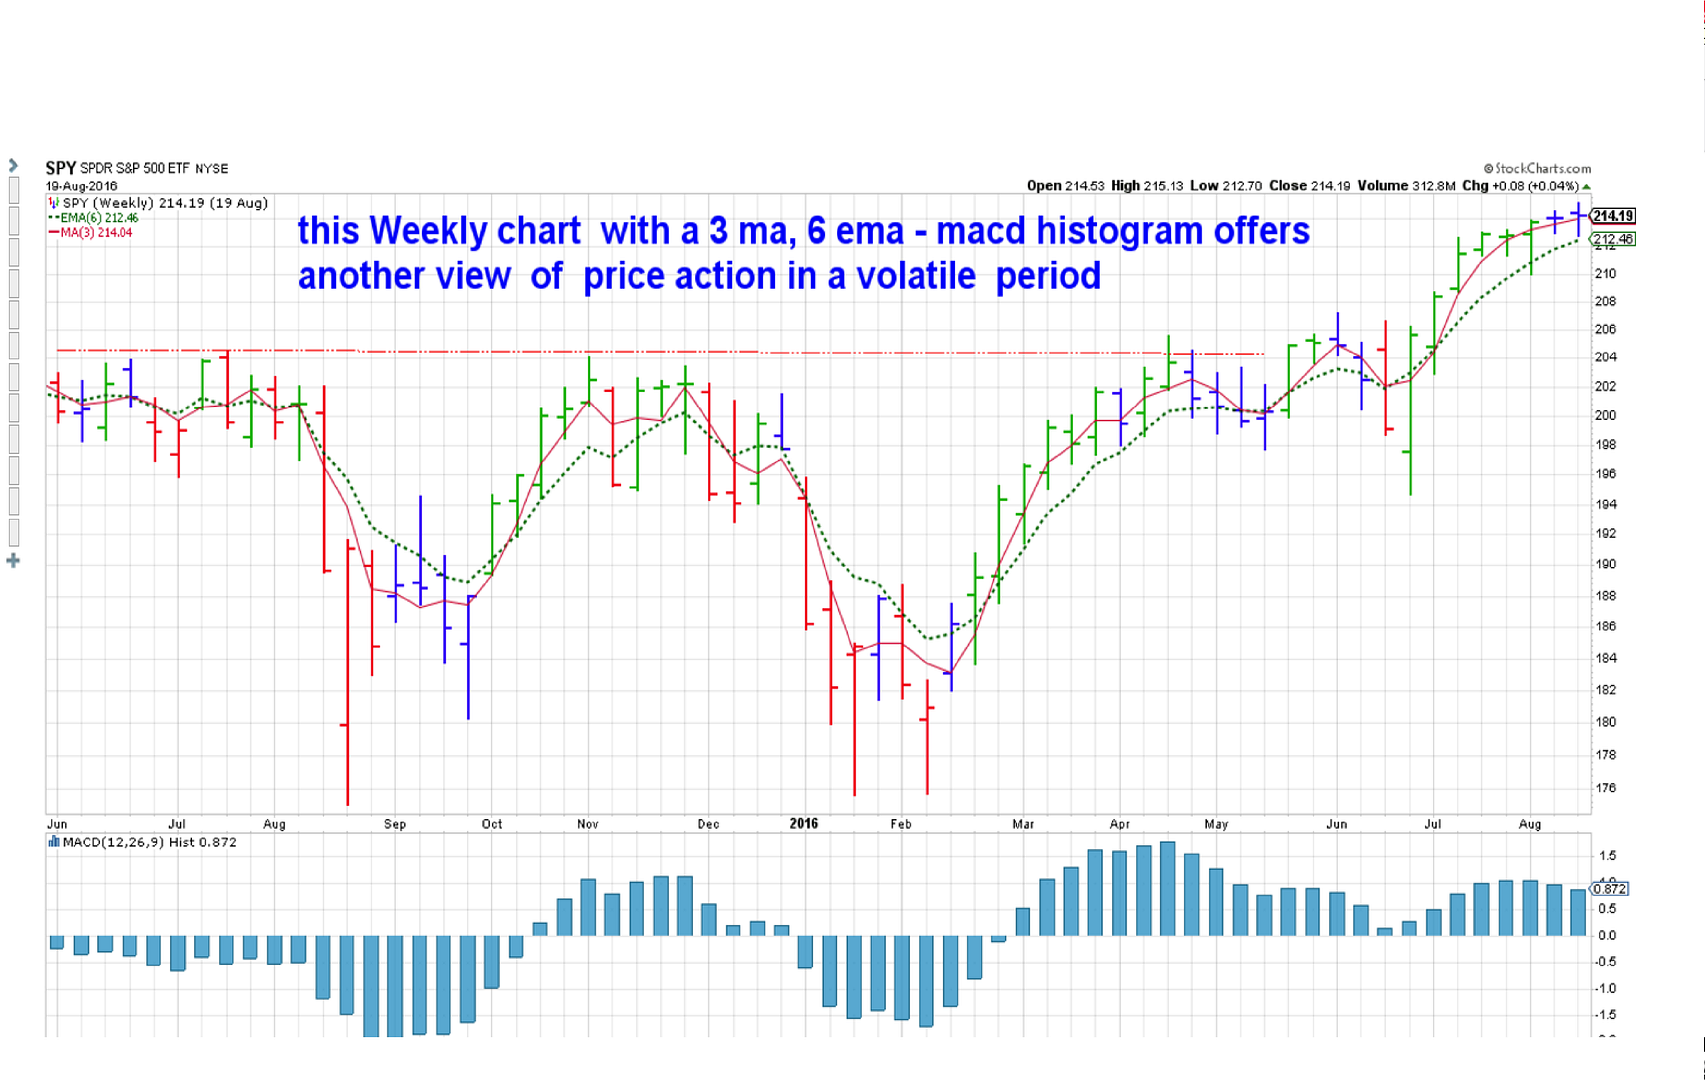
As i was reviewing the Daily chart/histogram , i also looked at the Weekly chart and added in a couple of faster moving averages- including a 3 MA and a 3 ema-
The 1st thing i noticed was the entry and exit signals- If based around the fast EMA movements had relatively few signals-
The upturning 3 crossing the upturning 6 in a downtrend as a fast signal confirmation/entry ; and perhaps the declining 3 ema once above crossing below the slower and lower 10, 20 , or 30 ema- provide only a relatively few signals to act upon- This reduces trades, commissions, and small whipsaws - and may prove to be more trader friendly in defining actionable trends because the daily fluctuations have finally resolved into a larger direction-
A 1st comparisom of the Weekly chart upturn of the 3 ma & ema- across the 6 ema- did not get the earlier entry suggested by the Daily charts-and better defines the trend direction-
Also worth noticing- is that while the 3 ma had several periods of decline in 2016 - it did not break below the 20 ema at all. Price would have been well below the declining 3 ema - so the question becomes- How much price volatility can one Stomach?....
8.29 edit:
Chart is a weekly with just a 3 MA and a 6 ema- The goal is to apply a uniform entry and exit . What Does the MACD histogram suggest? Is it an asset to the entry/exit decision?
|
|
|
|
Post by sd on Aug 30, 2017 19:20:58 GMT -5
8.30.17 note- ...I stopped out last week on UUP @ $24...small bet on the US Dollar... but beyond that, All positions have held up despite Korea sending a missle over Japan; Despite Harvey, and - I don't feel compelled to scrutinize each position daily to see what it's daily fluctuation was that day.... yes, there's some ups and downs that can look large on the daily.... but ...What is the BIG Picture? Where is the Trend heading?
So much of what defines us , is our perspective- and perhaps we are easily influenced by the news sensationalists, the Daily inputs that we feel we should react to....
If Korea drops a missle on japan- or South Korea- all bets are off- The markets drop 25% in 3 days as nuclear destruction is the new focus-
And- if there ever is nuclear war- What is the value of any IRA account- or Trading account/ Or what if the Asteroid is discovered heading towards Earth?
Markets react 5% on Tweets - go figure- perhaps this will become the new Normal......
As I step back and consider what i have reacted to in many of my past trades- news of the Day-or The Week-and those notable moments where i felt that the markets would crumble,the budget would fail- and gold would regain that favored status.... that stirred up the volatility- most of those items failed to hold a long term impact. The Debt ceiling was passed- The US didn't default and fail to send out social security checks on time.... And Gold sold off, and off, and off.......Even with seasonality favoring a correction, here we see the markets attempting to ind footing and move higher- Perhaps tomorrow will turn out to be just like yesterday's boogeyman- we sell-off 5-10% and then the market has a base and we continue to move through the cycle....
The question i have to Ask myself- is what part of a pullback is not worth reacting to?
A good investor or trader buys at the pullback- My inclination is to be a seller at that point- I'm likely average in that regard.... However, in the past weeks, I have let price settle out -except UUP- broke a structural low., and i added to the IBB position today on the higher move +324.00. Higher in the miners as well.
Somewhat new territory for me.....Fully LONG in spite of the Fear that Seasonality suggests I should go to cash and be defensive....Perhaps even go bearish?
Short the market? IF we listen to enough talking heads, that is likely the CONSENSUS "advice' DIRECTION.....
|
|
|
|
Post by sd on Aug 31, 2017 19:14:01 GMT -5
8.31 NOTE- All of the indexes closed up higher, with tech up almost 1%. Biotech made a very nice upmove as well, testing the recent high.
i think the note to myself here is that i was not shook out last week because i didn't have a tight stop-loss in place. If i had been shook out - perhaps i would have simply ducked lower-expecting a larger decline.... Instead , I find myself considering putting some investment cash to work in a Vanguard Account- Where is the correction? Of course, i am fully aware that the correction will occur in the 10 days following my initiating the Investment account! Well, September is still looming, and there is the budget reconciliation to wreak havoc on the markets- if some political/ Intl event doesn't intrude 1st! perhaps we'll send in a Drone to dispatch Kim- or drop a MOAB on the next rocket launch-
But, these type of extraneous events have entered into our consciousness and markets almost every year- and have had a short term impact- and yet the markets have managed to recover- Each year we expect it to be different- and one day it will- perhaps tomorrow- perhaps in 1-2-3 years....
There will always be different events- Harvey for example- unforeseen that appear to be a disaster- that can also be viewed as opportunistic for some areas of the market- Crass as that may seem- and i certainly don't want to sound uncaring- We have Family that has been flooded out and suffering some hardships in the Houston, La Porte area- But, it becomes a perfect example of
understanding short term trends- Refineries down, Gas prices will go higher- Home Depot and USG will sell insulation and drywall- for months and months at an increased margin...because of supply and demand...We all can relate to that- But what about trends outside our backyard?
The same holds true of sector trends that may be larger- The global economy appears to be accellerating outside of the US....
Global reits up 18%, YTD.... Lots of economies with lower valuations and improved GDP .....
What about the big themes that will play out and drive the future?
AI, Biotech, Healthcare, Technology, Social ? ; all of these could be market leaders but will need to be backed by the system we have in place- so what are the big sector plays?
Does AMZN rule the retail markets in 2020? What will the S&P 500 consist of in 5 years- or 10? Will Cloud computing , Augmented reality, Artificial Intelligence be drivers in 5 years? Or will they become the Walmarts of technology? Alvin Tofffler- here we come.
|
|


