|
|
SD-2014
Jan 1, 2014 20:02:34 GMT -5
Post by sd on Jan 1, 2014 20:02:34 GMT -5
While my funds that were 'invested" gained this year- those gains were reduced by my attempts to move in and out of the market and "time" the expected pullbacks- I still am holding a 25% cash position in that account-having expected a market pullback to take advantage of reduced prices.LOL!
My trading account ended up flat for the year- largely do to losses i took on bets that a trend reversal was about to occur- and I had several trades with large stop losses as I jumped into leveraged inverse ETF's-I looked over many of my trades in 2013 this past week- and while hindsight is 20-20, one has to recognize what is one's achille's heel- for me- that is trading my Bias- .and failing to get back in on resumption of the prevailing trend-
Some ways in which I will try to position myself for better results in 2014,
is that I will take& focus on fewer positions, (Bankedout's suggestion) but will also be willing to take larger position size. The only way to justify the increased RISK imo- will be to take more tactical entries and be ready to bail on weakness. I will try to keep my losses much narrower, yet allow winning trades the opportunity to become longer term positions- at least with a portion- I'm trying this approach with split stops in PJP.
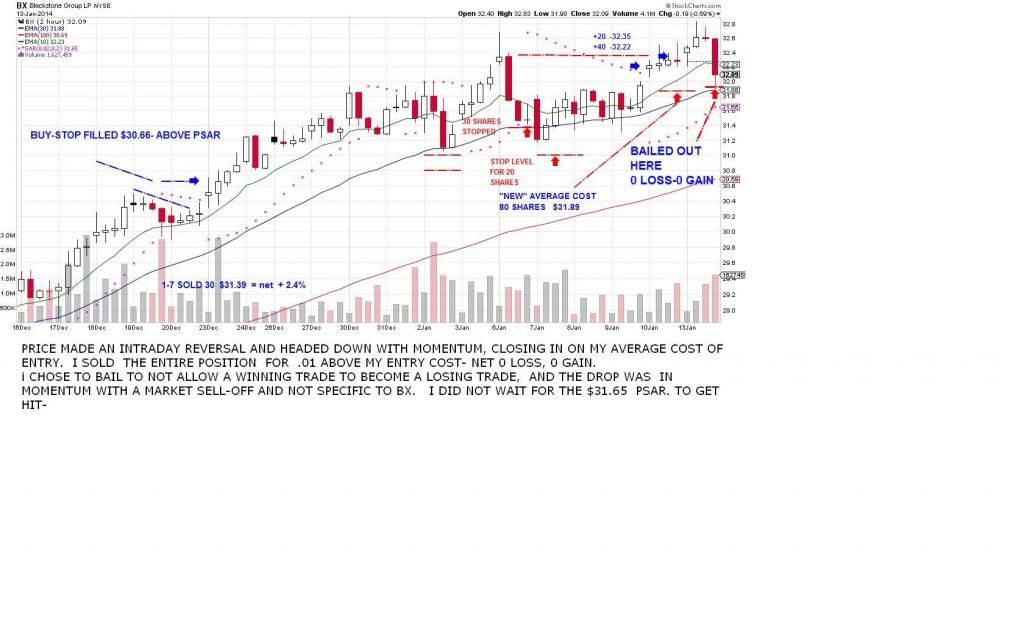
I am also "balancing" my trading positions- I have BX as the momentum trade, am considerably overweight PJP, and trying to control that RISK through tight stops- SDIV as having some tradable volatility swings- and I bought a few shares of AAPL- based on the China Mobile news- but will set a stop below the recent swing low on the daily and not look back if executed.
And just for the hell of it, i bought 2 shares of TWTR- with no intention to sell or set stops- see where this is in 1 year....
In Scottrade- I had opened an account a few years ago but had not executed any trades. I decided i would take an all or none approach and purchased DTN with the account. My initial goal includes developing a large portion of this dividend focused ETF into a long term core position, but also trying to get some gain on pullbacks and improved reentries- as long as the trend is intact.
Let's see if the market continues to churn out gains in 2014!
|
|
|
|
SD-2014
Jan 1, 2014 20:09:03 GMT -5
Post by sd on Jan 1, 2014 20:09:03 GMT -5
I took several entries in Nov-and took small profits on loss of momentum. I since took 3 added entries as price turned back up- The very 1st entry was a spot-on buy-stop, as was the second- The 3rd entry to go overweight was on the movements momentum . Since i am overweight, and price has paused, consolidating, I am raising the stops to protect the entry costs- If price moves higher, I will give this trade more room. 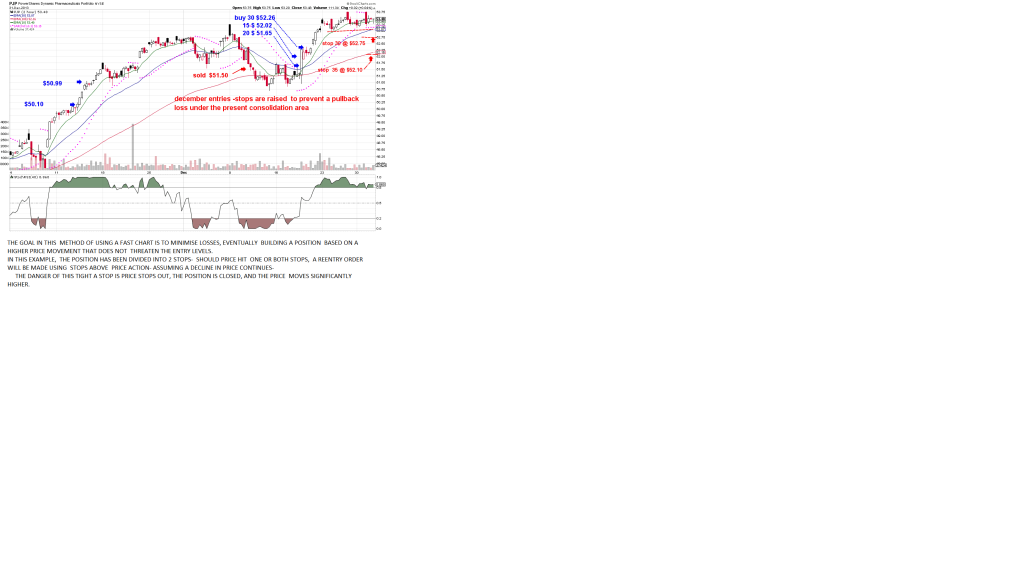 |
|
|
|
SD-2014
Jan 2, 2014 20:55:58 GMT -5
Post by sd on Jan 2, 2014 20:55:58 GMT -5
The market dropped some today- Perhaps tax loss selling - or just locking in gains-
I was down on everything but my 2 twtr shares LOL!
MY SDIV position stopped out- but only partially- I thought i had adjusted the entire position for a stop-
I've raised stops in the remaining positions with split levels in PJP, and BX-
With DTN , I raised a stop-limit for the entire position as the pullback is not at my entry- I'm using a stop with limit on this trade-all 73 shares.
as it has small liquidity, and had a mini flash drop recently-
Had it given a more gradual pullback signal, I would have raised 1/2 the position tight, and the remainder to protect the entry.
The idea of taking partial profits on pullbacks is that the pullbacks will have enough substance that the 3 day clearing will allow a repurchase - ideally for less-.
|
|
|
|
SD-2014
Jan 3, 2014 17:52:08 GMT -5
Post by sd on Jan 3, 2014 17:52:08 GMT -5
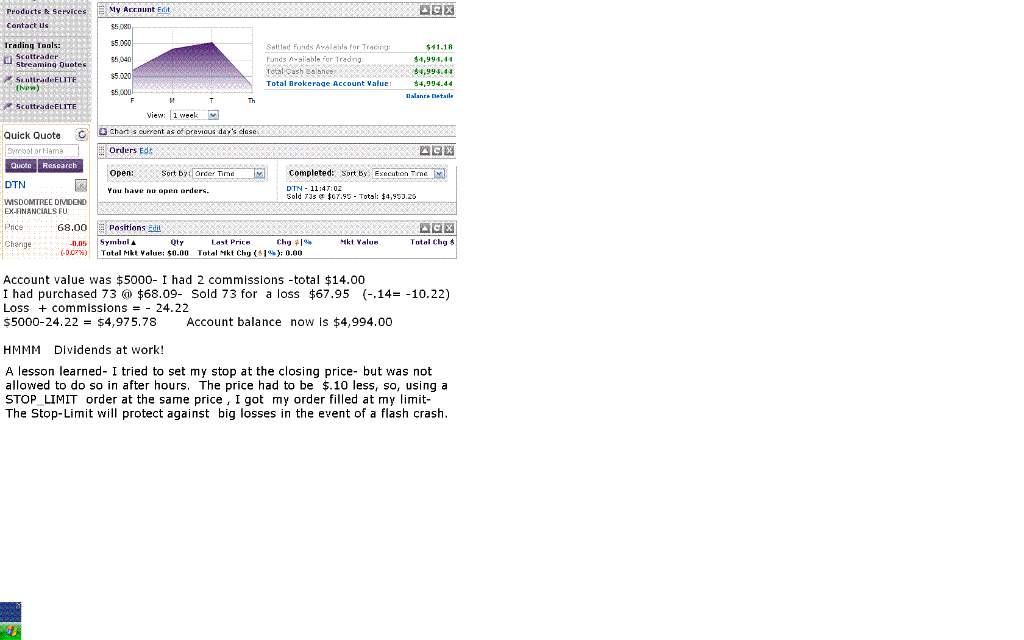
The DTN trade closed today as I raised a stop on perceived weakness- The trade was entered on Dec 23 in a separate Scottrade account- The entry was a belated point that coincided with the decision to do something with those $$$.
DTN was/is my selection to trade/ develop a long term position, with the idea of perhaps this becoming a core position and possibly a longer term hold eventually-
However, I did not want to allow this trade to start off by dropping back in the Red after proceeding in the right direction.
As price pulled back and closed near my entry, I tried to set a stop-limit with the closing price my stop- The Scottrade system would not allow that, requiring a $.10 space between price and the order-even though the market was closed. With IB I can set a stop above the closing price.
Despite commissions of $14, and a loss of $10 on the trade,
I am only down $6 - Must be from the dividends over 1 week-
My intent is to use the fast chart to try to get a better lower entry and more positions- and to use this account on this one
position as my focus.
|
|
|
|
SD-2014
Jan 3, 2014 18:37:39 GMT -5
Post by sd on Jan 3, 2014 18:37:39 GMT -5
DTN CHART ATTACHED- Had i been watching DTN prior to my entry day, I would have placed a buy-stop above the large bullish candle that had dropped below the range low and closed at the top. Woulda, Coulda, Shoulda. This pullback may offer the opportunity to get back into the trade at a lower cost, possibly additional shares as I intend to allocate this trade up to $5,000 . the DTN trade did not match the S&P- as it is comprised of Dividend paying positions- It moved only from $55 to $68 in the last year - a gain of 23% in the share price- However, I do not think this reflects the reinvestments of the dividends- ? If the dividends returned 3-4%- the annual return would be potentially higher- and if the dividends had been reinvested- potentially higher yet. This ETF represents an attempt on my part to use shorter term trading techniques and to eventually allow them to become a longer term position- ideally eventually having core positions and trading partial position shares. However, to get past that first position entry, price has to trend higher and put in a higher swing low to define the uptrend as continuing. 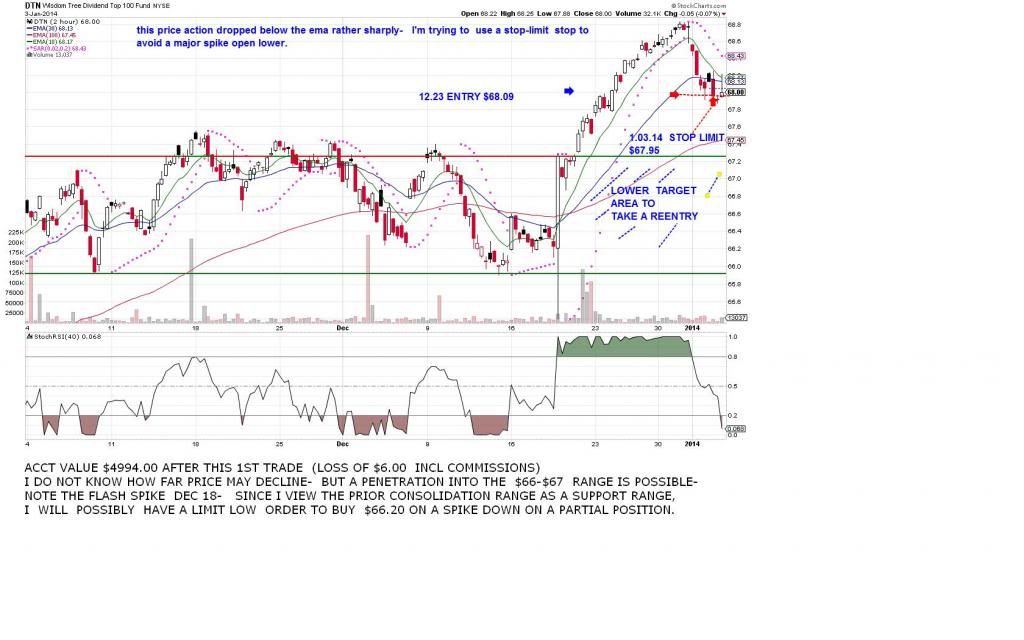 |
|
|
|
SD-2014
Jan 9, 2014 20:26:56 GMT -5
Post by sd on Jan 9, 2014 20:26:56 GMT -5
Can an EOD trader successfully apply short term charts to gain entries into longer term positions, using reduced Risk and higher stops? By using a faster time frame chart, one can get a closer look at price action- When one gets to looking closer, small moves may look bullish and look like it's time to just jump in- Keep in mind, when looking 'back' at what has already happened- every bar that is now red that opened higher than the prior bar, looked bullish in real time as it had opened higher initially. That bullish start to the day gave way to weakness, and likely a continuation of a lower low than the prior bar- The "danger " in a fast chart is that multiple buy and sell signals could perhaps be viewed out of context and taken literally on a bar by bar chart- A wider perspective is an advantage. Relatively minor fluctuations can loom large on a fast chart- but be blips on a daily chart- My goal, is to take a desired initial trade, take an entry position, gradually add to that position, and to allow that trade to become a longer term position- "Handing off " the stops on that trade to a larger time frame view. The following chart includes the elements that one can find on any time frame- Price turns down and begins to downtrend- This is clearly indicated because price is lower and below the declining fast ema- Note that in the downtrend, there are moments where price opens higher and starts off as a bullish candle , but turns RED as price fails to sustain an upturn, and loses momentum and closes lower- resulting in a red bar for the time frame- If one was trading in real time and an itchy trigger finger- each upside move looked buyable as a R.O.T. BUT was premature- As a curiosity, notice the declining psar value- those dots above the downtrend- This indicator very often 'nails' the actual reversal of the downtrend- and the market highs. Does not do well in sideways consolidations though. While not a big fan of indicators, In a search of developing a more systematic way to view the markets, some indicator values came to consideration- The MACD histogram- indicators lag price- but also smooth the individual bar movements into a more general averaged perspective- MACD can show divergences in price action- What I appreciate aboiut the MACD is the actual histogram- once it has peaked, it is perhaps a signal that the negative momentum is decreasing. The Stoch/RSI gives levels of an oversold condition- The declining PSAR often gives a buy-stop level above which price needs to close. In the attached chart, the 1st ROT trade fails and drops back- but the second move succeeds- The 1st ROT often fails- a buy above that 1st initial ROT close may improve the trade results. 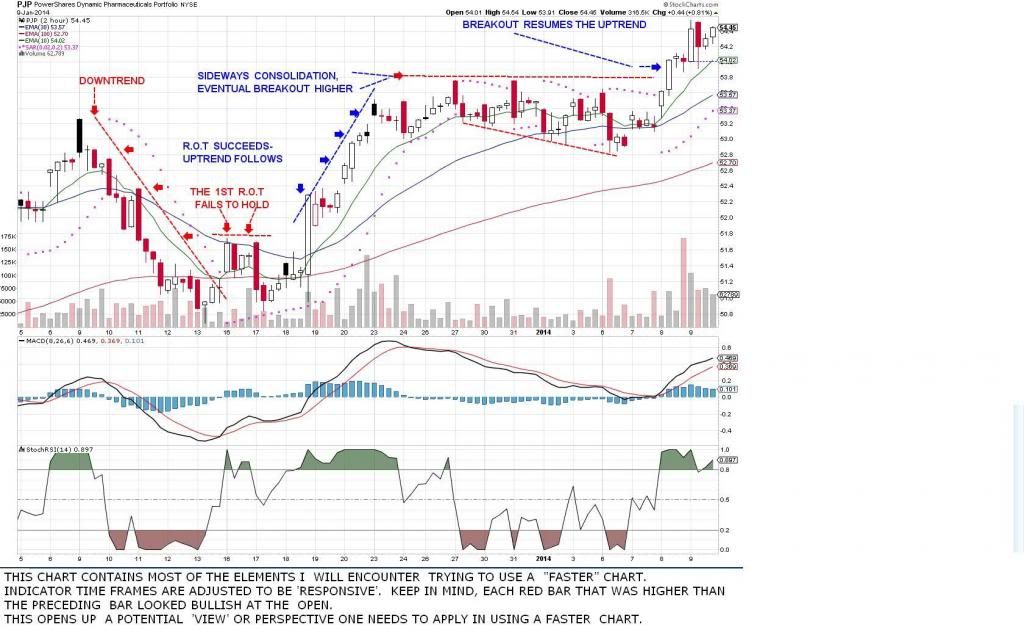 |
|
|
|
SD-2014
Jan 10, 2014 20:15:29 GMT -5
Post by sd on Jan 10, 2014 20:15:29 GMT -5
aDDED TO THE PJP POSITION . 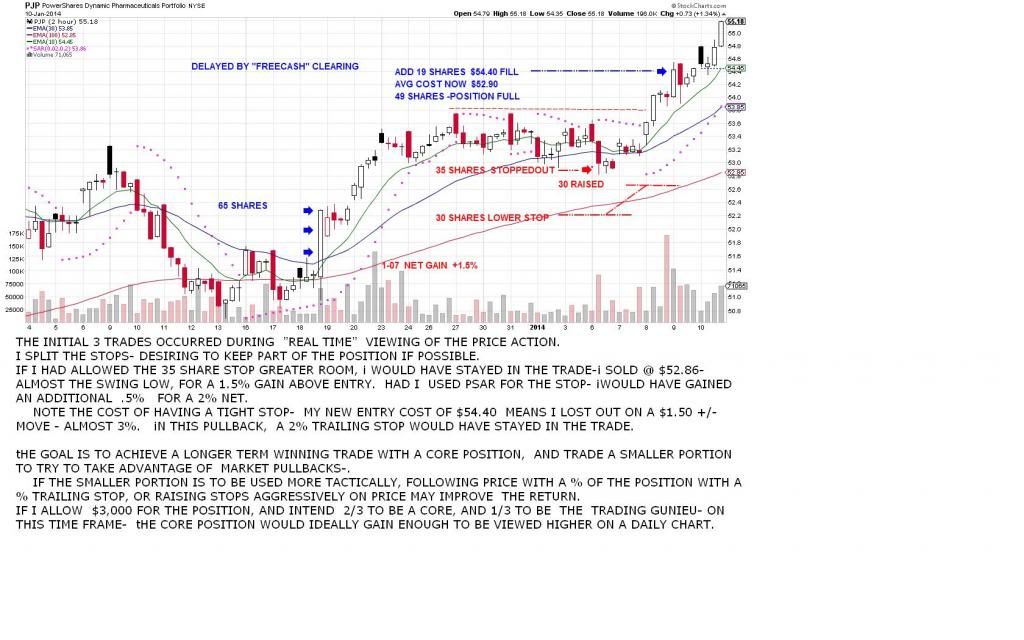 |
|
|
|
SD-2014
Jan 13, 2014 19:09:13 GMT -5
Post by sd on Jan 13, 2014 19:09:13 GMT -5
caught the market action early in the am , PJP was up 1% and BX was green as well.
Later in the pm, I had a moment and saw nothing but RED.
PJP had been extended, and BX was falling back and looked as though it was heading into the red zone-
I sold my added shares of pjp- raised a stop on the remaining 19 shares to $54.70.
BX sold at my entry cost- 0 shares remaining
One of my issues with losses last year was taking R>O>T> trades against the trend, -
but I took in 30 shares of SDS today, will give it a tight trailing stop.
I had a buy-stop order in for DTN above yesterday's highs, Stock dropped lower.
I had held 1/3 of the IB account in cash, so I can try to get some lower purchases on pullbacks..Getting that opportunity sooner than i desired.
|
|
|
|
SD-2014
Jan 13, 2014 20:04:50 GMT -5
Post by sd on Jan 13, 2014 20:04:50 GMT -5
|
|
|
|
SD-2014
Jan 13, 2014 20:10:22 GMT -5
Post by sd on Jan 13, 2014 20:10:22 GMT -5
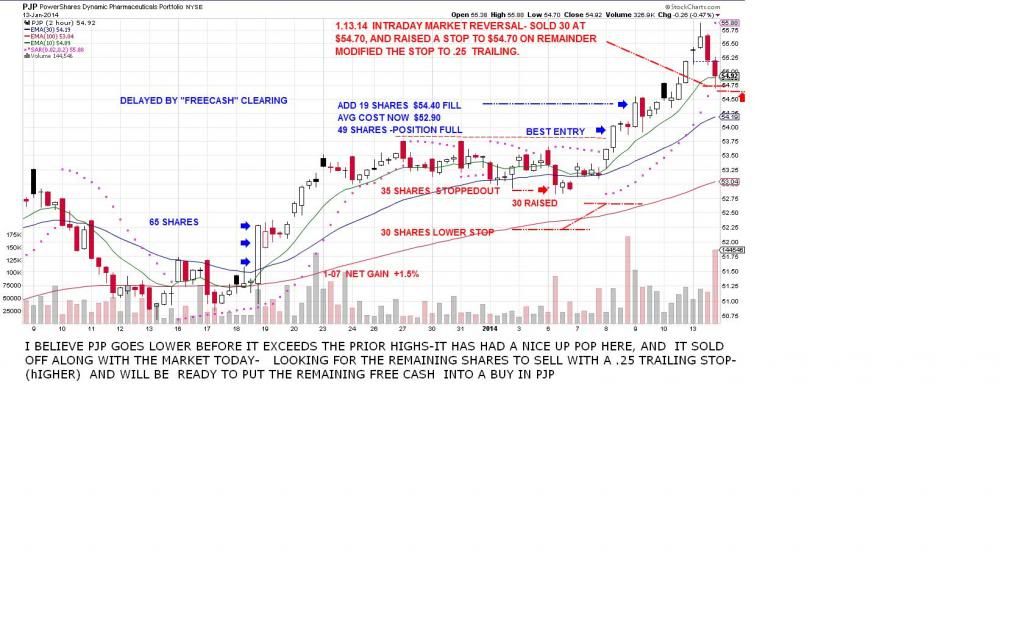 i'LL LOOK AT CONDITIONS IN THE PREMARKET, AND MAY CHANGE THE TRAILING STOP. |
|
|
|
SD-2014
Jan 13, 2014 20:27:40 GMT -5
Post by sd on Jan 13, 2014 20:27:40 GMT -5
DTN had been looking weak for several days- but Friday gave an indication that it would try to move higher- It failed to close above the prior day's ranges, but was holding above the fast ema- I set a buy-stop just above the highs. Today, prior to the market sell-off, DTN continued lower- my expectation is that it will possible go into the mid point of the prior range, vs the top of the range. I spent a lot of time looking at DTN, with fast renko charts, and the renko charts method that looks the most consistent does not take every up price swing- So, as a continuation, I will compare the fast candlestick with the fast RENKO to see what "works" best. 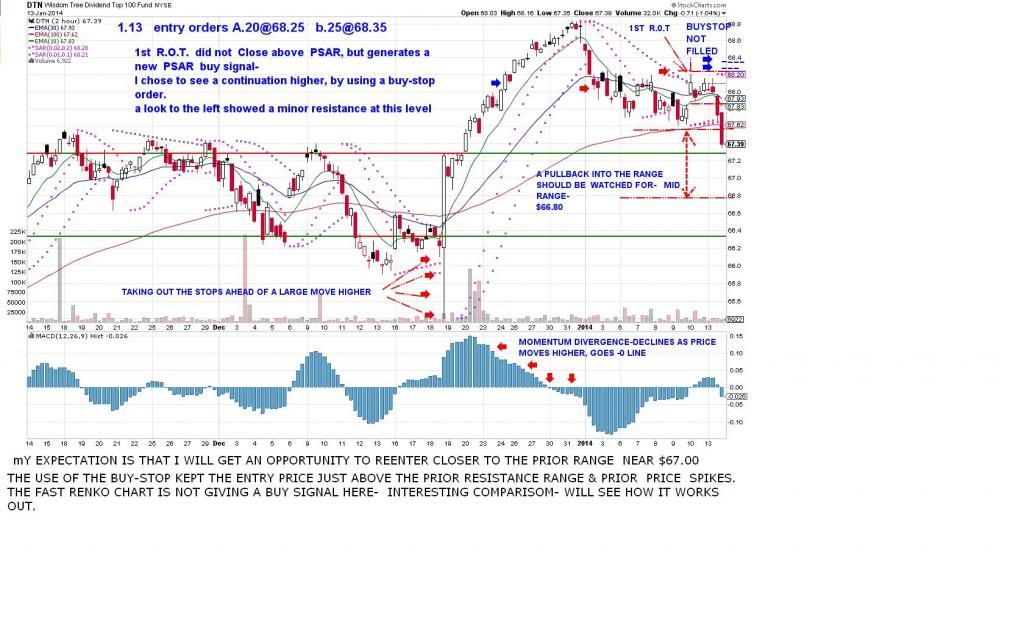 |
|
|
|
SD-2014
Jan 14, 2014 21:03:46 GMT -5
Post by sd on Jan 14, 2014 21:03:46 GMT -5
As I think I noted about entering SDS- my prior losses over the last year that were relatively large occurred when I bet on a downturn in the market- expecting it was the real overdue event occurring.
The same occurred with yesterday's price action in SDS-
I bought into the trade later in the day just 30 shares- @ $30.66
Watching the market open today (some free time presently intraday ) I saw the market appeared to be making a push higher- SDS was relatively slow to sell initially, and I was able to exit at $30.30 for a smaller $13.00 loss incl commission.
I had also sold PJP at the very low as it looked aggressively Red in it's decline- I was certain that this would embrace a multi-day market decline-
My 'BIAS' to be more prone to negativity again led me astray-
I had sold PJP "early" as it had broke down on the 1 hour chart , but on the 2 hour, although price had penetrated the fast ema, it had closed higher- I did not wait to allow the bar to close below the fast ema-
Anxious to protect profits, and watching a solid red intraday bar below the fast ema, I bailed on that portion of the position- from where it moved and closed higher.
Today, as the market started higher, I covered my sds short, and expected PJP to give a pullback- Not pulling back by midday, I repurchased (glad I had kept a portion of free cash!)
at a cost of $1.00/share higher-
This now raises my average cost to $54.69. for 49 shares-
On 2 occaisions I have sold blocks of this position to protect an expected down side decline, and both times the sell was near the pullback lows- I then repurchased at a higher cost, effectively cutting the net gain anticipated by selling and expecting to repurchase more at a lower price. That significant lower price did not occur-If viewed from the perspective of a daily chart, yesterday's price action lower was mild, with the uptrend still in effect. Getting too focused on a narrow time frame is not productive for the many whipsaws that will occur on a faster chart- Have to develop the ability to hand off and Risk more to a larger time frame.
I had an initial great entry, with 65 shares coming out of the base- That combined entry cost was never violated. Got to learn to allow a winning trade room to run.
|
|
|
|
SD-2014
Jan 15, 2014 9:36:12 GMT -5
Post by bankedout on Jan 15, 2014 9:36:12 GMT -5
"Got to learn to allow a winning trade room to run."
I know some people use the faster time period chart for entries only. So basically, let's say you are trading the daily chart. You would drop down to the intraday chart to help you fine tune your entry. After your position is established, you no longer look at the intraday chart, and stay completely focused on the daily chart.
The market always finds a way to continue teaching us lessons......
|
|
|
|
SD-2014
Jan 15, 2014 18:47:04 GMT -5
Post by sd on Jan 15, 2014 18:47:04 GMT -5
"I know some people use the faster time period chart for entries only. So basically, let's say you are trading the daily chart. You would drop down to the intraday chart to help you fine tune your entry. After your position is established, you no longer look at the intraday chart, and stay completely focused on the daily chart.
The market always finds a way to continue teaching us lessons......"
VERY True, hopefully we listen as those lessons come to be. and that faster entry and eventual "handoff" was the general intent -- I failed to step back out in the midst of viewing things in real time intraday to get a better perspective. This will take practice on my part-On the positive side, I had intentionally kept some free cash in the event I did a sell and the price rebounded. I learned that from the prior sell and had to wait 3 days and made a day late reentry.
, The positive was I took the reentry as it was indicated on that time frame, and got back in the trade-
.Thanks for the input!
|
|
|
|
SD-2014
Jan 16, 2014 16:05:06 GMT -5
Post by sd on Jan 16, 2014 16:05:06 GMT -5
As Bankedout had suggested a year ago or so, I am progressively narrowing my focus to a few positions where I will ideally gain some competency in developing an approach to each position. This essentially will be a test of me as to my capabilities to follow & develop a thought out approach. As much as possible, I would like to exclude "Discretion" as my co-pil;We have delivery dates Along that path, I have also decided to take larger position size-approx 1/3 of the IB trading account- which offers less expensive commissions, and trading costs will not amount to a significant factor. The overview is to trade primarily in funds that are predominantly strong & trending - and try to refine an approach 1st on a "smoother" position-and perhaps going for a bit more volatility once I have achieved a level ofconsistency in applying a specific approach. Banked out has provided an interesting ,profitable approach based on entering into a reversal of a trend- and has illustrated his acceptance of the Risk level , in return for expected significant movements higher and a greater net profit in the trade. Reward does not come without Risk. As part of developing a narrowed and more focused approach, I will look back in greater detail & time frames, and try to "backtest" how certain approaches might have worked at different periods in time. One never knows when the tenor of the market may change, and one's approach may need to adapt, or sit aside - But understanding what the "BIGGER Picture" was and is- may prove insightful. Starting off with a Monthly chart of PJP. The chart shows some of the recent past months in which I was starting to focus on Pjp- I have made approx 12 trades- with 4 sells of partial shares- I believe I have made a small math error in the chart in that I failed to include my first lower partial purchase as a start point for the stock's performance. Would further reduce the net 8% return some. This should be the 1st Chart of a "look back" with PJP. 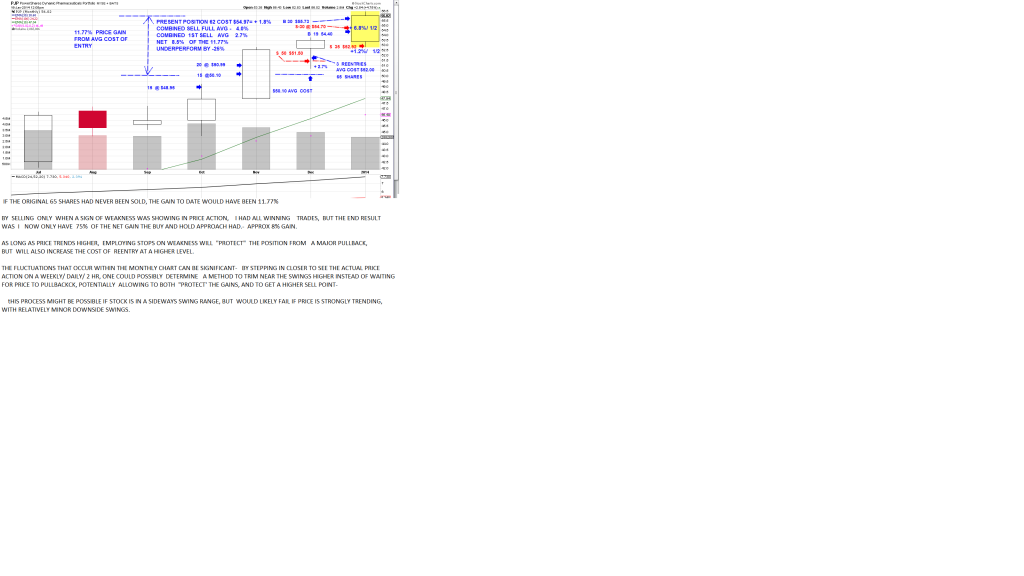 |
|


