|
|
SD-2014
Jan 16, 2014 21:31:05 GMT -5
Post by sd on Jan 16, 2014 21:31:05 GMT -5
I took a "look back" with PJP going back initially to 2007 highs, then 2009 lows, and then divided up each calendar year's performance from Dec close to Dec close of the following year . Statistics are fun- The expression I grew up with is that " numbers don't lie, but people do" . Wanting to compare PJP with a major index - like the SPY- I chose to look at periods of performance compared where we are today. PJP had a drop of 36% from the 2007 High to the 2009 low. Spy dropped 56% from High to low. Spy went from a $60.46 Low to present day $184.42 - about a 3x or 300% move. from that starting level. PJP went froom a 11.94 low to present day $56.19 or a 4.7x gain from the low. PJP apparently outperforms spy in upside % according to the calculations. As i broke the price movement gains in 1 year durations, the % of the gains did not add up to the movement from the original price. If I had $10,000 and purchased each stock at it's very low point PJP -11.94 = 837.52 shares SPY $60.46 = 165.40 shares. PJP's Dec closing price $$53.48 x 837.52 shares =$44,790.00 SPY Dec closing price $184.94 x 165.40 = $30, 589.00 PJP outperformed the spy by $14,201 or 46% While the $$$ performance from start to end is a tell, I was surprised that the specific year to year gains ended up representing a significantly lesser amount of % increase. When i add up the incremental gains on an annual basis of PJP, from the 2009 low to Dec close 2013- I see only a 179% year over year movement- The annual gain% does not compound the actual net gain of each prior year- A case for long term investing and reinvesting, and perhaps staying the course! Too late this pm, but compare this PJP chart which appears to have significantly outperformed the SPY over 4 years- Notice how relatively "Stable" the trend has been compared with SPY. 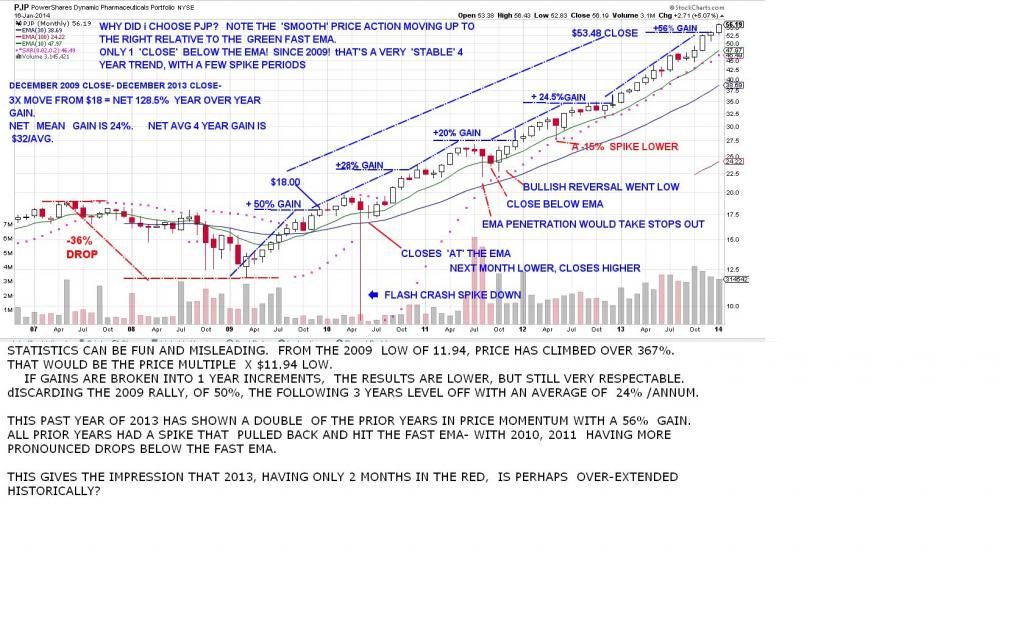 |
|
|
|
SD-2014
Jan 17, 2014 10:01:50 GMT -5
Post by bankedout on Jan 17, 2014 10:01:50 GMT -5
Another thing to keep in mind is the Pharmaceutical companies (and all Industries) go in and out of favor. Not always at the same time as the S&P 500. As an example, if you chose Fall of 2002 to Fall of 2007 for your comparison, the S&P 500 would have looked like the better bet.  |
|
|
|
SD-2014
Jan 17, 2014 15:35:22 GMT -5
Post by sd on Jan 17, 2014 15:35:22 GMT -5
Agreed- As you point out- All industries go in and out of favor-
As part of looking back , I thought it would be useful to compare it against the SPY to get some understanding of the long term price action & volatility. Particularly if this would be an instrument I might select for long term trading or ownership.
I intend to drill down a bit deeper on faster time frames through some of the more volatile periods in the stock's history. Just analyzing within a one year approach while the trend has been very favorable will not yield any practical information as to what course of action I should be prepared for-and how would i elect to handle the position on a change in trend/momentum-
As you also noted, this relatively narrow period of good performance for the past 4 years could change tomorrow-
and see a prolonged period of market disfavor- Thus, one would need to have some criteria to decide -even on a larger time frame- as to when it would be necessary to exit the position.
In the days and possibly weeks ahead, I hope to take slices at different aspects of looking back in different time frames- starting with the weekly chart and some different methods IF one elected to use That time frame. It would be great to start off on an hourly -pass a core position downstream to a daily, then to a weekly.As long as there was decent performance longer term.
Thanks for posting! And please jump in (anyone) with additional or counter input!
|
|
|
|
SD-2014
Jan 17, 2014 17:34:04 GMT -5
Post by sd on Jan 17, 2014 17:34:04 GMT -5
One issue of trying to "Backtest" a chart is the tendency to find the results one wants to see- and try to extend those optimized results to trades going forward- Since the future market will never duplicate the past market's actions /reactions, the best one can hope to do is come away with sommething that works for that time period in diverse conditions, which means some rules will likely be needed that limit or expand entries/exits. At the present time, I do not intend to be trading based on the WEEKLY chart. Perhaps - If a position "graduates" to that level. First look is the entire life of PJP -since 2005 - The trend was relatively shallow with pullbacks , until the major decline in 2008. From there, PJP moved up on a faster momentum move , albeit with pullbacks, until the extended move of the past year. 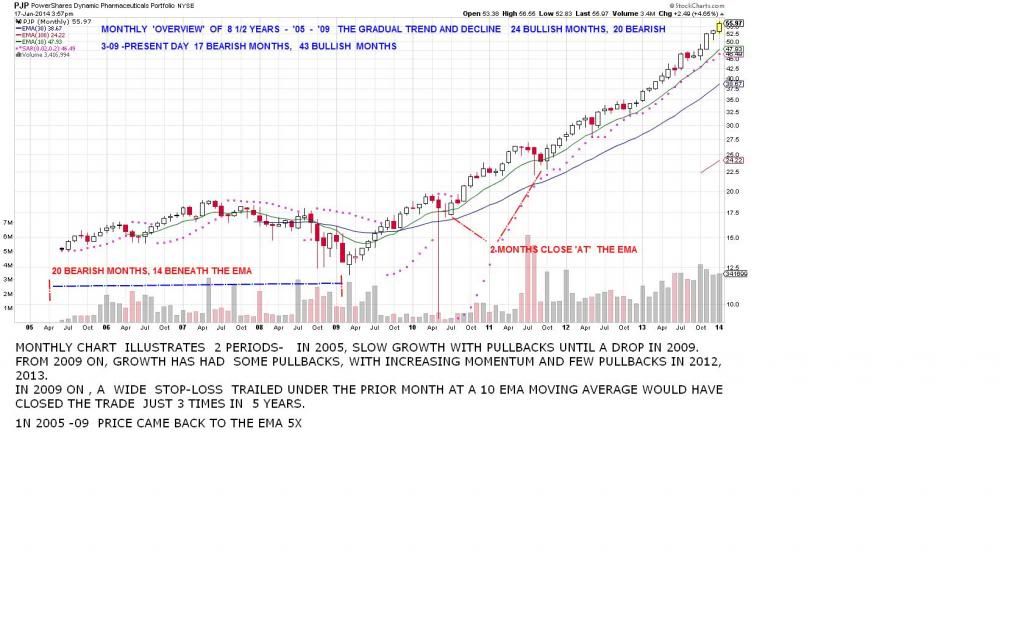 |
|
|
|
SD-2014
Jan 17, 2014 19:32:34 GMT -5
Post by sd on Jan 17, 2014 19:32:34 GMT -5
Starting at the beginning- PJP came public in 2005- and made a series of moves until the major sell in 2008. The chart attached does not extend to the big sell-off in 2008 that was market wide. This chart contains most of the componenets we will encounter as traders- Except the major downtrend. Consider this weekly picture- and the various elements : The stock opens, and gets it's feet, and climbs higher- Each weekly bar does not climb successively higher- occaisionally, a weekly bar drops below the prior completed bar- but manages to continue the trend higher- and -although not shown since there was no prior history- the trend higher did not violate an uptrend or a fast ema if it had been present. An overview of each uptrend shows that it is not uncommon for a new weekly bar to extend below a prior bar's low, but be able to close higher-. This would suggest that a tight stop-loss approach just below the prior closing bar would not sustain a longer term trend in PJP. This type of stop might be very suitable for a seriously oversold equity. Viewing the chart for other elements outside of exact bars' is considering what the moving average may serve as a smoothing mechanism for price action- In this example is a 10 ema shown- Note that in some of the trending periods, price never comes back to close below the 10 ema until the trade loses all momentum and reverses- Yet, in another period, price drops and penetrates the ema but manages to continue higher- Note that as a 'smoothing' mechanism, the ema line or sma line averages the prior price movements and reduces the actual volatility of a major spike in any one bar period. It is not uncommon for price to penetrate the desired ema, as a trend slows and catches it's footing- One could also consider that a price spike is not as significant as a price close below the ema. Should price close below the fast ema, it is largely a sign of significant drop in momentum, and perhaps a time to raise a stop-loss. One could also consider a stop-loss based on an ATR value below the fast ema. Some different periods shown within the attached chart: 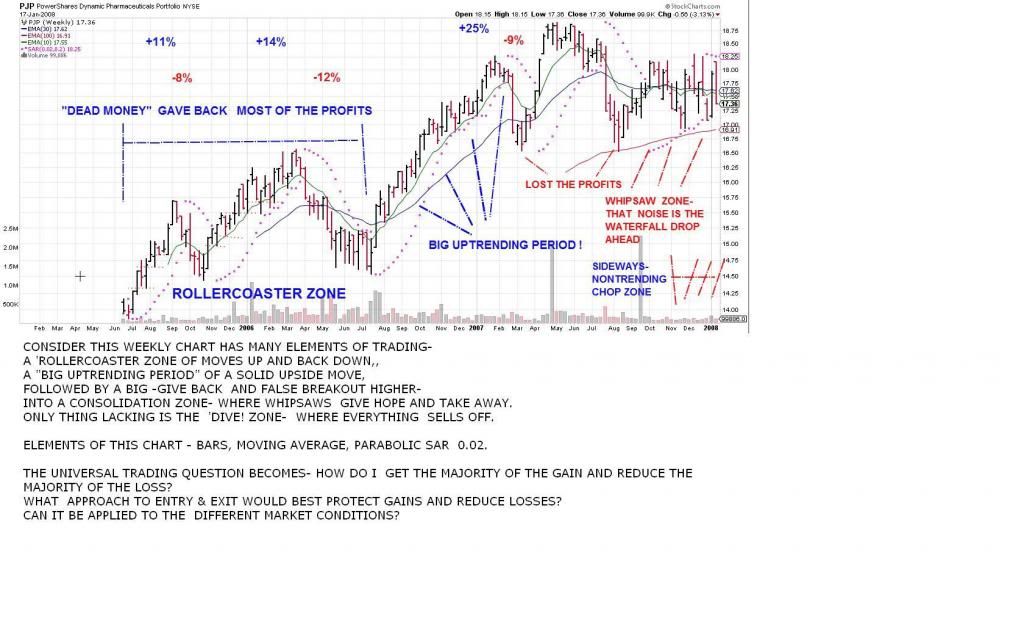 |
|
|
|
SD-2014
Jan 18, 2014 8:30:58 GMT -5
Post by bankedout on Jan 18, 2014 8:30:58 GMT -5
My guess is buy when price closes above 10 week ema & sell when price closes below 10 week ema, might be the best you can do.
Yes, you will get chopped up during times when price is not trending. You could set rules about being chopped up. Let's say you get 2 whipsaws in a row. Now a rule kicks in, your next entry, price must exceed the 13 week high price for your next entry (regardless of crossing 10 week ema). You could pick a different number than 13 in the prior example.
|
|
|
|
SD-2014
Jan 18, 2014 12:01:02 GMT -5
Post by sd on Jan 18, 2014 12:01:02 GMT -5
"Posted by bankedout on Today at 8:30am My guess is buy when price closes above 10 week ema & sell when price closes below 10 week ema, might be the best you can do. Yes, you will get chopped up during times when price is not trending. You could set rules about being chopped up. Let's say you get 2 whipsaws in a row. Now a rule kicks in, your next entry, price must exceed the 13 week high price for your next entry (regardless of crossing 10 week ema). You could pick a different number than 13 in the prior example." Yes, in trending periods, an entry and exit around the 10 ema would have netted some gains and reduced some losing periods- The whipsaws in trend -you address- is when the price fails to trend and drops into a consolidation range- I like your requirement of price meeting an additional entry requirement for a reentry in that condition-Setting that higher standard for price movement would likely be doable & profitable- an additional criteria as you suggest for a reentry in certain conditions would save some losing entries, and would be prudent to include in one's approach,. An excellent idea! This Get's long winded - but a good exercise overall. If one looks at such a basic starting point for an entry/exit , and "stand aside" condition- it is a starting point for a weekly strategy. It would likely be profitible, and with years of data, it could be researched, as a possible repeatable WEEKLY strategy. That same strategy outline would likely work for many equities. Again, a key element would be how to handle non-trending periods One could also consider a "go long- Go-short" - condition based on action on enter on a close above- stay long- go short on a close below. If price was trending in both conditions, one could take profits out of both moves. One could make refinements to that go-long- go short- based on recognition of the predominant tend was up, a smaller position on the go short entry in an uptrend.- only added to if price broke a major prior support and appeared it would decline further. (This would have been the condition perhaps in 2008) In this tighter look at PJP, I'll mostly focus/explore for now on looking at other elements in the Long positions- that perhaps could enhance or detract from the simple close strategy. Something to be said about the KISS approach as easy to follow- One of the big limitations in a crossover strategy is that price can often make a bigger move much higher- well away from the ema. and eventually there is areturn to the mean - back near the ema on pullbacks lower- A good example of this is evident in the initial 2005 run up in Augest price based and then had 2 weeks of momentum moves higher-pushing to a new high well extended from the ema. This was followed by 4 weeks of lower price action until price declined and Closed below the fast ema - The Price Close strategy would require that one wait for the weekly bar to actually make a CLOSE Below. the weekly ema before setting a stop at that level or selling outright. That Close is followed by a turn in the ema and downtrend continues. But, the downtrend actually started at the reversal bar made following the HIGH>4 weeks earlier. OK, that's the price of having a system that is designed to not be too close to the price action- Could one improve on this initial approach and apply it to each trending period with improved results? Included in this chart is PSAR- it can be used- with some reservations- as a trailing stop-loss below trending price, and as a possible buy-stop level to take a reentry- Declining psar values above price also suggest- to not take a long position. the PSAR value as a stop would be based and adjusted higher only after a weekly bar Closes. There are limitations and adjustments one can make to PSAR, and it does not perform well in consolidation ranges-, Note how well PSAR did as a stop-loss level in the 3 uptrends on the attached chart- PSAR actually exceeded the still valid ema in Feb -'07, but in all 3 trends if used as a stop exited the trade while the R.O.Y. candle was still being formed- Does it work this well in all trending periods? That would have to be looked at. Some actually use PSAR as a valid trading approach. Could one effectively apply a similar shorter term trading strategy to this weekly chart and effectively make better entry/exits, and net greater profitibility? WEEKLY CHART 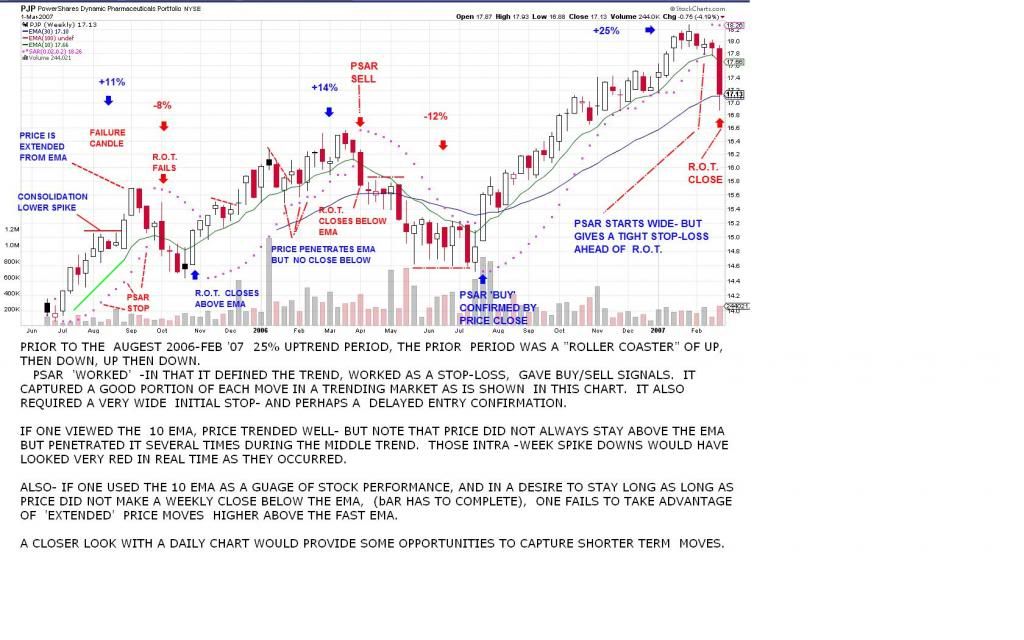 |
|
|
|
SD-2014
Jan 18, 2014 13:50:54 GMT -5
Post by sd on Jan 18, 2014 13:50:54 GMT -5
This Chart takes a closer look at an initial price run up and subsequent reversal and turn down on the weekly. Entry would be assumed to start on the 3rd week as price moved higher - Both PSAR and price action warranted an entry at that tme. Note that price moved up, both PSAR and the EMA stop requirement were never in jeapordy during this uptrending period. Price gathered momentum, and moved well above the ema and peaked. This extended move gave way to a price decline for the following 4 weeks until it declined below the ema and made a -ema close- PSAR would have reacted a bit faster than a stop that had to wait for the bar to CLOSE below the ema. Both trade methods would have netted about a 4% profit in a +10% move- How would one have improved the profit scenario by capturing some of the gain the strong momentum move provided? Pullbacks from strong momentum moves are not uncommon as price gets extended further from the moving average- Does this occur often enough to be included as part of a strategy? What if one considers that volatility in price is an opportunity to recognize when unusual volatility presents an outsized gain. One does not know when this trend will end, but a trailing % stop as part of this basic strategy might prove advantageous. One could consider evaluating The ATR, what is the Average pullback to the ema % from a peak high, and where would one be able to take advantage of strong momentum moves should they occur, yet be wide enough to be outside of the "Normal" swings. 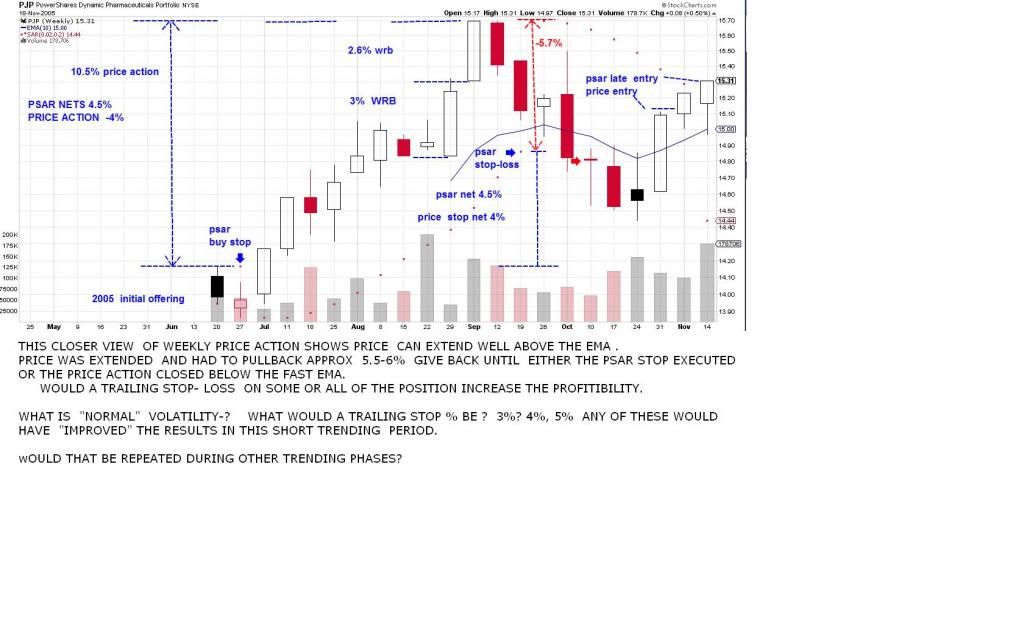 |
|
|
|
SD-2014
Jan 18, 2014 16:57:51 GMT -5
Post by sd on Jan 18, 2014 16:57:51 GMT -5
A closer look at the initial starting trend in 2005- I fully understand there is nothing conclusive about a small period chart analysis- but it gives some ideas for comparing with other periods over the years- Just a starting point- This attached chart shows daily candles over the initial months- What is more evident here with the individual bars vs the weekly bars, is that one can distinguish individual days of price momentum, and then see the days of price pullback- For the purposes of this chart, a 20 ema serves as a trend ema that was not violated until price rolls over in the same period as it did on the weekly chart. There is also a slower 0.01 PSAR . However, once it crosses the 20 ema it rapidly closes in on price. In considering the concept of employing trailing stops, The daily chart view shows price pullbacks from the daily highs back towards the 20 ema. In the 1st uptrend period, there are 3 such price swings following larger price moves higher and following pullbacks. These swings average near 3% and never violate the 20 ema. If this was proven to be "typical" over the course of the years, one could add a volatility % stop loss- to the trading equation- instead of 3% - a 4 or 4.5% stop would certainly expect price to violate the 20 ema. on the daily. Why bother? The advantage of the daily chart is that price action failures register sooner than the Weekly Chart. In the weekly chart examples, a 10 period ema was used. 10 weeks is equal to 50 days. The weekly chart close below the 10 ema captured about 4% of the upmove from the original 10+ % price movement. It gave back over 6% from the price high. It is slower to respond than the daily, and would also be less prone to whipsaws. The daily chart in this example captures 7% of the move based on the concept of a close under the 20 ema. This a 3% difference over the weekly, and represents a 75% profit improvement on this particular trade- Can this be repeated with any consistency? One of the issues with using any faster time frame is that signals may be more timely, but also whipsaw signals will be more plentiful. As price dropped to make a daily close about $15.28 (.02 below the 20 ema) and caused a stop-loss to be placed at or directly below-and was executed the next day. Price moved down for a few days, rallied from the $15.00 level, and moved back and made a close above the declining fast ema. This would be a "Buy" signal on a close above an upturning ema if that was the only condition. As is typical with price breakdowns, a 1st initial R.O.T move often fails to hold. Price made a spike higher the following day, penetrated above the declining psar , but failed to close above. By adding an entry criteria using a Close above PSAR as a 'condition' this whipsaw trade would have been avoided. Employing a single method of viewing a proposed trade can perhaps be improved by the use of a secondary confirmation. 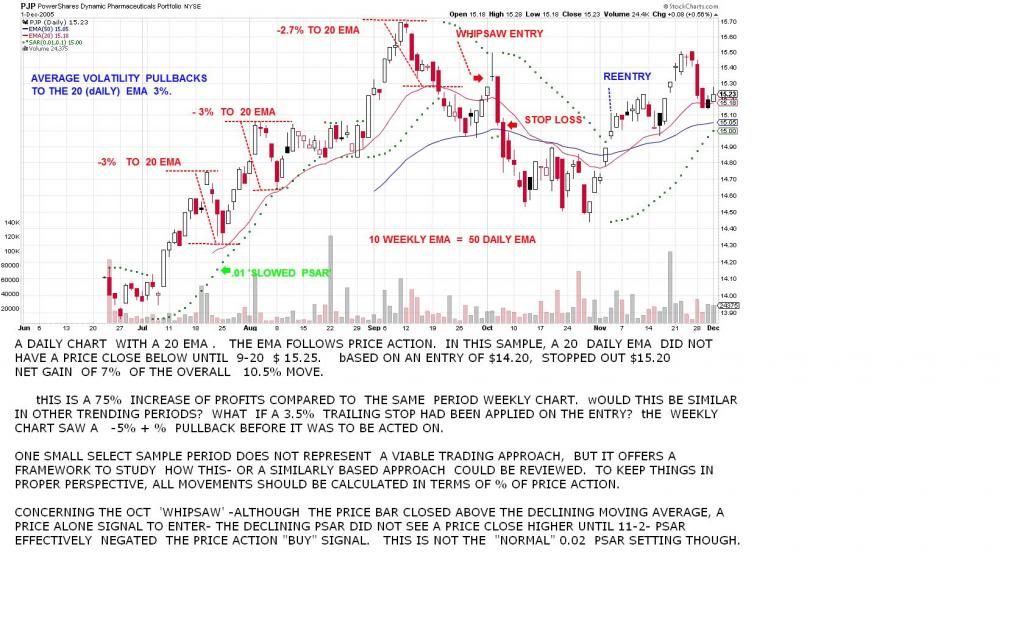 |
|
|
|
SD-2014
Jan 18, 2014 21:38:44 GMT -5
Post by sd on Jan 18, 2014 21:38:44 GMT -5
tHIS CHART illustrates a more aggressive approach. Note that a very fast moving average- illustrated with a 5 ema to take advantage of short term price momentum-captures momentum up moves and stops out on drops back to the ema. A first look at this approach does not place stops on each price bar movement- Instead, it uses the smoothing mechanism of the 5 ema to place a stop loss at the ema point of each successive higher bar, and does not react further on a red bar. This approach allows price momentum to have minor inside red bars without tightening the stop-loss. Each stop-loss is only increased following an increase in price value- Essentially, this is comparable to applying a very tight trailing % stop loss with some minor variation as to the value of the ema. In terms of very tight tactical trading, this swing trade approach is very short term oriented- As is illustrated in this initial chart, Whether this has any long term viability would have to be seen- As a method that captures a very finite move, it has the flexibility of allowing a pause in the uptrend to occur, but any violation of the uptrend is met with a tight stop-loss. This would perhaps be the best tactical approach in a very choppy market, for very aggressive trading. 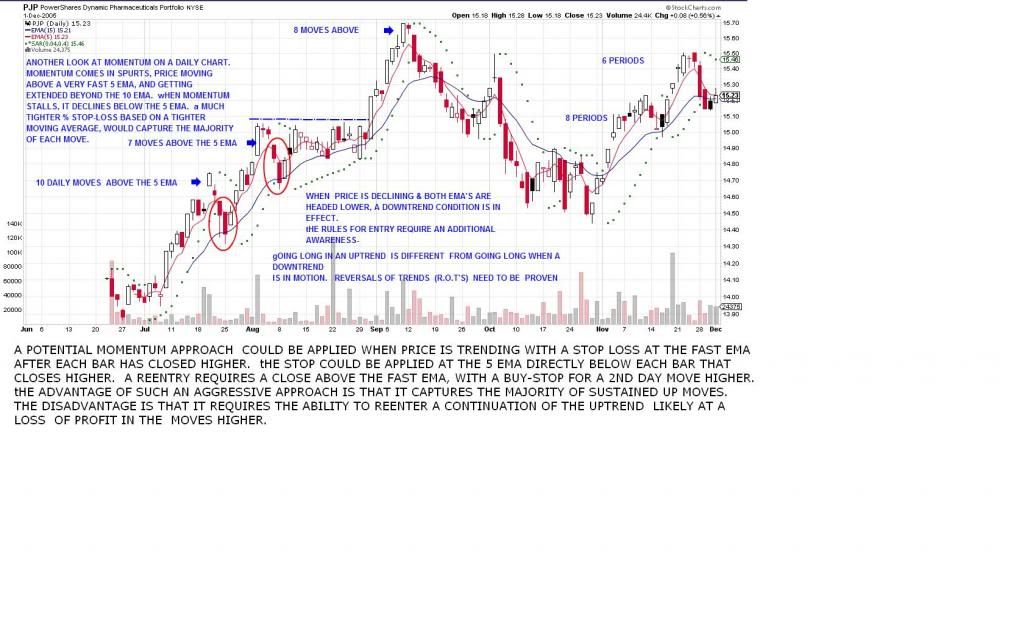 |
|
|
|
SD-2014
Jan 19, 2014 11:15:14 GMT -5
Post by sd on Jan 19, 2014 11:15:14 GMT -5
A look at using a 2 hour 'fast' chart to get a closer look at various price action moves in greater detail intraday vs just a single bar or candle. This faster view also represents the exact same price movements in micro that one will see on daily or weekly charts -eventually- Looking at a faster chart just gives more opportunities to determine how one would like to have reacted to changes in price action - even if it was on a longer time frame. The chart starts with periods of upwards momentum, with price movements having pullbacks to the fast ema, but not breaking down to the slower ema until the trend makes a short term reversal lower. The reversal inthe upwards price movement comes back to the 70-80 ema- from where it goes back higher and resumes the next upleg to a new higher level, pulls back and repeats. With the chart seen & known , it would be easy to define a set of entry/stops/ and reentries based on conditions presented in this picture- One would sell with a perfect stop near the price move higher and repurchase at the swing back lower to the slow ema One would have sold at the high in the consolidation range, reentered at a swing lower in that range, and been along for the breakout move higher to a new HIGH- Then a sell as price lost momentum, and started back down again- Took a reentry on the upmove, and bailed out as the downtrend continued and not taken any other trades yet- However, the future does not perfectly repeat the past- So, which rules or guidelines could one apply in 2005 that would be relevant today? Or, how about the weekly view? Analysis of the past- does it have merit going forward in the future? Obviously, we do not know what the right side of today's (2014) chart will deliver. But, considering how we might have liked to react to certain chart movements gives us some outline for our trading going forward. Some of the questions I will ask myself; What is the trend on this time frame and the larger time frame? Am I targeting a ROT trade with the trend or against the predominant trend- What was the prior history of such ROT moves in the larger trend- Is this a 1st - ROT attempt in a significant decline? How can I best trade such a 1st attempt and do such 1st attempts fail more often than they succeed? How do i position myself on this time frame if my goal is to achieve a longer term larger position? can i successfully trade small move fluctuations to my advantage? Do I have the time to implement a fast chart strategy, and can I extrapolate repeatable entry & exit rules that I can follow? When do I hand-off to a longer time frame.? Or, can I look to a longer time frame and establish similar rules based on prior past price actions that I intend to execute with consistency? How 'rules based' are my entry/exit decisions and how much does personal Bias/discretion influence my decisions? Has that discretionary element of my 'Bias' improved my results over a rules based approach, or hindered my results? Do I have the discipline to actually analyze with specifics an approach that I can follow in various markets? Does that same approach have any merits in other types of trades- anUptrends/downtrends/consolidation? Rules to be in , be out, reduced exposure, increased exposure . With 4 years of largely uptrending markets, one could tailor a successful approach based on that continuing- For example- You bought, You held, You are profitible and succeeding. Works until it doesn't. Works until the markets -perhaps- someday rollover significantly- The "fast" chart view. 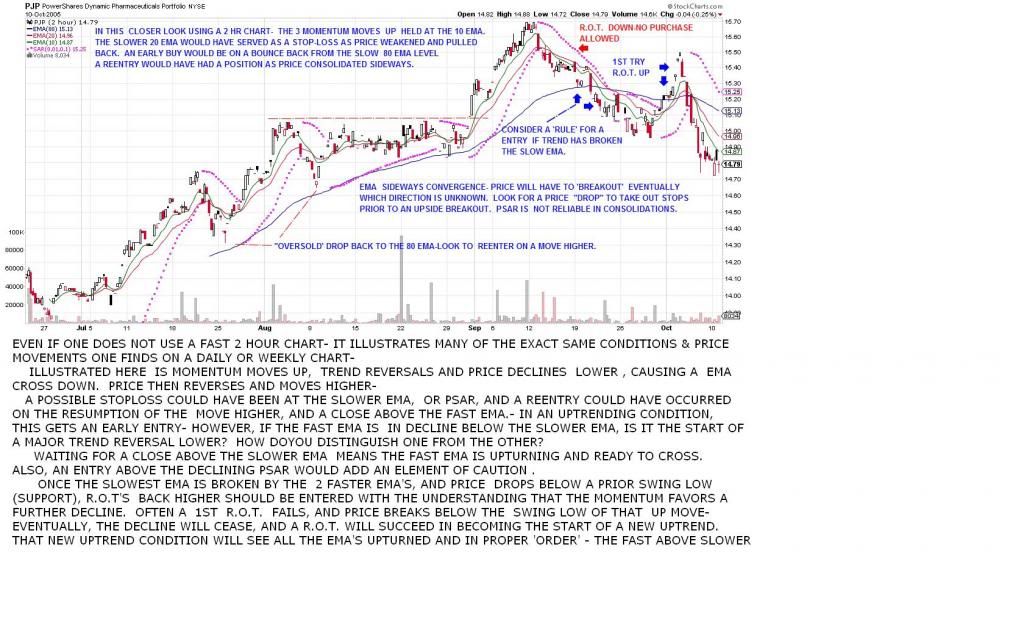 |
|
|
|
SD-2014
Jan 19, 2014 20:56:35 GMT -5
Post by bankedout on Jan 19, 2014 20:56:35 GMT -5
My largest frustration with intraday charts is that it always seems like my entry and exit 'signals' occur during the trading day, when I am not watching. Therefore I miss the points where I would have liked to enter or exit.
I can commit to checking on the markets after work each evening. Therefore I think the shortest time frame I should trade is the daily chart.
Your mileage may vary.
|
|
|
|
SD-2014
Jan 19, 2014 22:17:03 GMT -5
Post by sd on Jan 19, 2014 22:17:03 GMT -5
I do have some time on my present job intraday to view the market action- I like the closer look that the faster chart gives, but it also makes minor moves seem more significant than what they are in the grander scheme of things- Recognizing that is a liability for a long term position developing, I stepped out to view the daily chart and to determine where my present cost of entry fits into the present price movement. The "hand-off' evaluation of a continuance of the trend. I have to conclude that the present price action is historically extended- and the probability is that either price is about to make a significant momentum move higher, or that it should likely be near a short term peak and will see a retracement. Looking at prior moves in the daily, and taking a measure of how far the fast ema can get away from the slower ema- and the corresponding retracement that always follows- leads me to the conclusion that statistically, I am presently near a historic momentum high- in the short term. Price may have more upside- and could potentially go 'parabolic' like bib- but that is not likely- The greater probability is that we are near a peak- and due for a retracement. That retracement will give an opportunity to get back in at a lower cost, if history repeats. Present cost basis $62 @ $54.97 Stop based on Sar $55.65 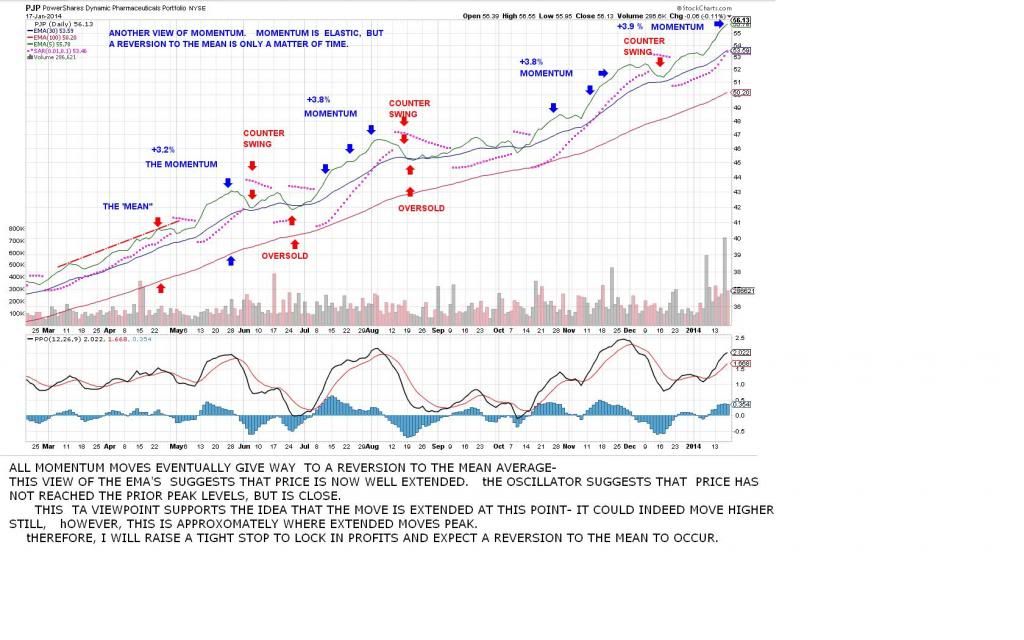 |
|
|
|
SD-2014
Jan 21, 2014 20:42:18 GMT -5
Post by sd on Jan 21, 2014 20:42:18 GMT -5
Market was set up to move higher today from the open-
I had set my stop-losses for PJP and then a buy-stop with limit order to add an additional 20 shares- Market opened above my limit, but retraced & filled- went down a bit more (my stop would have worked) and ended the day up closing at a new high.
PJP position is 54% of the IB account, with BX approx 35%.
|
|
|
|
SD-2014
Jan 21, 2014 20:54:14 GMT -5
Post by sd on Jan 21, 2014 20:54:14 GMT -5
wHILE EVERY DISCLAIMER starts with past performance is not indicative of future results....... I took another view of PJP after adding to the position, and trying to calculate how much of the present position should have some minor swing room, and how much should be geared to lock in some quick smaller % profits- I revisited the weekly chart going back a number of years, took price off the chart, and simply used a 3 ema average compared to a slow 30 ema average, and compared how far away price was able to get from the 30 ema- The conclusion was interesting- I'm not sure how to react with the informtion. Price action is at an all-time high and also the momentum is as well. Price this past year rebounded away from the 30 and only had slight pullbacks- never touching the 30 . the 2013 swings average 13.5% + above the 30, while the prior years was 11.5%. The first 2 years had significant swing backs below the 30 ema, while 2012 did not cross. Momentum favors PJP- knowing that it is pulling hard on the elastic- suggests price momentum is extended. any downmove could be substantial though. To me, this favors maintaining tighter stops until I get a better entry pullback to start over from. I will continue to use a divided stop approach- 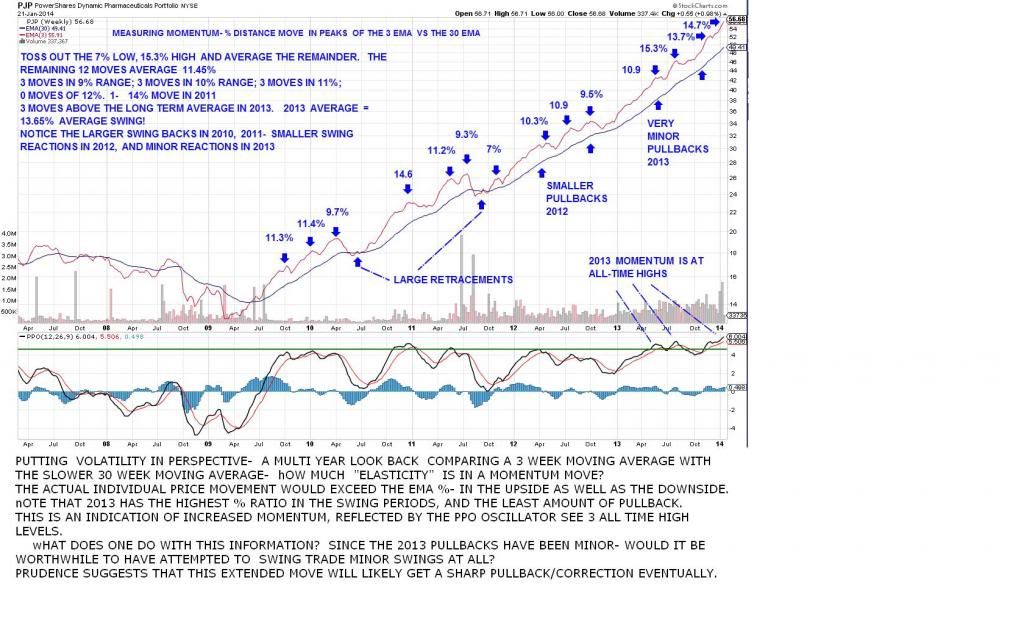 |
|


