|
|
SD-2014
Jan 23, 2014 13:03:13 GMT -5
Post by sd on Jan 23, 2014 13:03:13 GMT -5
PJP STOPPED OUT IN THE FIRST 10 MINUTES THIS AM. $55.87 BX stopped out somewhat later this am. $32.69 Hit my stop by $.02, and bounced a bit higher- I'm trying to be more analytical these days. Do more chart study, and try to not react to impulse as much..Also , do a better job in recording my trades, my thinking at the time, was it an impulse move or was it based on some strategic discipline? All in all, I was pleased with my stop execution of both trades- BX stopped out barely above my cost of entry-and paid for the couple of commissions. PJP has yielded some smaller % profits along the way, and today's stop-loss yielded only a .75% gain-above my averaged entry costs. It was last night that I elected to not split the position with separate and a higher stop, - and allowed the entire position to be at what i considered a "safe' distance from price reaction. I was mistaken. I recognized that this price move is indeed extended, but i anticipated a shallower pullback /close below the ema, instead it was a thrust deep off the open, with selling the initial reaction. Price has since moved higher off the open low, but i am expecting that price will not bounce significantly back into trend up from here- unless the markets do a 180 reversal also. I'm hoping for a pullback and reentry at a lower price than where I sold- The positive- I followed the general outline of this approach- which is to protect the cost of entry (once in winning territory) from becoming a losing trade- However, i could have lowered my stop further, and still shielded the entry- Assuming price does not make an even greater decline in the days ahead. Adjustments that I could have made-: I could have taken 1/2 the position-particularly since it was overweight, and trailed that 1/2 just below price, or possibly sold recognizing the peak we were at in terms of momentum. The remaining 1/2 position would have stayed above entry cost. Had I taken this action, I would have increased the net profit of the trade, and still had an active position. I somewhat had this in place with PSAR stop on part- Will review some refinements going forward. 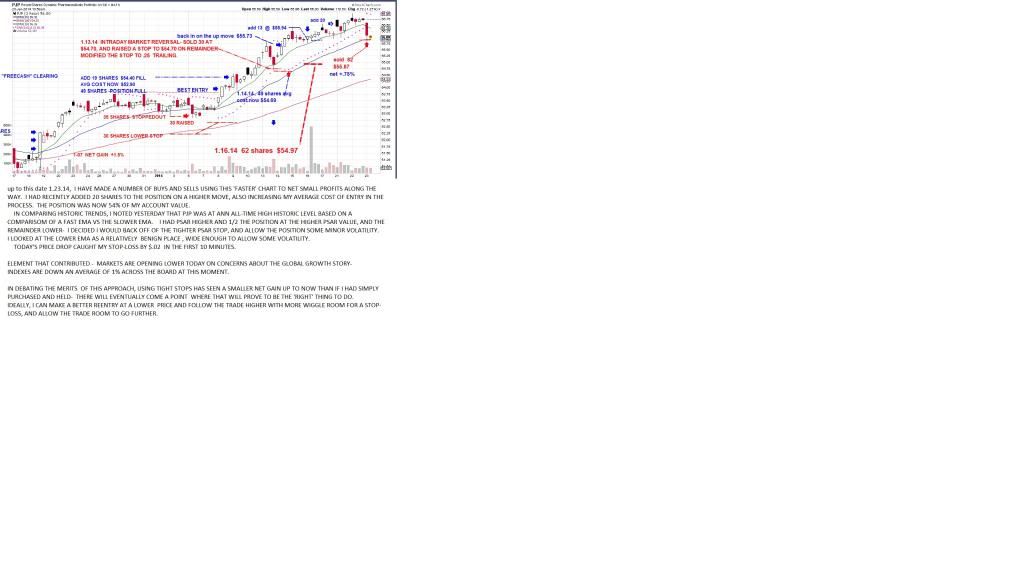 |
|
|
|
SD-2014
Jan 23, 2014 19:51:49 GMT -5
Post by sd on Jan 23, 2014 19:51:49 GMT -5
BX stopped out today- My adds to the position had increased my cost of entry higher after a partial sell previously- I will at some point reconstruct the exact trades that got me to today's higher $32.68 cost of the present position. The point of the present chart was having the trade stop out essentially just at my cost basis, and it looks as though this was a prudent move to have a stop above my entry cost- based on the price action closing much lower. Now that I am starting from 0 positions, o cash basis, I will keep an individual trade sheet for each position, rather than a daily record sheet-- with mixed notes & commentary- I plan to try to do a better job of recording each trade on the chart, and now with 0 position would be a good time to do the summary . For today, I'm posting the prior chart of the price breakdown- My stop-loss was set essentially just above my entry cost, and after the intraday price came within a few pennies of striking it, and moved higher-, I tightened the stop a bit higher to ensure the slippage of the stop execution would keep the trade a $0.00 loser. As can be seen by the price action later in the day, that was a prudent move as price closed 3% below my stop. In my present experiment with taking large positions relative to the trading account total value, this is a necessity to not allow but a small % amount of Risk on any trade. 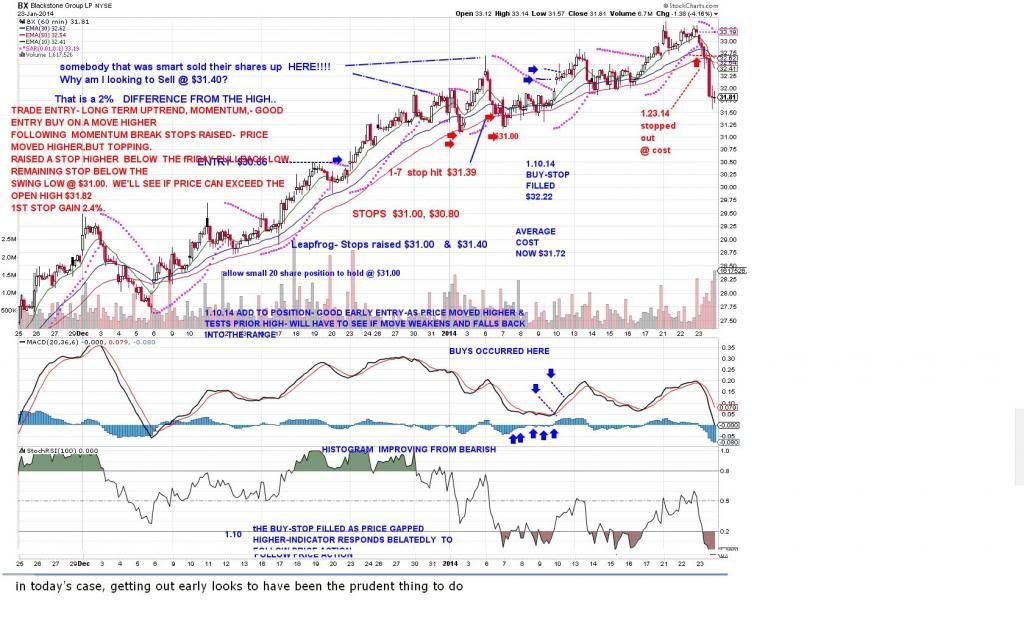 |
|
|
|
SD-2014
Jan 23, 2014 20:55:24 GMT -5
Post by sd on Jan 23, 2014 20:55:24 GMT -5
Focusing on the PJP trade at the EOD- Price sold off initially with the market and caught my stop by just a few $.02 on the initial decline- I think it went a bit lower in that first 2 hr period on this chart- later. Then Price rallied back, had a sell again , and closed higher, putting in a base near $56.00. It is indeed possible that PJP just got caught in the market sell-off and could rally higher from here- but i do not think that will occur unless the market finds the reason to rally as well- This was an unusual drop in a 2 hour bar in this uptrending mode. Although price has been moving higher for days, the indicator was suggesting that it was rising on lesser momentum. My previous look at historical price charts said that 2013 had been an unprecedented momentum year, and this particular spurt had exceeded all prior moves in enthusiasm. (excess) . As had almost all of the up moves in 2013- Conflicting information is that price seemed to be extended compared to historical levels, but perhaps that will also be the changing dynamic going forward in this industry- It was more enthusiastic, but not yet parabolic - Only time will tell- In the short term, despite today's higher close from the lows, I believe we have a better opportunity to continue lower and reestablish a base down 3-5% before we see a successful ROT- Just because of the prior excess % move price has made- I want to see a close above the declining psar value, and how well that captures the bottom action in this stock. The momentum indicator histogram will often detect 'bottoms' and a move back towards the 0 line can be an early indication- but seeing where price is relative to the ema and the psar value may give a better picture- Price action ultimately dictates- but on a faster chart , one does not want to react to a bullish bar or two. Likely a failed ROT in the making. Of course, here i am trying to be predictive- which means i have a bias as to this trade's direction going lower- before it goes higher- Where did I put that Crazy 8 ball? LOL! 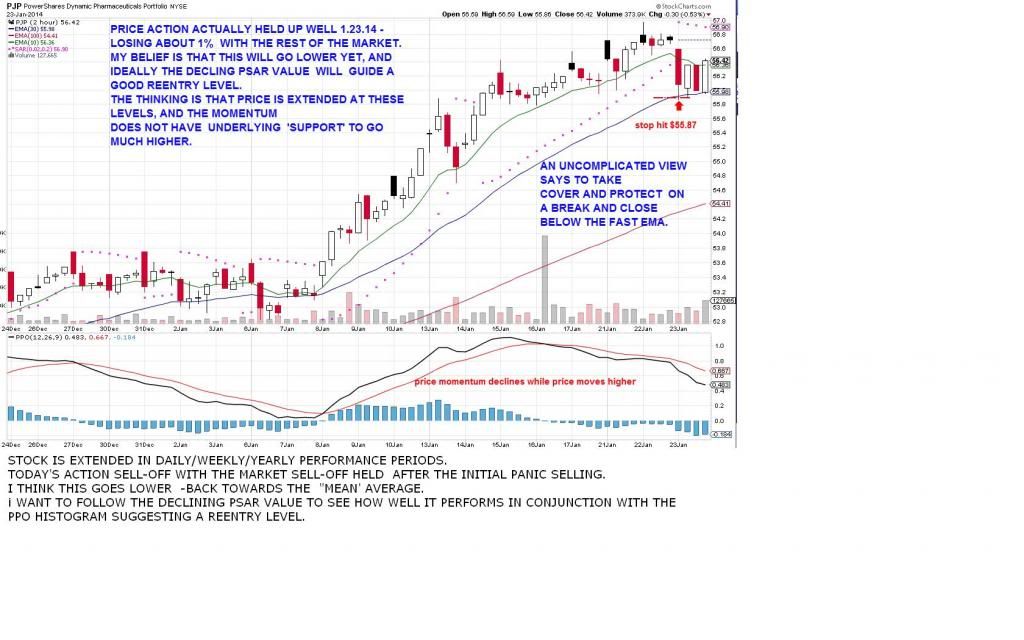 |
|
|
|
SD-2014
Jan 26, 2014 9:18:15 GMT -5
Post by sd on Jan 26, 2014 9:18:15 GMT -5
Another look at a weekly chart- This week's price action ended up as a bearish red candle.It closed above the weekly moving average, but typically, looking back over similar action in past years, that usually is followed by a decline back to at least the 10 period ema. In some other occaisions, the pullback has declined to the 50 ema- Haven't seen that dramatic of a decline since 2011 though- at the very least, a further decline is to be expected- That sets up my Bias- Since this sell-off coincided with the market choosing to sell off, a market rally will likely see a rally again in PJP. Price in PJP is still at a very wide momentum move in a very strong uptrend. A pullback does not mean the uptrend will suddenly reverse- I view it as an opportunity to gain a better reentrywith the assumption I expect the trend will remain higher. 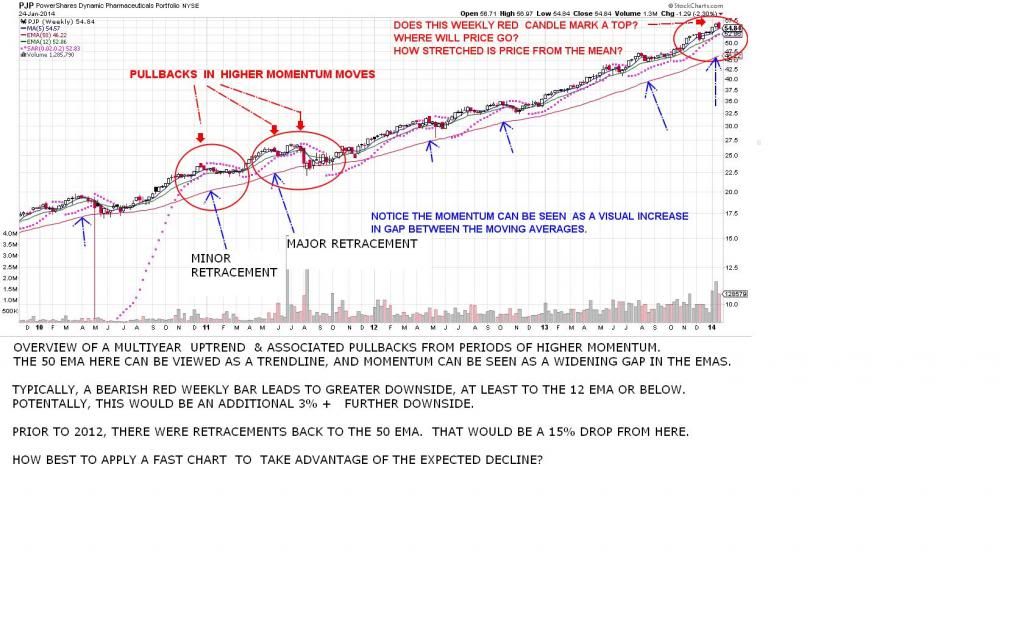 On the weekly long term chart, these movements look relatively benign, but a closer view reveals significant volatility. following that 1st red bar, comes lower price movements & opportunity. 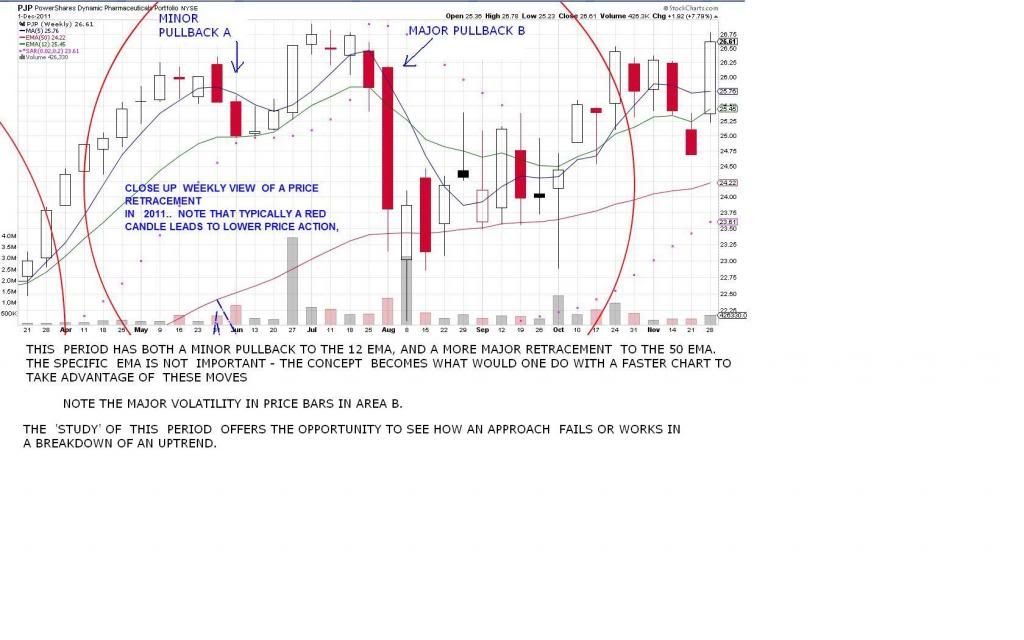 lOOKING CLOSER AT THE DAILY CHART - BIG difference in the orderly pullback of 'A' compared to the major pullback in B. 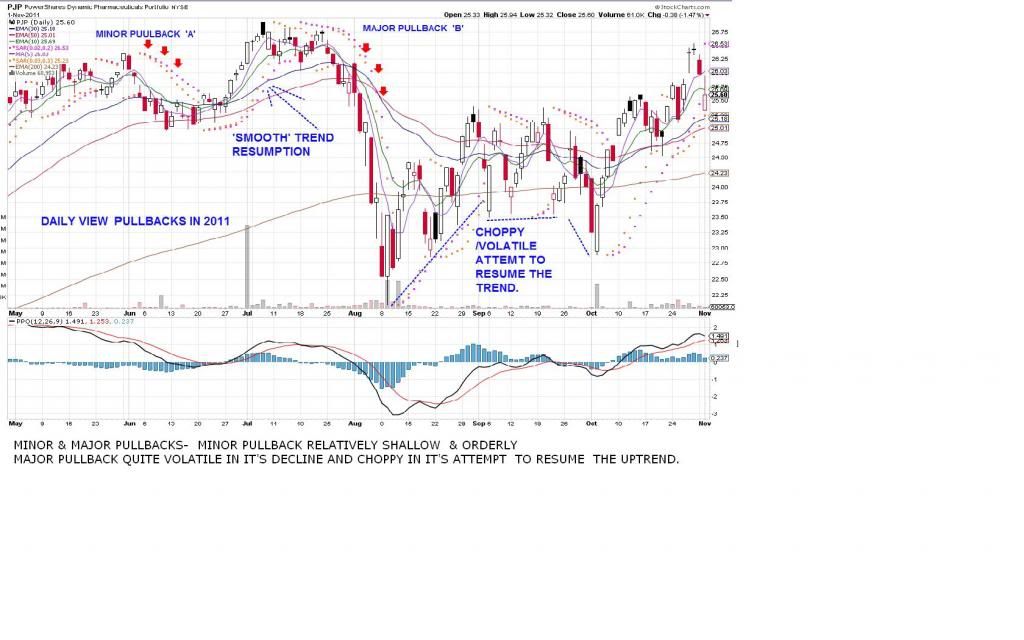 |
|
|
|
SD-2014
Jan 26, 2014 13:22:27 GMT -5
Post by sd on Jan 26, 2014 13:22:27 GMT -5
FIRST CHART IS A DAILY Chart leading up to the 1st initial smaller decline in PJP. there were a number of earlier indications , as price had dropped back to and penetrated -and made some closes below the fast ema. momentum indicator was showing a divergence with price as the histogram was indicating decline while price proceeded to go higher. That divergence can be sustained for extended periods, so i am not sure how valuable this indicator is except as an early warning- and in guaging levels price momentum has reached. A 'fast' chart- such as the 2 hr chart- would have likely reacted (Sold off) to many of these still in trend- but minor pullbacks- and perhaps would simply result in numerous stop out- reentries. Anticipating a reentry following a sell-off is the purpose of employing a faster chart- to get that earlier indication that price is moving and has reached a bottom of sorts in it's decline. In this daily chart, a good initial indicator is that price alternates between red sell bars and white Buy bars as it is still declining in trend below the fast ema. A good initial lesson there is to not trust just a bar itself, but to view it in the larger picture- A second lesson would be the 1st Reversal Of Trend bar that popped up- 1st reversal attempts often do not succeed. Had one reacted to that as a R.O.T. - a buy-stop to take entry on a higher move the next day would not have been hit, as the trade dropped lower. Had one used a buy-stop above- a stop-loss directly below the low of the reversal bar would make sense. As this daily chart illustrates, price makes a bottom and as the ema's cross, it then moves into a nice multi bar move higher. It has several intraday price spikes back down towards the swing low, but never dropped below. A stop-loss below the swing low would have proved successful in this example. Could one have made a better entry than on this daily chart with a reduced RISK? 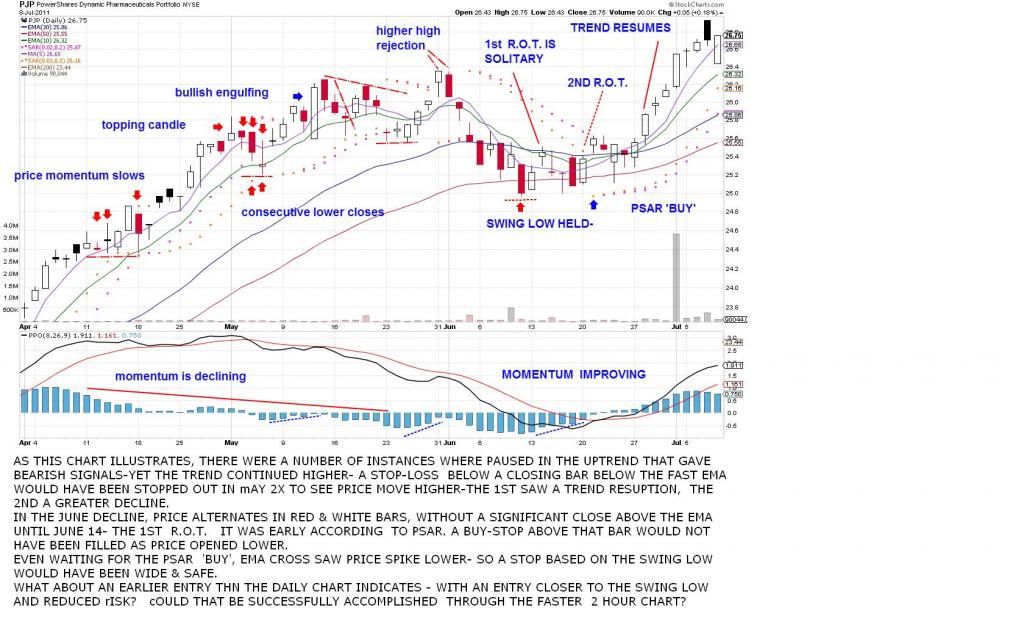 Does a 2 hour chart give better "insight' for better entries & exits? It is all subjective, and depends on the operator. Watching some ALAN FARLEY- dvd circa 2001- "Targeting Profitable Entry & Exit Points" One excellent point is finding an entry as close as you can to the point your trade would be stopped out- Price action would dictate that entry and exit. in the 2 hr chart attached, price as it declines alternates with a push back higher-this is repeated a number of times, with price progressively pushing back higher from the lows and even closing above the fast ema on the 3rd swing. Price made a choppy bottom, and a typical entry requires waiting for a higher close and price above the ema. This would usually also be above PSAR- omitted on this chart-, If the typical entry here then would Risk 1-1.5% - how could that entry be done earlier at a level closer to the stop point? An entry that would RISK just .05% would allow one a smaller loss if the trade moved against him, and a greater gain. In the case of the chart- price pulled back, made a dbl bottom-went higher, declined, and then made a series of higher swing lows- all potential entries. Perhaps the "ideal" AF early entry would be to have second guessed that a dbl bottom would occur as price pulled back and had a limit order with a tight stop under the swing low. If there was a prior support at that level in the previous up trend, that would be a plausable rationale for that catch a falling knife entry. HMMM, what if one was to take a small partial position though? Add to the position at the higher "typical" entry levels. Just a thought. 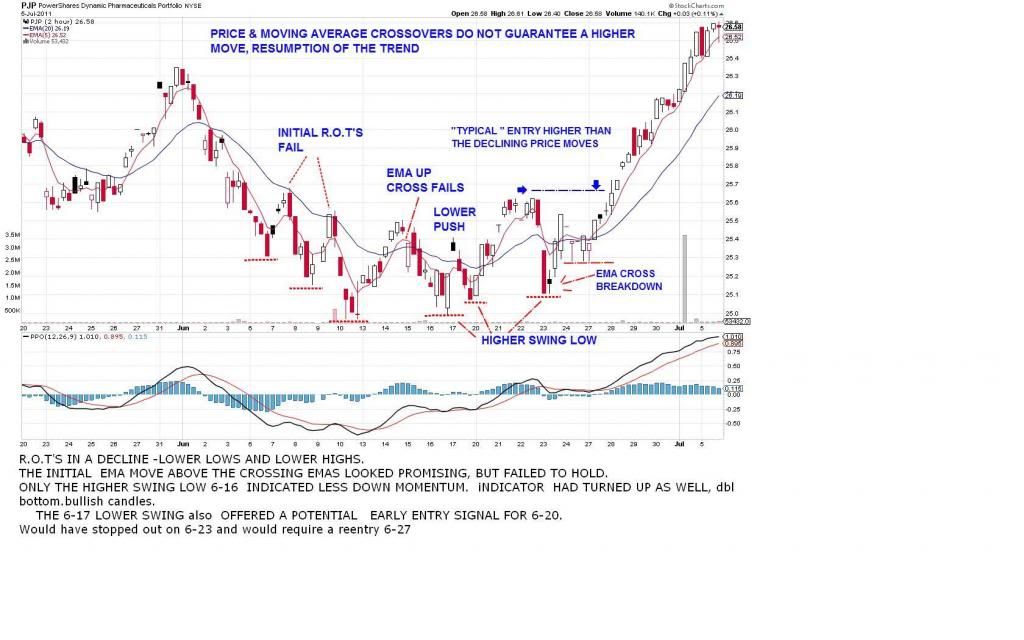 ANOTHER LOOK AT THE 'TEXTBOOK ENTRY -means waiting for a higher price swing to get a close making a higher high- note that this captures about 46% of the total move from swing low to climax high. one could potentially have sold higher by trailing a stop beneath every later daily bar low- or sold on the climax bar failure. there was about a 2.5% move and several days between the swing low of the downtrend and the decided point of 'safe' entry. Capturing some of this area would have added to the net gain. a price action trader would have found spots to enter in that lower zone between Safe & Busted. By entering lower, they would also had a tighter % stop and a lower Risk . 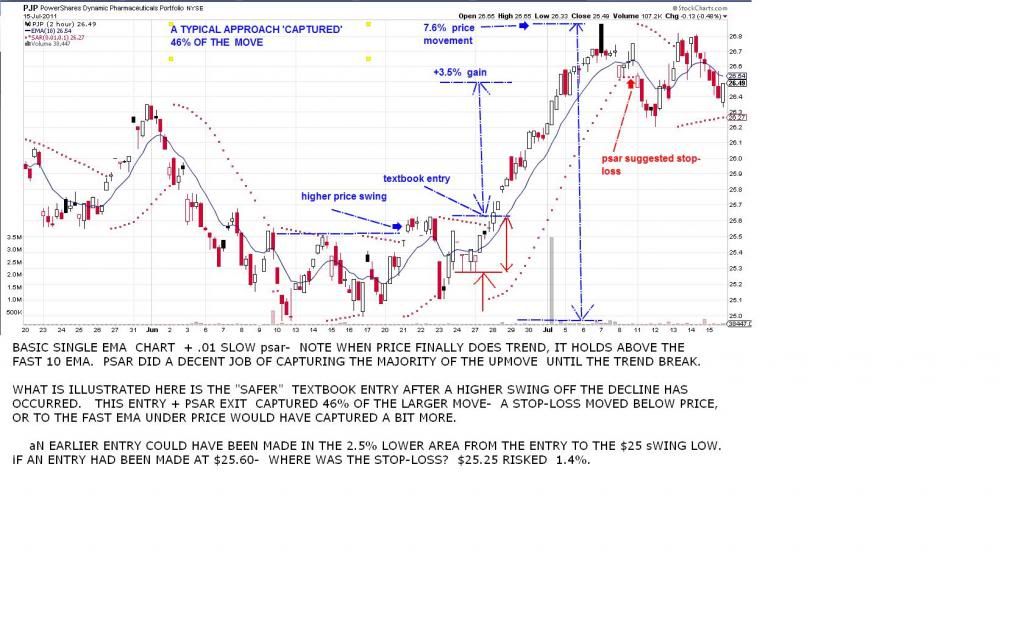 |
|
|
|
SD-2014
Jan 26, 2014 19:34:24 GMT -5
Post by sd on Jan 26, 2014 19:34:24 GMT -5
RENKO CHARTS DO NOT ENCOMPASS ALL OF THE PRICE MOVEMENTS. THEY DO NOT MOVE ON A DAILY BASIS- ONLY ON A PRICE MOVEMENT HIGHER OR LOWER BEYOND THE ATR. THEY MAKE CHART MOVEMENTS LOOK DECEPTIVELY SMOOTH. tHAT SAID, RENKO CHARTS ELIMINATE A LOT OF THE 'NOISE' IN A PRICE CHART. THERE ARE 2 SETTINGS- HI-LO WHICH INCLUDES THE RANGE OF PRICE SWINGS- AND 'CLOSE' SETTINGS- WHICH IS ONLY CONCERNED WITH THE OPEN TO CLOSE RELATIONSHIP. FOR LONGER TERM INVESTING- THE 'CLOSE' SETTING WOULD BE APPROPRIATE. 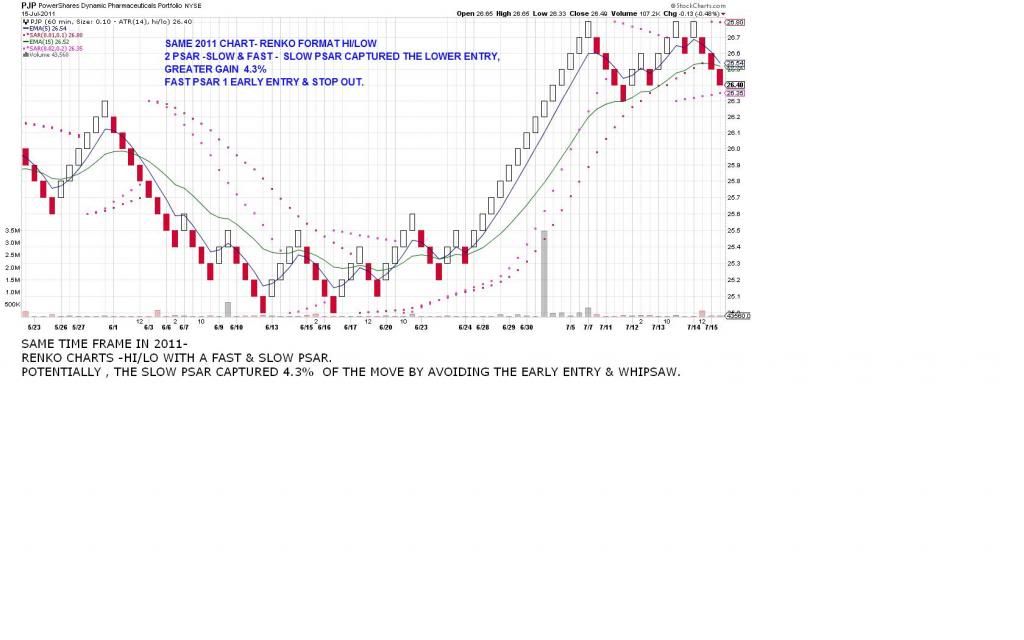 THE FINAL CHART IS A RENKO CHART WITH A CLOSE SETTING. ALSO BOTH A FAST AND A SLOW PSAR- THE CLOSE SETTING IGNORES PRICE MOVEMENTS THAT DO NOT EXCEED THE ATR VALUE OF $.10. THIS YIELDS A LESS VOLATILE CHART. BUT- KEEP IN MIND - ACTUAL PRICE VALUES COULD HAVE EXCEEDED THE BRICK VALUES BY $.09 HIGHER OR LOWER AND NOT GENERATE A NEW BRICK. iNTERESTINGLY, THE SLOW PSAR IS STILL HOLDING THIS TRADE AS A LONG POSITION. 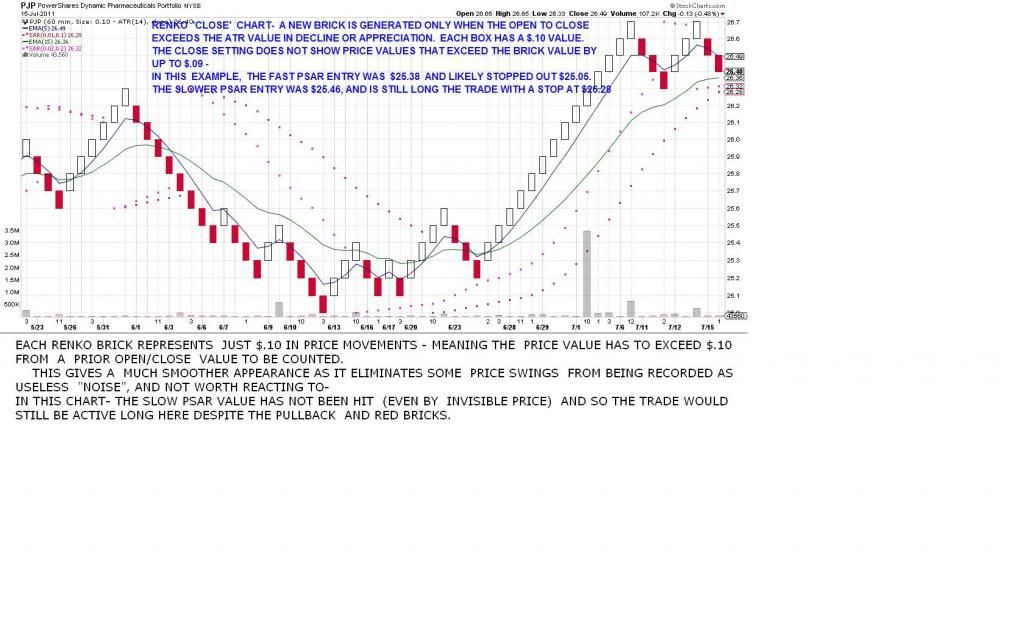 |
|
|
|
SD-2014
Jan 27, 2014 20:47:22 GMT -5
Post by sd on Jan 27, 2014 20:47:22 GMT -5
pjp continued it's decline today. I considered where it might hold or pause in it's decline- and viewing the prior consolidation range as a possible support, I figured price would penetrate into that range part way, and should give some indication of a pause- IF there was any "support" there- Price behaved very well, entered into the range and went slightly below the midpoint of the range and reversed higher-AF would have had a limit order to buy at that level it occurred to me- but he would be using a much faster price chart-and bailed out on the bounce higher. The 2 hour chart is suggesting that at best this move is a 1st R.O.T. attempt, and additional downside is to be expected. I went ahead and placed a limit order $53.60 and raised it to $53.80- It did not get filled during the later pm, and i will revisit the order in the am. Where does my stop-loss lie on a $53.80 fill? The fill would occur on a further decline in price, and if I used the low of the bullish bar as a stop, $53.25 Risk would be $.55 or 1% If that limit order could be lowered, the stop would Risk less. Or- if content with a 1% stop- allow the stop to be dropped to the bottom of the prior range low. Note- this is only a partial order with Freed cash and can only purchase 19 shares - Wednesday will see more free $$$. Another comment about the price action mid afternoon reversal- This same slowing of the sell and attempted reversal occurred in several other etf's I track- including - Importantly- the SPY.but looked weak. This larger picture view including the price action of the SPY with other stocks/etfs mirror the price action - is a tell on a market wide momentum move may be slowing., but not ready to reverse upside. If Futures look stable in the am, an upside move may occur. Likely that will depend on Europe- AAPL drove down the Q's with weak earnings - China disappoints-Downer for AAPL & continued concern of China. I also dropped down in realtime to view price on a 30 & 15 minute chart in the pm. On the faster time frame, the price reversal looked bullish- but a 1st ROT would- 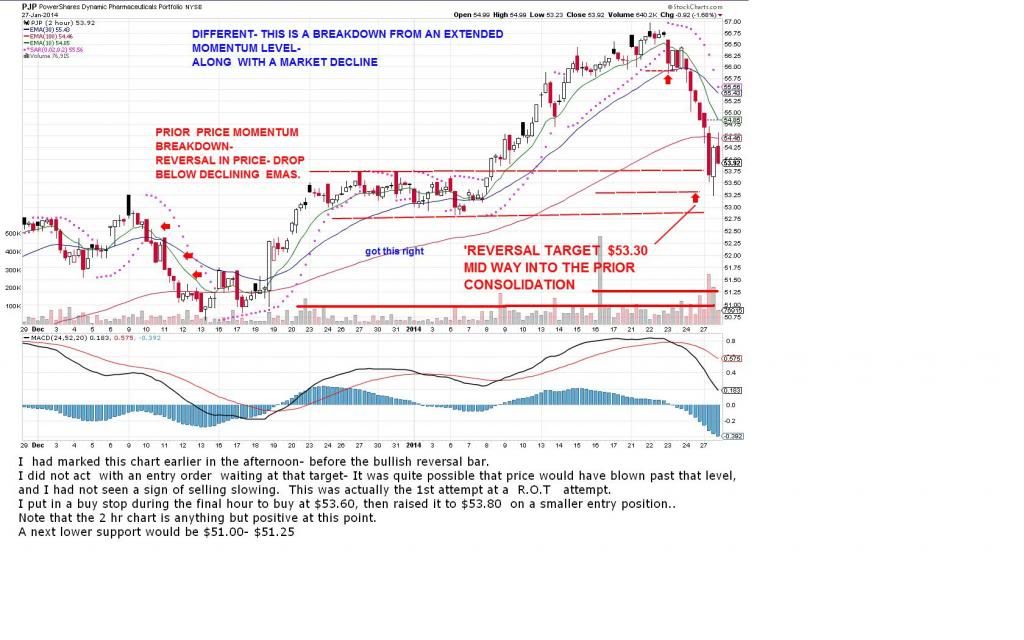 the 30 minute chart I noted in real time as price was rebounding- 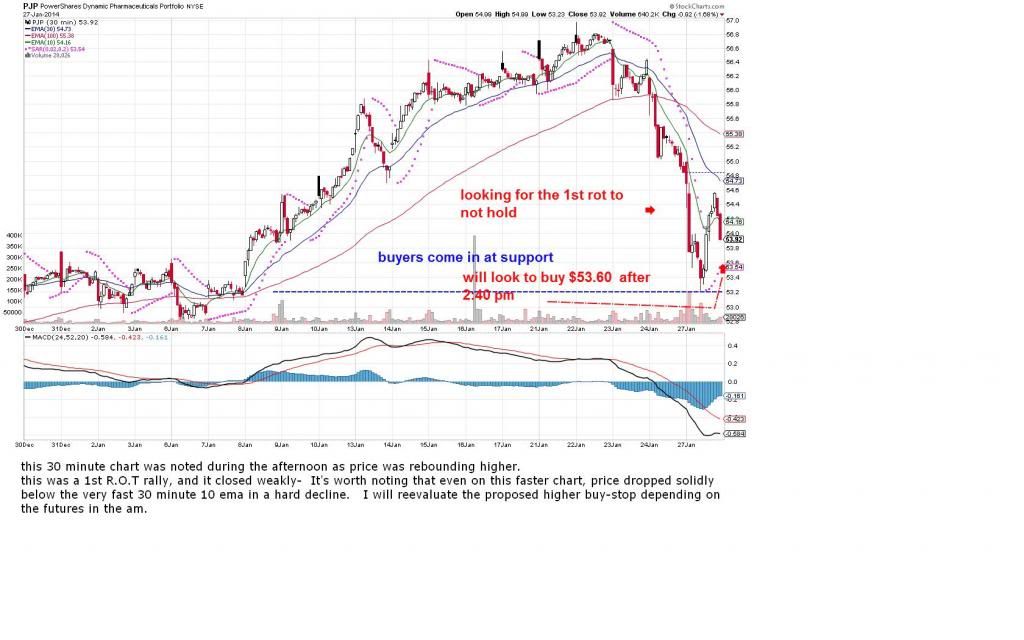 |
|
|
|
SD-2014
Jan 29, 2014 9:12:33 GMT -5
Post by sd on Jan 29, 2014 9:12:33 GMT -5
"Snowed in with a 3-5" snowfall this Wednesday" - Southeast getting a
cover of the white stuff-
I will be watching PJP,- took that partial entry position chasing price higher yesterday $54.90 near the very top of an uptrending bar I was viewing, I will not look to add to the position as the primary market looks like it's going DOWN- PJP mimics the SPY in it's decline.
I have 2 options here- setting a limit stop on the initial position, and
I will look to a lower support level with a limit order to BUY substantially cheaper. I have set orders $51.20 & $46.50 should a major spike in selling give a mini flash lower.
futures are down again across the board-Turkey is in the news- not Greece- and em fears, China fears- AAPL dissappoints and loses $44 dollars or 8% - some 3-4% losses overseas.
This may be the long awaited market correction. let's see if things drop 5% more.
I will also look at DTN for a drop- major market spike lower .
|
|
|
|
SD-2014
Jan 29, 2014 10:33:19 GMT -5
Post by sd on Jan 29, 2014 10:33:19 GMT -5
My first technical loss in PJP based on my 'early' entry chasing price. It was a small entry position using the remaining free cash- of 19 shares. Loss of $.50 on the $54.50 stop, $54.40 limit order. filled at the limit. Technically, pjp had crossed above the declining ema, but had not closed above the declining psar value- as noted in prior post- I was watching this in real time and saw the bounce off the support level- An aggressive trader would have taken that first bounce as an entry signal, getting into the trade much earlier and at a smaller Risk % if the trade failed. However, aggressive comes at a price- with the broad market weak, it suggests a less than aggressive approach. Here is the chart for the morning's 1st hour- The opening bar has changed from a solid red bar now to a bullish candle- We'll see what occurs later in the day- I have several much lower limit orders waiting - but the market decline is controlled and not panicking- waiting on the FED this pm. 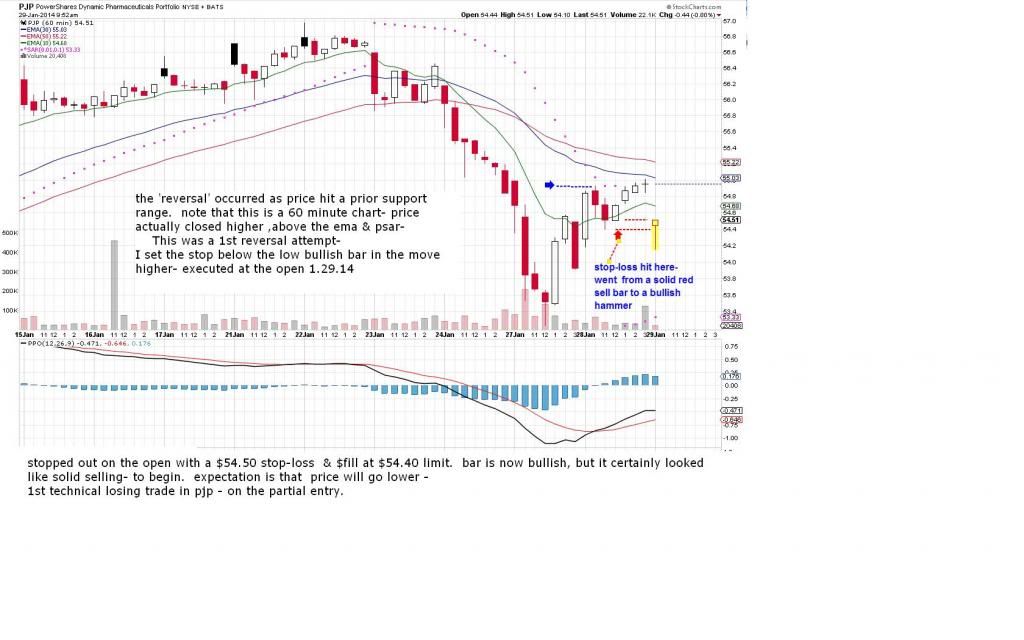 THE DAILY CHART- PRICE IS HOLDING SO FAR pRICE ACTION IS STILL weak, and declining under the ema's- My supposition is that price will still have some further downside with overall market weakness- A drop back into the prior support level is a good possibility if the market does not find a reason to rally thanks to the Fed. Market is again choosing to react to outside concerns as having potential major importance- "Turkey" for example- 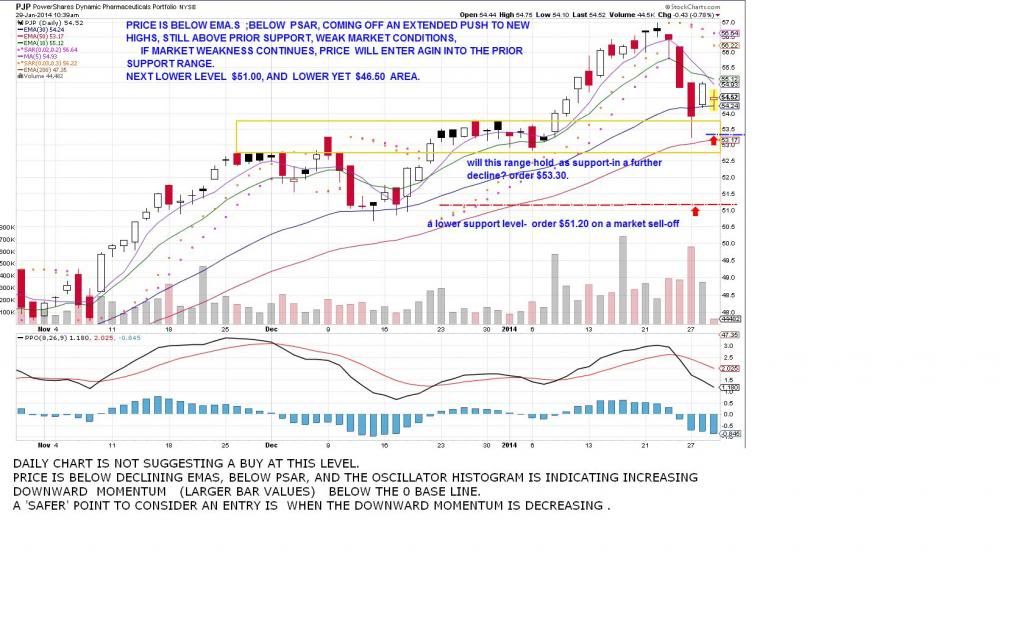 |
|
|
|
SD-2014
Jan 29, 2014 18:34:16 GMT -5
Post by sd on Jan 29, 2014 18:34:16 GMT -5
An interesting day- Markets were weak, and have been, and were waiting on the 2 pm Fed announcement of their taper policy-
The Fed said they would reduce purchases- the Taper continues lower-
TLT had an immediate major spike higher, but I think the price action in some other names is essentially troubling for stocks going forward.
Watching BRKb- it essentially digested the news and went lower for the day- It now is resting on the bottom of a multi-month low range.
After the substantial rise it had in the 1st 6 months of last year, it has gone sideways- and today went back to the bottom of a multi-month range.
I have to consider BRK/b as the white knight of fundamentalist investing, with Warren Buffet it's well documented Oracle.
One would consider that a combination of good fundamentals combined with good technicals, would support a great rationale for investing-
DTN is an ETF based on companies with some of the 'best' fundamental & technical criteria.
BRKB is at the verge of breaking a major support, and DTN closed
at the December lows.
The reaction of 'good' fundamentally based investments, supported my decision to take a short the market with an entry position in SDS.
The counter point to being short the market is that the fear of the emerging markets failing should drive investment dollars into the US Market as the safety play.
BX is a play on financials/ investment companies- If anyone is interested in financials, take a moment to compare BX. a 100% gain in 2013 is a compelling stat.
Following the Fed announcement this pm, and monitoring the reaction of 'stable' BRKB, DTN, , and seeing that as a negative, I took a small position in SDS -shorting the market-
|
|
|
|
SD-2014
Jan 30, 2014 19:00:46 GMT -5
Post by sd on Jan 30, 2014 19:00:46 GMT -5
Indeed, I got it Wrong-You should go with what you see- but you can -& should- plan for other events occurring-as well- Those just around the corner-may not be what you expect. Have to be able to think outside the box you construct.
I was busy today, and unable to access any news or internet.
I totally anticipated last night that the market's would find a reason to sell-off further- I think I've listened to the same song before..
I never saw the Futures this am, nor the market open- Even at lunch time i was tied up and failed to access the markets.
I really did not see any reason why the markets should put in a rally today- I didn't think the sell yesterday had reached any 'Climax' level-
I was expecting an opportunity to put cash to work at even lower prices.
So, Market has quickly absorbed the Taper concept and apparently feels the market can indeed stand the Taper, and things will be fine-
What was all that news about Turkey anyways?
I'll have to play the DVR and get an idea on what prompted the substantial market wide reversal . Solid GDP report?
|
|
|
|
SD-2014
Jan 31, 2014 21:28:45 GMT -5
Post by sd on Jan 31, 2014 21:28:45 GMT -5
HMM-
Not sure what has happened to the site- or the WHY?
This Friday 1-31-14 I purchased initial positions in PJP - 30 shares $54.67
1-31-14 DTN- 30 shares $66.33
|
|
|
|
SD-2014
Feb 3, 2014 15:29:27 GMT -5
Post by sd on Feb 3, 2014 15:29:27 GMT -5
I SOLD BOTH PJP, DTN FOR LOSSES AS THEY CONTINUED TO DROP IN PRICE WITH LITTLE PAUSE. I'VE ATTACHED A $.25 TRAILING STOP TO SDS- WILL SEE IF IT EXECUTES THIS REMAINING HOUR, BUT I'LL BE ON THE ROAD AT THAT TIME. THIS MAY BE A GOOD BUYING OPPORTUNITY, OR IT MAY BE 10% LOWER- WE'RE CERTAINLY LONG OVERDUE FOR A NORMAL SUBSTANTIAL CORRECTION. 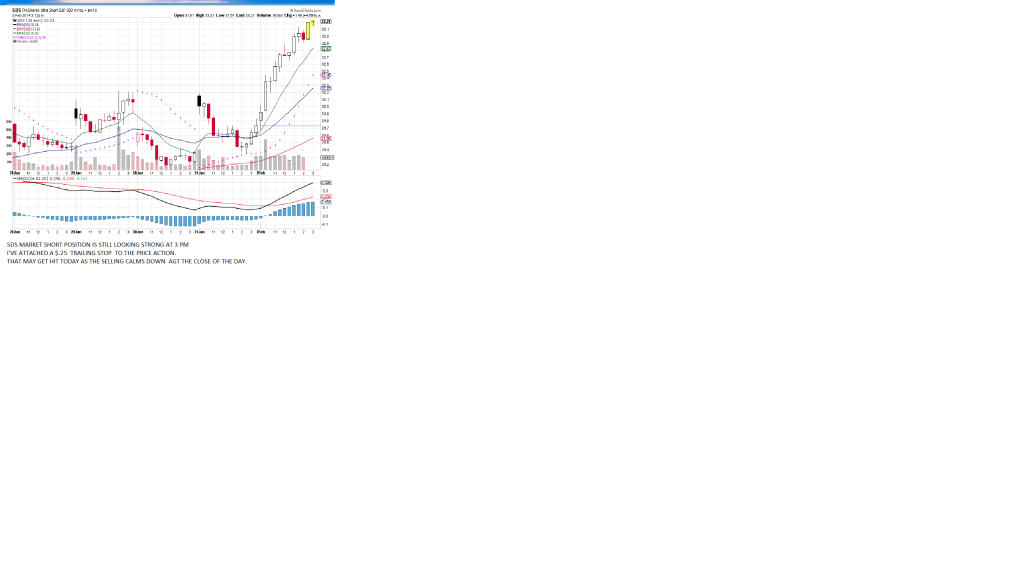 |
|
|
|
SD-2014
Feb 4, 2014 14:25:52 GMT -5
Post by sd on Feb 4, 2014 14:25:52 GMT -5
2.04.14 SDS trade stopped out on a raised stop for a small gain.As the market was trying to move higher, SDS made a dip down, then moved back up.2ND CHART. I set my stop-loss at the low of that initial dip, expecting it would be hit. It sold @ $32.80. Seeing the market was looking to rally, I reentered PJP just below yesterday's Sell, with a larger position. Following yesterday's sharp sell off, there is always the chance that today's market attempted rebound will just b e a bounce- and not have any real support- 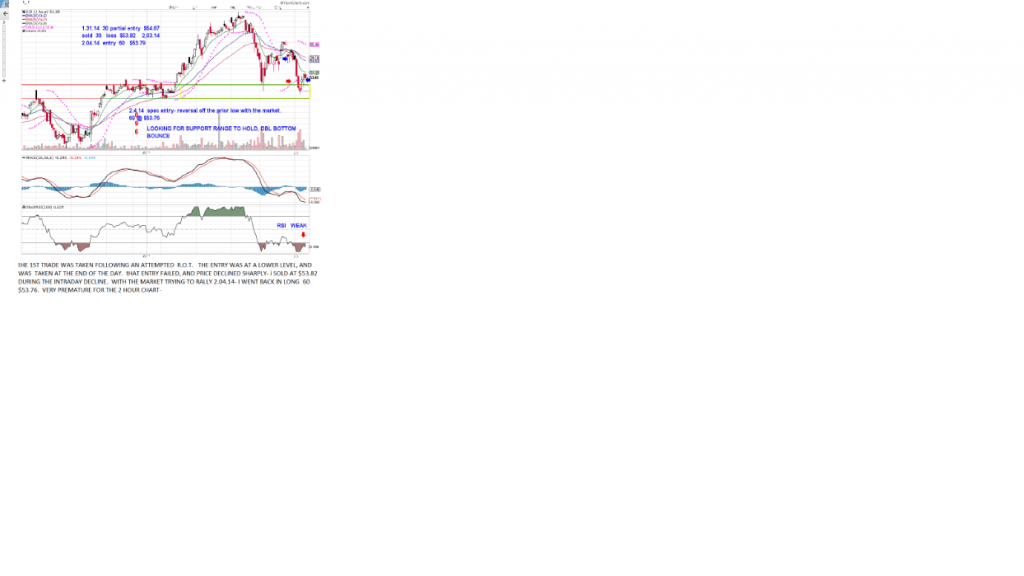 ANOTHER CHART LOOK FRM THE HOME COMPUTER 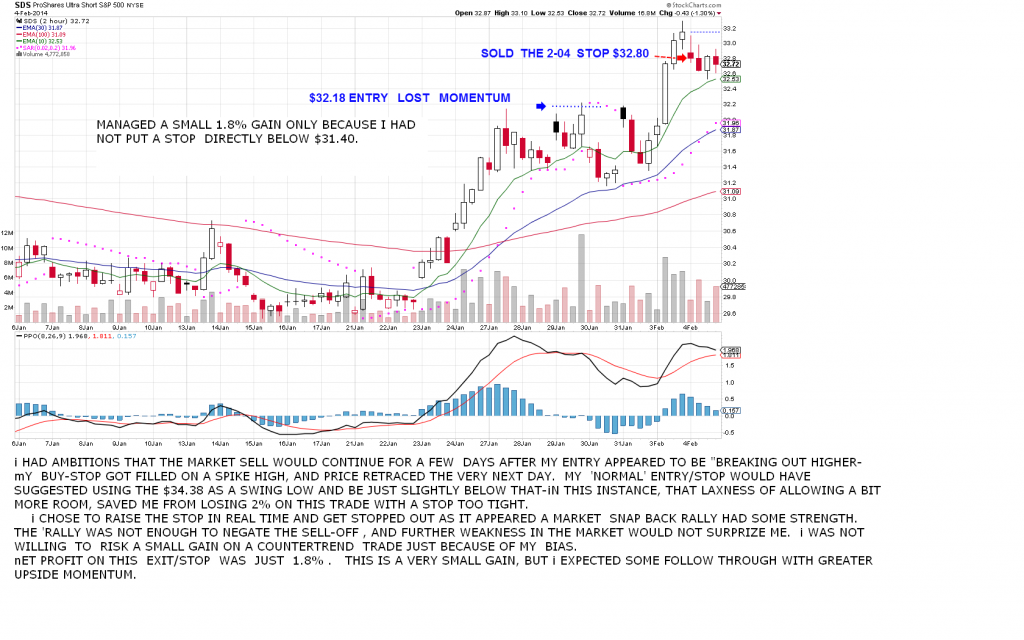 |
|
|
|
SD-2014
Jan 1, 2015 18:45:13 GMT -5
Post by sd on Jan 1, 2015 18:45:13 GMT -5
Year End 2014-
It's been an interesting year- I pulled the covers over my head and went without focusing on the market until August- held some positions without any stops- missed the August sell-off and rode it out- and was still in some of those positions and then started to get motivated again-
Overall, I have done decently- market returned 13.76% and i have a 12 + gain after expenses- with the trading account at a year high.
Healthcare sector was my primary target- made some money in multiple trades in PJP & CURE-
I held CURE long for over a month at one period- and selling my last 5 shares tomorrow I expect.
Some of my best trades were jumping in after a sell-off- Alan Farley style- "The best entry is the one closest to the point of Failure-" There is a lot of wisdom in those words. I think he borrowed that from Linda Rashke- and I came back acrossed it in a 2002 trading dvd.
and taking quick losses if a trade started to roll over - Using a fast 1-2 hour chart- and - borrowing a lot from Bankedout- having the expectation that the trade would go in my direction-and being willing to Risk more and not Fear a losing trade.
Just control the amount of Loss- #1 .
I made some bad impulse trades, but I made some very timely trades as well. I also tried to hold onto winning trades for as long as possible, legged into some winning trades- tried to capture momentum trends when they were in my favor.
I've learned a lot from the members here over the past years, and as i get ready to consider the spectre of retiring and how to manage something other than a small trading account- I think I'm inclined to drink the Vanguard Kool-Aid of low cost passive index investing as the way to go- with maintaining a small spec trading account and be willing to take some larger Risks within it- while not jeapordizing the remainder.
While trading is a great personal challenge for most of us- Even if i was to be kind- with a small trading account, even a respectable gain means the hours expended are likely well below the minimum wage- My wife actually bought me a video console -ps4 and i told her to return it as trading is more of a challenge. I actually took some other accounts larger than the trading account with IB and traded DTN on a focused approach- and will likely return to that also this year-
Costs of trading in smaller accounts are also a big impact- I took 118 trades for just $1 each this past year- I had 61 losing trades- less than a 50-50 win rate- I made 2x what I lost though thanks to the take no prisoners or losers approach- My initial return was over 16% for the 1 year, but fees and expenses cut almost 23% (4%) of the profits.
I either will need to be willing to Risk investing in higher return ETF's - to beat just the market average-
That also means a narrowed focus of investments- and not a diversified account - If trading is going to have any opportunity to 'win' against a passive index.
Thanks DG- and fellow members- Here's to everyone's success in 2015! Good Luck all! SD
|
|


