|
|
Post by sd on Nov 25, 2012 13:54:28 GMT -5
PSAR IS A VOLASTILITY INDICATOR- pARABOLIC STOP AND REVERSE- stockcharts.com/school/doku.php?id=chart_school:technical_indicators:parabolic_sar While price levels are important- it is interesting as a volatilitytype of indicator that has potential for setting entry & exits- buy-stops & trailing stop-losses. I tend to include it on my charts but don't specifically apply it, but I want to have a sense of what it is saying- In periods of sideways consolidation, it will usually generate a sell signal- in this example, it could be used as a level to place and hold a stop-loss, and to consider an additional entry above the decling psar values with a buy-stop entry. i would tend to hold back 1 p.sar dot - and really want to analyze the formation against what the chart is saying- In this example- psar did a good job of capturing a lot of the move until being stopped out on the roll over. had i adjusted my actual trade using psar, i would have been stopped out a day earlier & at a higher price. stockcharts.com/school/doku.php?id=chart_school:technical_indicators:parabolic_sar |
|
|
|
Post by sd on Nov 25, 2012 14:52:24 GMT -5
In and of themselves, moving averages do no provide "support" or resistance except where the market technicinans deem it significant- and only that is transitory-IMO The best support levels are where price has been established and had some buying and selling and consolidation. Moving averages are indeed lagging indicators- they are graphic training wheels to quickly spot trend and consolidation, and momentum- strength, as well as weakness- in summary, they average out the individual price action, and perhaps are useful in keeping the wider perspective for me vs the immediate group of bars themselves. They are not necessary per se- but I find them useful in assessing where price is relative to where it has been- price dropping below the moving average is a clear warning shot to pay attention- momentum is slowing or reversing- 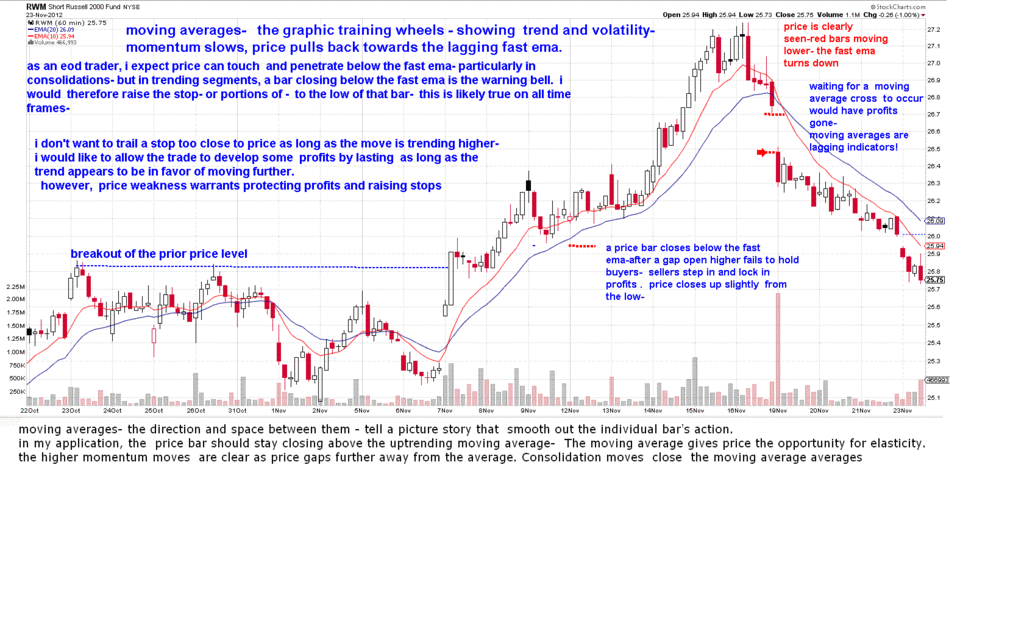 |
|
|
|
Post by sd on Nov 25, 2012 16:47:06 GMT -5
AS ONE FINDS A WAY TO TRADE AND MAKE ADJUSTMENTS TO STOPS PERIODICALLY, ONE CAN TEND TO TAKE PROFITS TOO QUICKLY OR ON SOME MINOR PULLBACK, ONLY TO SEE THE TRADE GO HIGHER WITHOUT THEM, ONE WILL HAVE WHIPSAWS IN TRADING- ONE FACTOR IN TRADING IS UNDERSTANDING THE "NORMAL VOLATILITY" OR AVERAGE TRUE RANGE OF THE PRICE ACTION- THE RENKO CHART ESTABLISHES THE "NORMAL VOLATILITY " RANGE OF PRICE- IT CAN BE ADAPTED TO THE ATR OR TO A SPECIFC PRICE MOVE stockcharts.com/school/doku.php?id=chart_school:chart_analysis:renko I'm not sure if the Renko chart is suitable for all time frames- or my short term trading. I think it is worth further study- particularly since it clears out a lot of noise- future post trade analysis may prove interesting- In my present trades, I will see if my stop-loss is within the renko parameters. 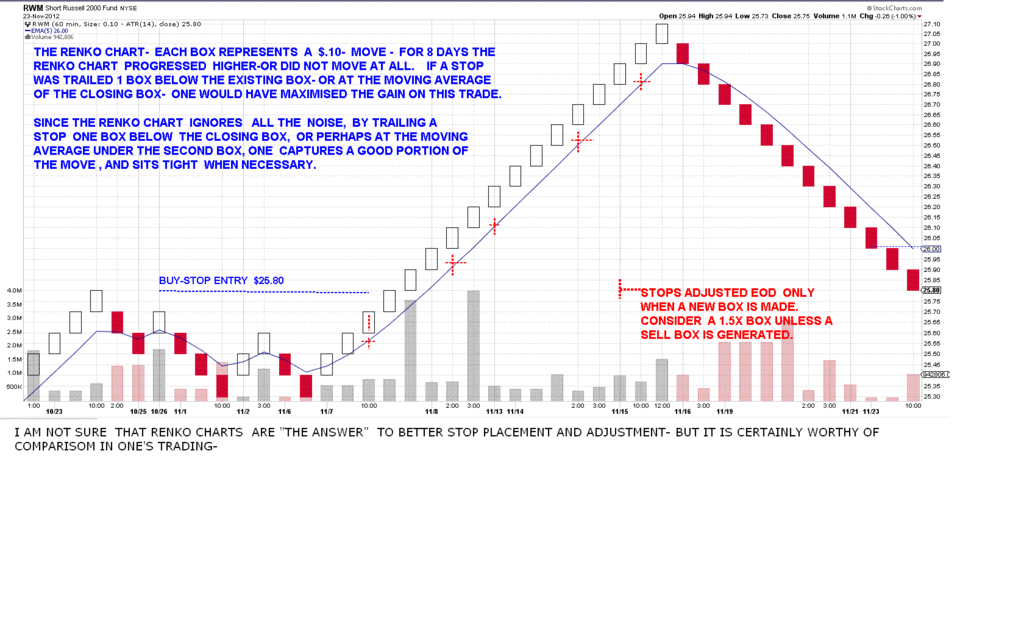 |
|
|
|
Post by sd on Nov 25, 2012 17:11:03 GMT -5
THE RWM LONG TRADE WAS A SUCCESSFUL TRADE- BUT ALSO A DISAPPOINTMENT some Aspects.
The elements that made it a success:
This trade- going LONG when the prevailing trend seems to have turned and was in the same direction, with a gradual slightly higher channel move in play.
I was seeking a momentum "breakout trade" , above the recent trend/price high. I felt the elements were there for that to happen with the larger market condition a major factor-
That breakout did occur, and I had a full position on the entry-
I felt I needed to be willing to take on more Risk, and adding size early is one method.
I then added additional Risk by adding a buy stop order for the next day- which was successfully fillED- this was based on viewing the eod closing price action, and concluding that the
buy-stop was a decent risk.
The following day, i was at the computer in real time as the trade started to pullback- and perhaps that was the biggest drawback because I responded to price action going negative in real-time-
As price retraced my add on trade level- I cut the trade by selling 1/2 on the weakness- as price dropped below the moving average. My desire was to not allow the added portion of the trade to go negative.
Price then broke out of a sideways consolidation- and moved higher.
IF I had not been trading real time to react to the pullback, as an EOD trader, I would have had to raise the stop-loss to the low of sell bar. Had i kept that stop-loss through the consolidation, I would have been in an overweight position when the trade eventually stops out. That would have doubled the actual profit of the trade.
The actual final stop-loss of the trade was to set a stop-loss on a bar that closed below the fast ema-
If I was trading in real time- that would have had an exit of $26.90 -exiting from a $27.20 pullback open on 11-16.
As an EOD trader- I had no recourse - the stop was set just below the low- and I had to take the gap lower fill the next day
$26.46. That turned out to be the right sell point as price subsequently heads even lower- back into the channel.
Where the trade was potentially lacking, and could have been improved, was by having a limited sell target for an initial part of the trade- Let's assume a % factor- perhaps 4-5% to sell 1/3 or 1/2 of the trade.
That would allow 2/3 or 1/2 of the trade to continue, locking in a portion in profits-.
While closing out the RWM trade, I realized that my RISK aversion to loss also makes me focus on more "secure" trades-
The minimal gain / profit for the amount at Risk has yielded a small return- WHY not RISK more?
I don't want the "RISK" to be wide stop-losses-on conventional trades- I think a lot of traders apply that approach.
I have decided I will take some leveraged plays, and will try my hand at following these trades with the appropriate stop being raised EOD-
The scary part of leverage is that I have gained 2% in port value this week on 2 trades- The other side of that - is that I could have lost 4% of port value had the trades gone in the wrong direction.
time to make some stop-loss and target sells for tomorrow's open-
|
|
|
|
Post by sd on Nov 25, 2012 19:38:22 GMT -5
the AGQ trade has gained - and is showing a nice profit-
The Renko box is $0.55 and the present box is $55.55.
Price closed @ $56.04- the stop will be $55.00.
I will be selling 2/3 of the position at the open @ mkt-hoping for a spike higher- open. THIS IS SIMPLY LOCKING IN SOME PROFITS-
The TNA position- $48.90 STOP-LOSS renko
FAS 106.00 STOP-
|
|
|
|
Post by sd on Nov 27, 2012 21:10:19 GMT -5
tHE FUTURES were all down when I headed for work @ 6 am. When I got home this pm, the indexes were all lower- As I listen to a replay today, it appears the market started off higher from the open, but concerns about the fiscal cliff and lack of concilliation between the parties became the "issue'. I was holding 4 positions this am- The FAS trade had shown weakness previously, and was slightly negative- I raised the stop-loss to $106.00 , and got taken out in the opening hour- Price closed lower , filling the previous gap up and closing lower- $104.54- A very good exit- with a -$13.00 loss on a $1,000 in trade on the tenative entry- Yes, That noise is me giving myself an atta-boy for getting smart and proactive in closing the stop-loss. I added to both TQQQ and TNA with Buy-Stop entries- which meant that price had to move higher in order to be filled. Both trades filled, and prices initially moved up and then decayed during the day , closing lower . I had thought TNA looked very strong at the close, with a higher closing bar, although there was overhead resistance @ $56.00 , I still thought the trade was worthwhile- liking the chart price action. My intention was to simply use the $56.00 level to set as a target , and sell 1/2 the position or so- I waffled in the end, thinking that if the "news" was bullish, the stock could blow past higher- As it turns out, the stock moved up, Buy-stop entry was filled- Stock hit the $56.00 level on the nose several times, and ended closing lower. Woulda-Coulda- Shoulda @ $56.00- at least 1/2 - Now, I'm very overweight and could potentially see a large gap lower to really smack me down- This is the type of market environment where one has to be a short term tactical trader- or sit in cash- President Obama is due to speak tomorrow- 11:30- Harry Reid spoke today disappointed- and the markets dropped lower- The take away from all this, is that we are unable to make an informed decision because there is no agreement- Therefore, we are at the mercy of the fluctuations on the market's daily interpretation of what "may occur" - The market is guessing the probabilities- And wants to see the fiscal cliff avoided at all costs- Even as short term trades, we expect a move to last for a period of time- If something is good today, how can it be bad tomorrow? It's all about the market's expectations & interpretations at this point- For longer term trades & investments- the "fiscal cliff" resolution is unknown The market will react strongly- one way or the other- up or down- on the pending resolution or lack of. Let's assume there will be a 10% move - in either direction- and then the market will figure out what the outcome really means and will grind out an assessment- in the days and weeks that follow- Things that really matter- like earnings and such- will once again become of substance. I think we trade tactically in the short term-If at all- The only way to trade in 3-5 day moves- IMO- is to capture an entry early on a trending move shift - and at a net narrow loss- We could muddle around, and not get a tradable response from an undecided market- The VIX is near historic lows- Therefore, I think we should see an opportunity for some basing action and not a sharp V- because all the news we react to will be open to interpretation.  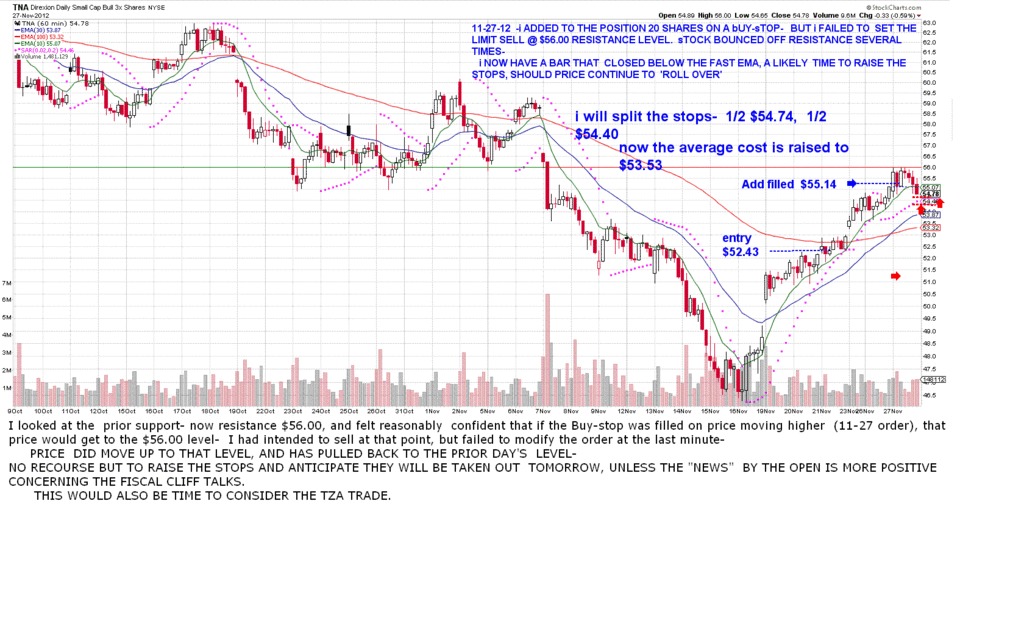 |
|
|
|
Post by sd on Nov 27, 2012 21:32:06 GMT -5
TZA had a lot of positive volume-
Borrowing bankedout's method of following price lower and getting a reversal-
The positive volume is the first sign , along with the $15.70 sideways base.
The Renko chart tells me that a 1 box ATR is $.20
iF i APPLY A 2 BOX TRAILING STOP- $.40 along with a buy stop entry - and compare that to the hourly chart-
It suggests an entry Buy-stop of $16.22 with a stop loss @ $15.78 or 2.7%.
I will place this order -exploratory- with just 30 shares and see how it works out- If I lose, it should cost me $15.00 - $20.00
(I'm also spending $5 on a power ball ticket ) and it will be interesting to see what occurs-
SD
Unable to place this order- waiting on pending cash to clear-
|
|
|
|
Post by sd on Nov 28, 2012 18:52:51 GMT -5
Today I was stopped out for net losses on all positions- Technically I lost $73.00 , but I gave up 2x that as a possible profit- Haven't viewed the charts yet- 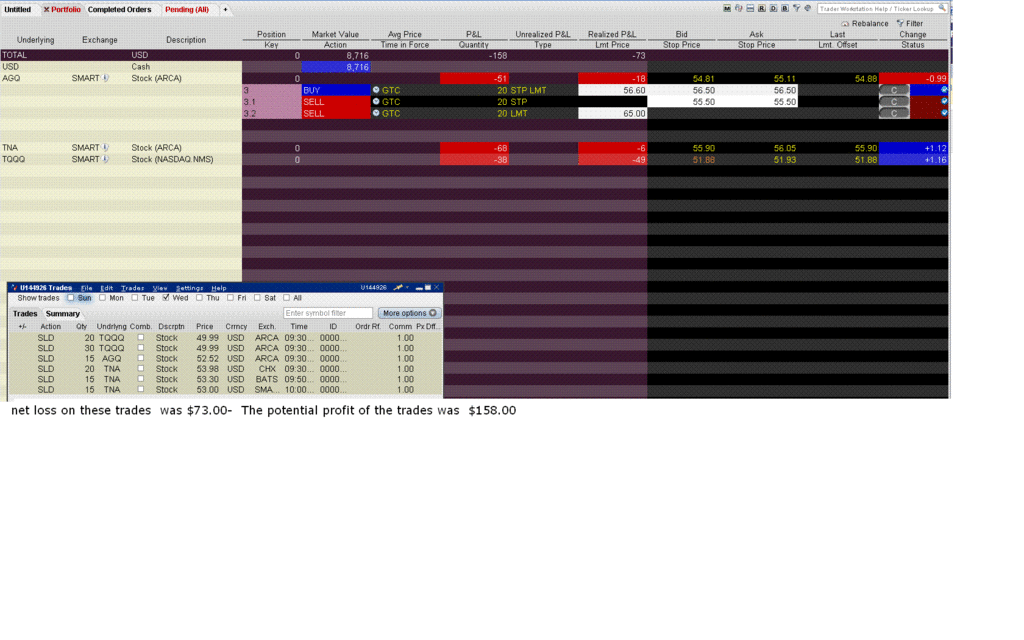 |
|
|
|
Post by sd on Nov 28, 2012 19:25:52 GMT -5
tHE PROFITS SURE LOOKED GOOD WHEN IT WAS CLIMBING UP! I did sell part of this as it moved up and gined some $60 or so on the trade, but then I added back some 10 shares at a higher level- I knew the volatility potential and reactivity to "news" when I took the chance on these trades- As a general "Rule", I view any bar that closes below the fast ema as a good reason to raise a stop to the low of that bar- I got that red bar yesterday, and raised the stop accordingly- It didn't do much good to l;ock in some profits as the open gapped down over $3.50 lower from the close and below my net entry. Taking profits earlier - say @ 5%-on 1/2 should be a practice going forward. SD 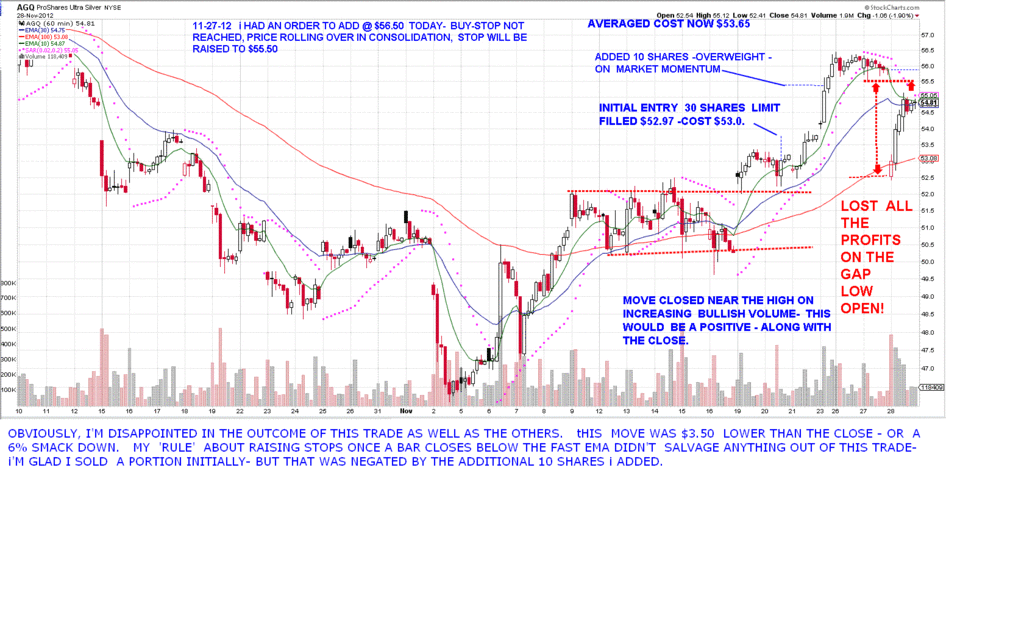 |
|
|
|
Post by sd on Nov 28, 2012 19:53:25 GMT -5
tHE RENKO CHART USED AS A GUAGE TO BE OUTSIDE OF AVERAGE VOLATILITY WOULD NOT HAVE MADE ANY DIFFERENCE IN THIS PRICE GAP DOWN . i ALSO FIND THAT THE RENKO CHART DID NOT GENERATE THE 4TH BOX BASED ON $.65 SIZE BOXES- PRICE CLEARLY OPENED BELOW A 4TH BOX LEVEL IF MY MATH IS CORRECT- 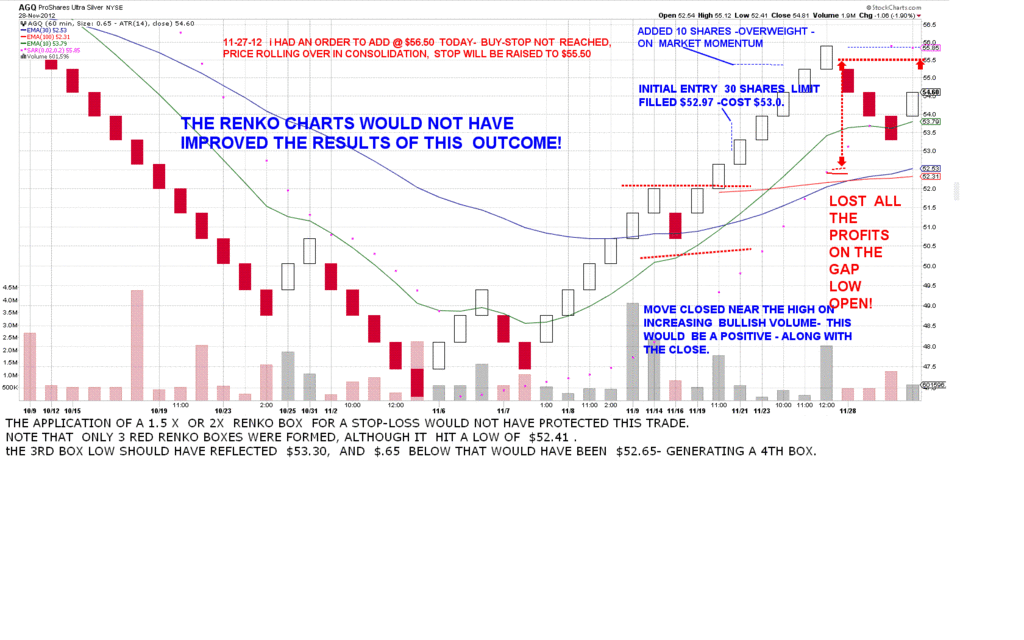 |
|
|
|
Post by sd on Nov 28, 2012 20:19:55 GMT -5
TNA Gaps down lower at the open , hitting all of my staggered stops- The market then rallies on comments by Rep Baynor that some tax increases are indeed on the table- I'm out of cash at the moment, unless I see a clearance overnight- I'm not able to make any moves in the trading account- I believe that the probabilities are in favor of an agreement to reconcile the differences- perhaps a post ponement of the fiscal cliff- The market will rally higher-on such news- If I had free cash, I'd be a buyer of TNA on a higher move tomorrow. SD 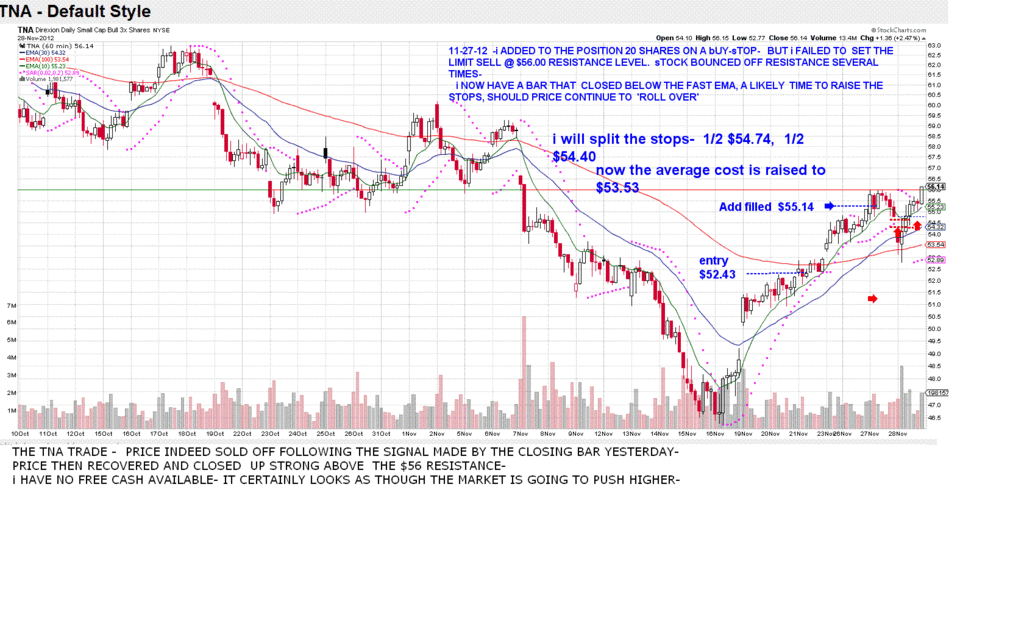 |
|
|
|
Post by bankedout on Nov 28, 2012 22:35:54 GMT -5
And that is what makes a market. Because I would be interested in selling you your shares  |
|
|
|
Post by sd on Nov 29, 2012 21:00:18 GMT -5
lol, aND i'D HAVE TO BE A bUYER ! I have to go with the momentum direction- and it appears to be wanting to struggle higher- The market is wanting to be optimistic here-
This is indeed what makes a market- The amount that one is willing to Risk in order to be correct in one's assumption of which way the wind should be blowing tomorrow is indeed a delicate balance-
As I checked my account balance today to see if any trades had cleared, I found I had purchased 20 shares of AGQ @ $56.50 buy-stop - This trade has a $55.50 stop-loss- and I will allow it to remain intact.
The reality of what is occurring is that this is a highly news attuned market- and no one is assured of the direction of the end outcome.
While I am skeptical, the trend is still to the upside as the market is trying to be optimistic- Unfortunately for my recent trades, this does not come without indecision & price volatility-
Oddly enough , the $vxx does not view this present action as volatile-
This is a learning experience to try to trade & profit-
I expect that I will try to be quicker on the trigger in the future, and sell some shares back! LOL, Good Luck, Sd
|
|
|
|
Post by sd on Dec 3, 2012 20:38:25 GMT -5
Last week's action took the wind out of my sails-
The politicians are still in strong debate about the fiscal cliff-
The VXX has been in a steady decline, and is presently sideways, with a possible rise-
Crap, it's all about market interpretation of the politics- is it not?
Any directional trade can be manipulated by whichever speaker gets the headlines of the day-
Presently, it sounds as though the Rep & Dem's are agreeing to disagree-
and a potential large move up if a "settlement" is hinted at, and a lower low if the market determines an impasse.
Presently, we are trading sideways- non-directionally- and this is not where i want to take sides on- It's like betting on Black or Red.....I would tend to favor a lower market due to an impasse and a Fall off the Cliff- But that is my Bias about what is likely to occur-
SD
|
|
|
|
Post by sd on Dec 12, 2012 19:34:47 GMT -5
The intraday reversal of price action today convinced me to sell the position as price moved from being in profitible territory towards negative- I think this must have been prompted by Bernake @ 2 pm . From a chart standpoint, a test of the gap could be anticipated, and if I had not made the higher add to the trade I could have considered riding that pullback out- Buit it looked like such a sharp move down, I chose to bail out. The trade ended up costing $3 I started off this trade determined to allow some additional volatility, but the reality of seeing the profits go back to 0 caused me to think this would go down even further- So , perhaps we'll try it again another day-SD 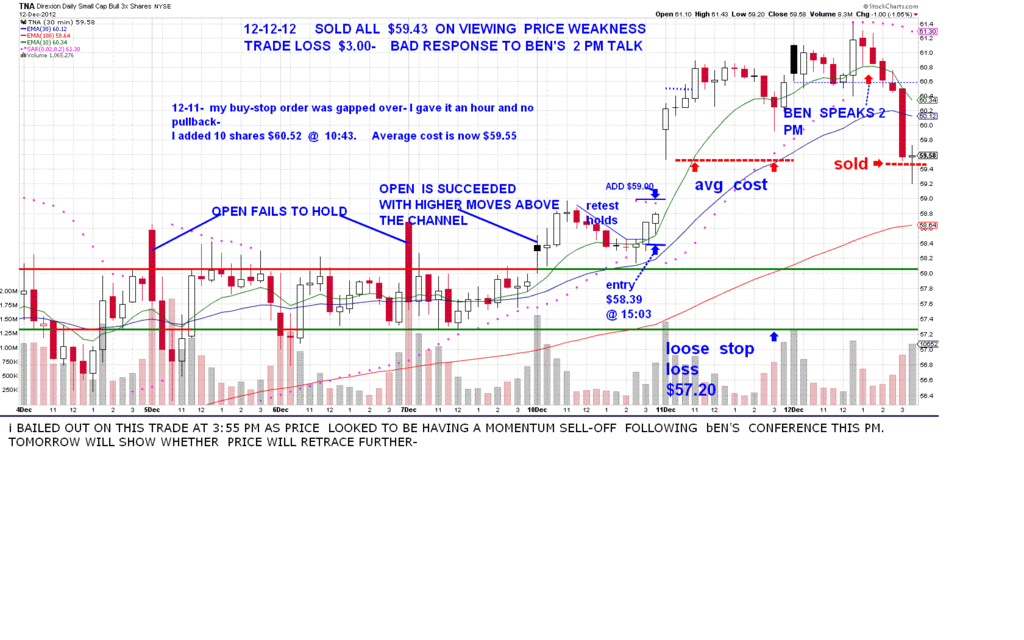 |
|