|
|
Post by sd on May 31, 2011 20:05:07 GMT -5
Mini Flash Crash- A fellow trader mentioned that mini flash crashes still occur-
Look at QCOM today 5-31-11 on a 1 minute chart at 3.50 pm where price dropped from $58.40 to $54.50 for 1 minute only and then back higher-
This is not some easily manipulated stock with 15 m shares traded - And if one had a position with a reasonable stop , you'd have been taken out on the 60 second spike-
This is not a level playing field boys and girls.
SD
|
|
|
|
Post by sd on Jun 1, 2011 18:37:33 GMT -5
I got caught today in a sell-it market with my going long a few positions hitting my buy-stop at the open and turning directly South and hitting my stop-losses. S&P gave up 2.3% and I lost 1.5 on 4 trades I entered into today, not anticipating this sell-off. After yesterdays spike low of QCOM, I figured it would be a good time to go long figuring market manipulation of some design was responsible for the sharp spike down, and someone was looking to pick up shares by taking out stops. I put in a buy-stop for QCOM and was filled $58.72 at the open, and stopped out .Chart attached - Note the flash crash moment on 5-31. I also went long a solar and Nat gas play LDK and FCG partly on the news from Germany that they were considering shutting down their nuclear industry. Both trades came off the open higher to catch my buy-stop but immediately rolled over with the market. I also had a SLV position stop-out , while my UGL (gold ultra) gained some. This takes my account down to $10,039.00, and the only regret I have is that I gave a little wider stop than normal on my entries feeling the market was fairly benign and expecting some follow through to yesterday's market move higher. I actually thought Silver would again work as a 'safe'commodity trade and move directionally with Gold but such is not occurring here. On my recent reentry in UGL, I accidentally took a 2x+ overweight position $4,000 and pushed the stop to B.E. on that 1/2 and was taken out. My other 1/2 position came with in $.04 of getting stopped. The VXX signaled a change in direction , and I am intending to put a buy-stop on VXX $22.75 limit $22.80 stop $22.07 on a partial 50 share trade. only looking for a 1-2 day move though. Perhaps I should have been content to sit aside ! Good Luck -SD QCOM chart 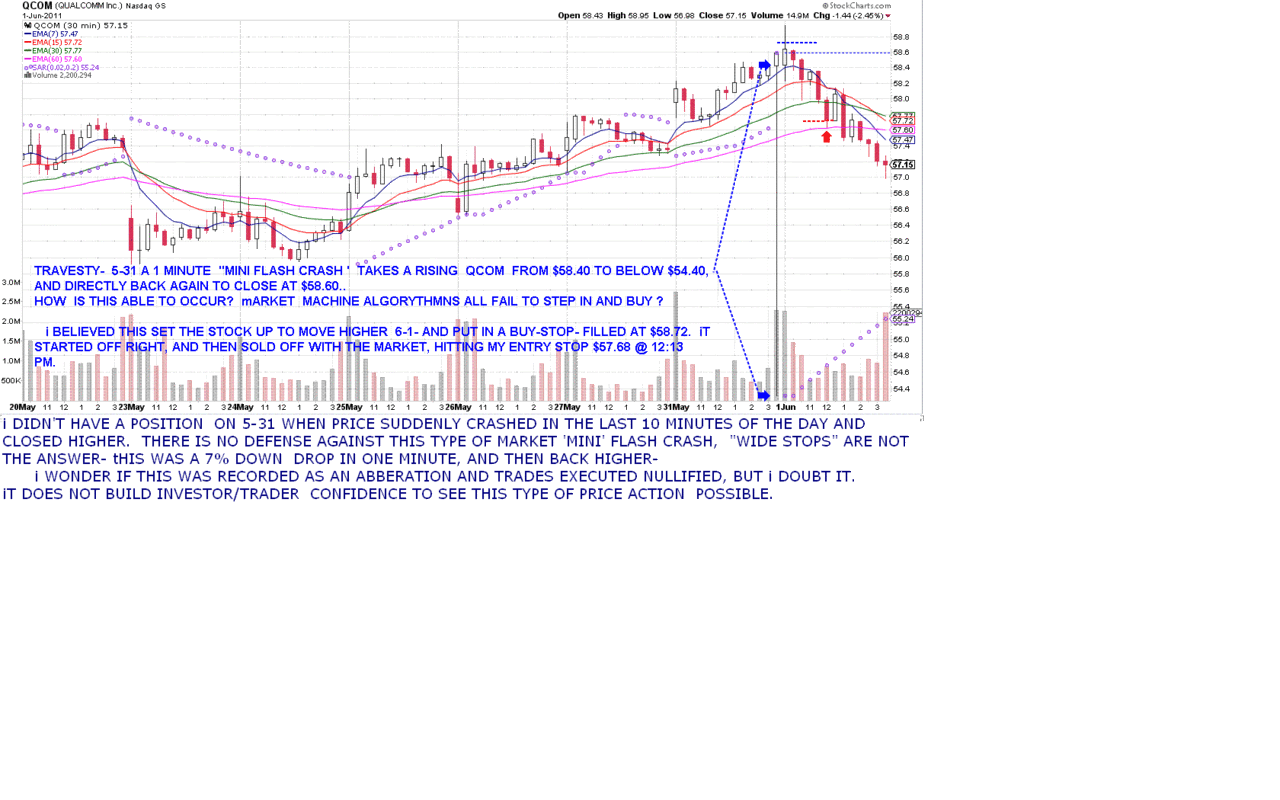 |
|
|
|
Post by sd on Jun 3, 2011 19:57:07 GMT -5
Friday- 6-03-11
UGL managed to gain as the market sold off again. This makes the 5th week in a row the market closes the week lower according to the talking heads. Jobs report today was dismal.
I had taken a VXX position this week expecting price volatility to spike higher as some fear should logically creep into the market. My entry cost was $22.76 and while the VXX spiked to $23.32 at the open, it closed down $1 less. $22.27. This bad jobs number was absorbed after an initial market open reaction. It had a low of $22.08 and my stop was $22.07. This price action tells me my thesis for this trade is likely wrong, and I will raise my stop- using the 15 minute chart $22.15 Sar level.
I also added a 1/2 position JJC at the close as it moved higher.
This is a copper ETN that appears to have bottomed 2 weeks ago. Not a lot of conviction on this trade- I found it odd that it - a commodity- was closing higher on a bad day and bot it at the close.
I'm not pushing to make a lot of trades these days, just keeping a toe in the waters- SD
|
|
|
|
Post by sd on Jun 8, 2011 20:21:04 GMT -5
6-08-2011 I'm getting slowly chewed up here, with the jjc and Vxx both stopping out for "small" losses. I've raised my net profitable Gold trade with the ULTRA UGL stop to $80.34 which is the 100 ema on the 60 minute, and keeps the trade in profitable territory. Also gives it as much wiggle room as i can stand. I thought a Gold trade would naturally be a gaining trade as a "flight" to safety as the market weakens. That premise is obviously limited and flawed, and not necessarily a direct corellation- Sheesh, Why can't this trading stuff be that transparent?  Also need to factor in the US Dollar. and the rest of the world economies. On Cnbc.com video, Jim Rodgers today with Maria makes points against the US fiscal policy and Bernake as heading down a long-term downward spiral that cannot bew sustained. It would appear that the market direction is down the past 5 weeks, , and that would be the safest way to position one's trades- SD |
|
|
|
Post by sd on Jun 20, 2011 20:23:54 GMT -5
6-20-2011 I've been essentially on the sidelines with my recent trade attempts only accumulating in the loss category. With the majority of stocks giving back some gains these past weeks, when is it time to 'Buy' ? With a few days of the market finally trying to scratch out some gains, Cat has presented an initial potential change in downtrend. This change is tenative, and appears to be testing both the downtrend line and recent support turned resistance. I'm going to approach this with a trade that requires price to exceed those levels , pushing beyond the downtrend and resistance . I'm also realizing this is a bet on a change in trend, and wanting to reduce the position loss more than being proved right, I will have a $2.25 stop- on this trade. SD 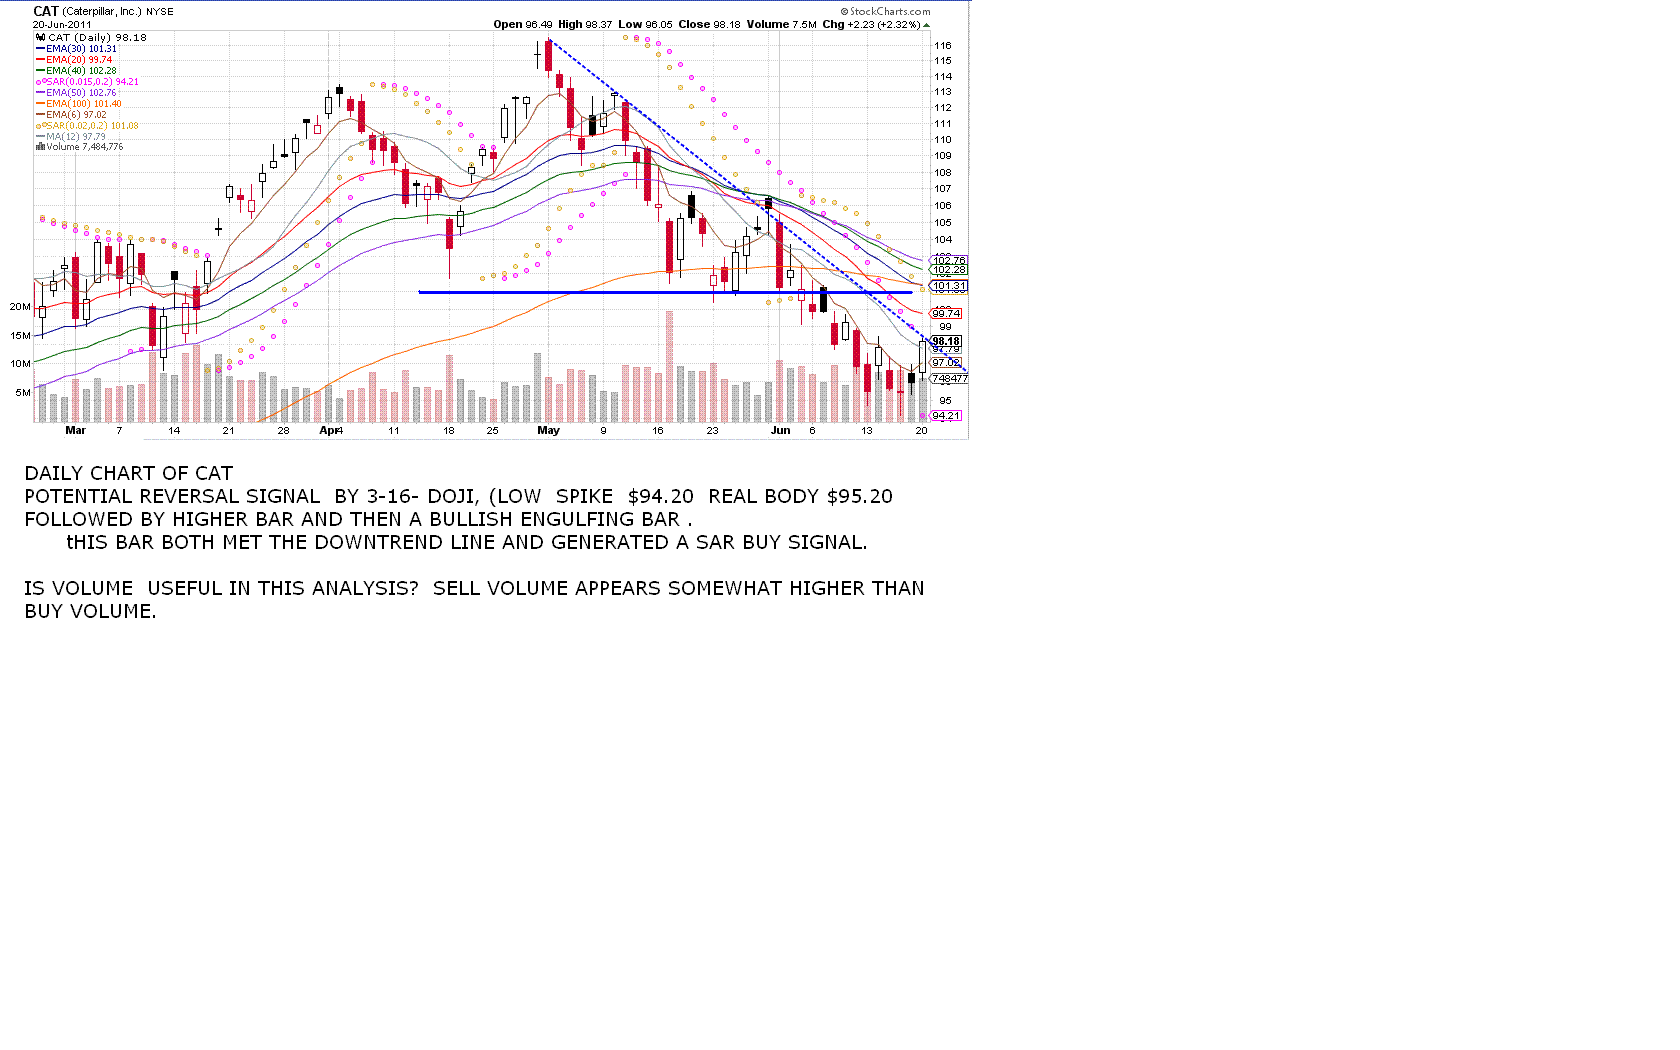 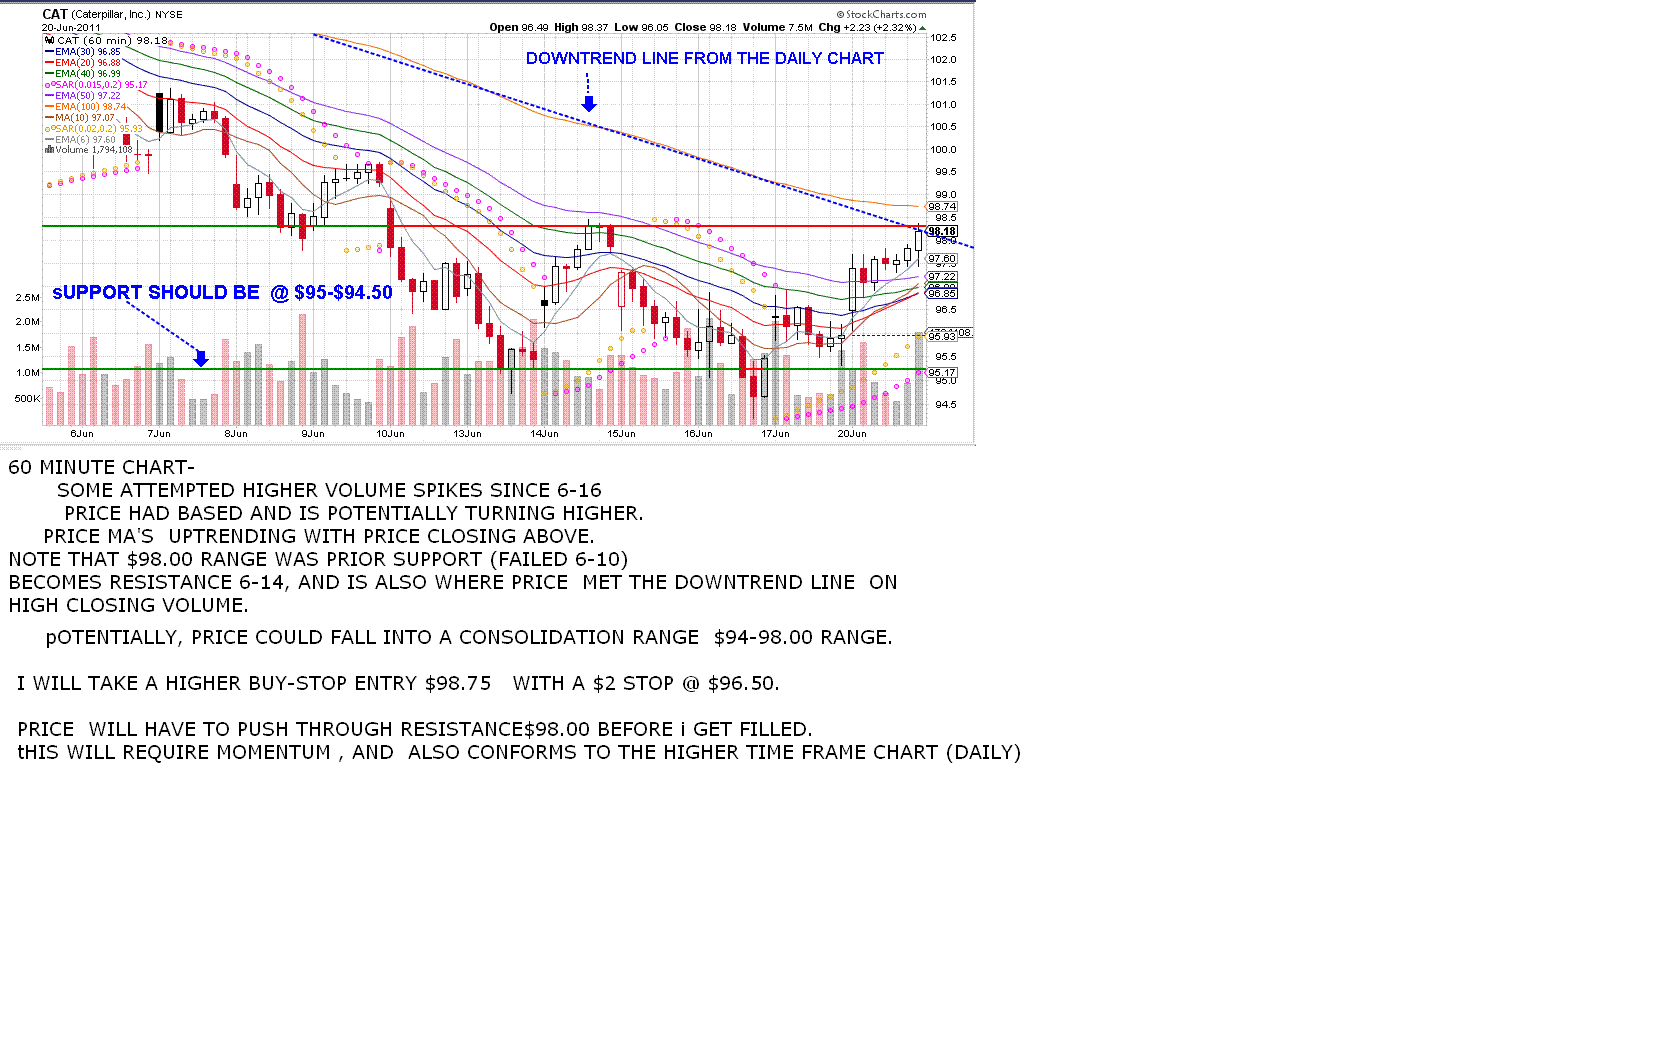 |
|
|
|
Post by sd on Jun 22, 2011 19:43:07 GMT -5
Follow up of the proposed CAT trade- Tuesday Cat did indeed move higher, but gapped above my buy-stop/limit . Today (not on chart) saw some weakness in the price as the larger market was weak. I would assume at this point that the broken resistance level & prior downtrend line should offer some support- That is the premise to watch technically as today's market sold off slightly an 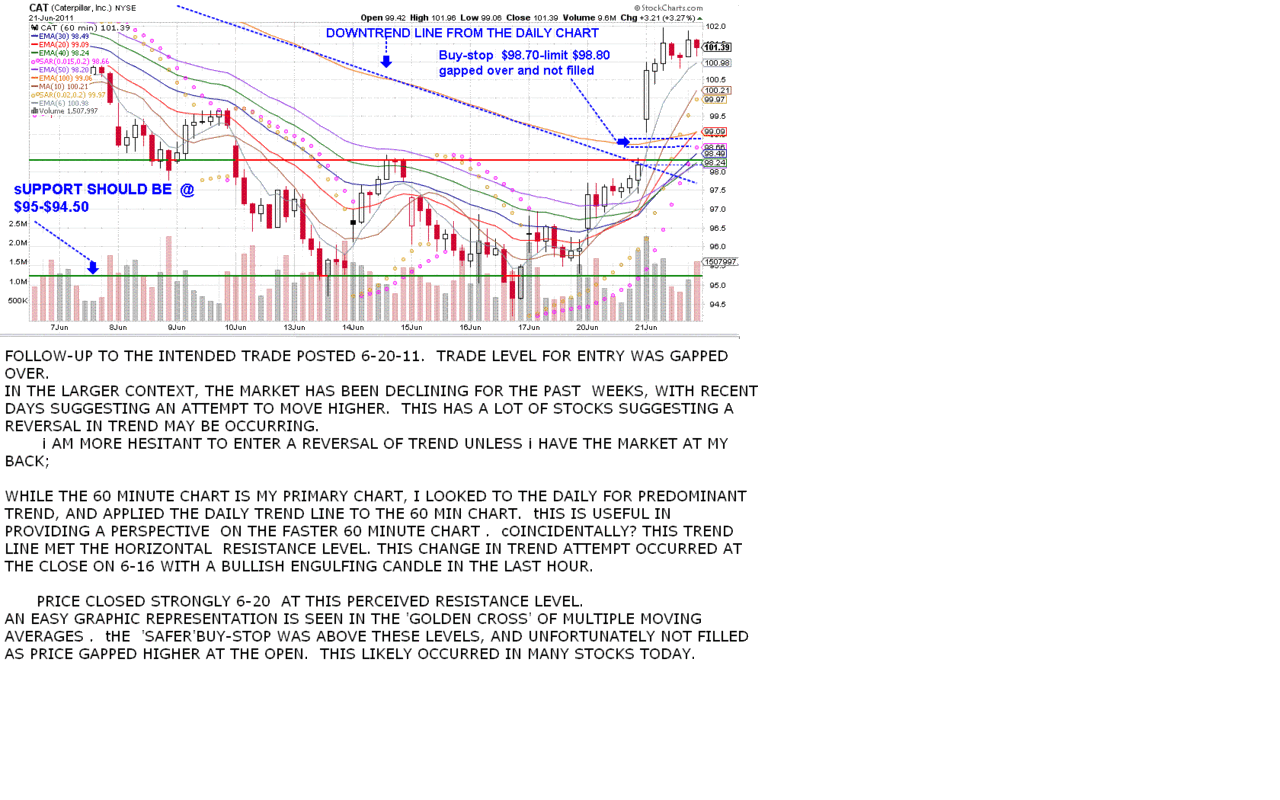 d Cat's price action was also weak. |
|
|
|
Post by sd on Jun 22, 2011 21:15:47 GMT -5
Market was down today and the Cat price action showed weakness. The concept of getting filled on a momentum move higher /breakout is totally different than allowing an order that gets gapped over getting filled on a pullback due to market weakness. Therefore, I need to adjust the trade . In this case , I hope to see momentum in the UP direction. I will change the potential buy-stop higher per the attached chart. Following this trade not because I'm a huge Cat believer, it may prove to be a good generic trade on the expectation of a market reversal and price action. Dave Landry -author - uses this pullback and higher buy-stop as a basic confirmation technique to enter a trade. I believe he focuses on a daily chart for swing trades, Sort of a 1-higher-2 pullback-3 higher and fill on a break of the higher level . I'll follow this and raise the buy-stop and the stop-loss on this illustrative trade. SD 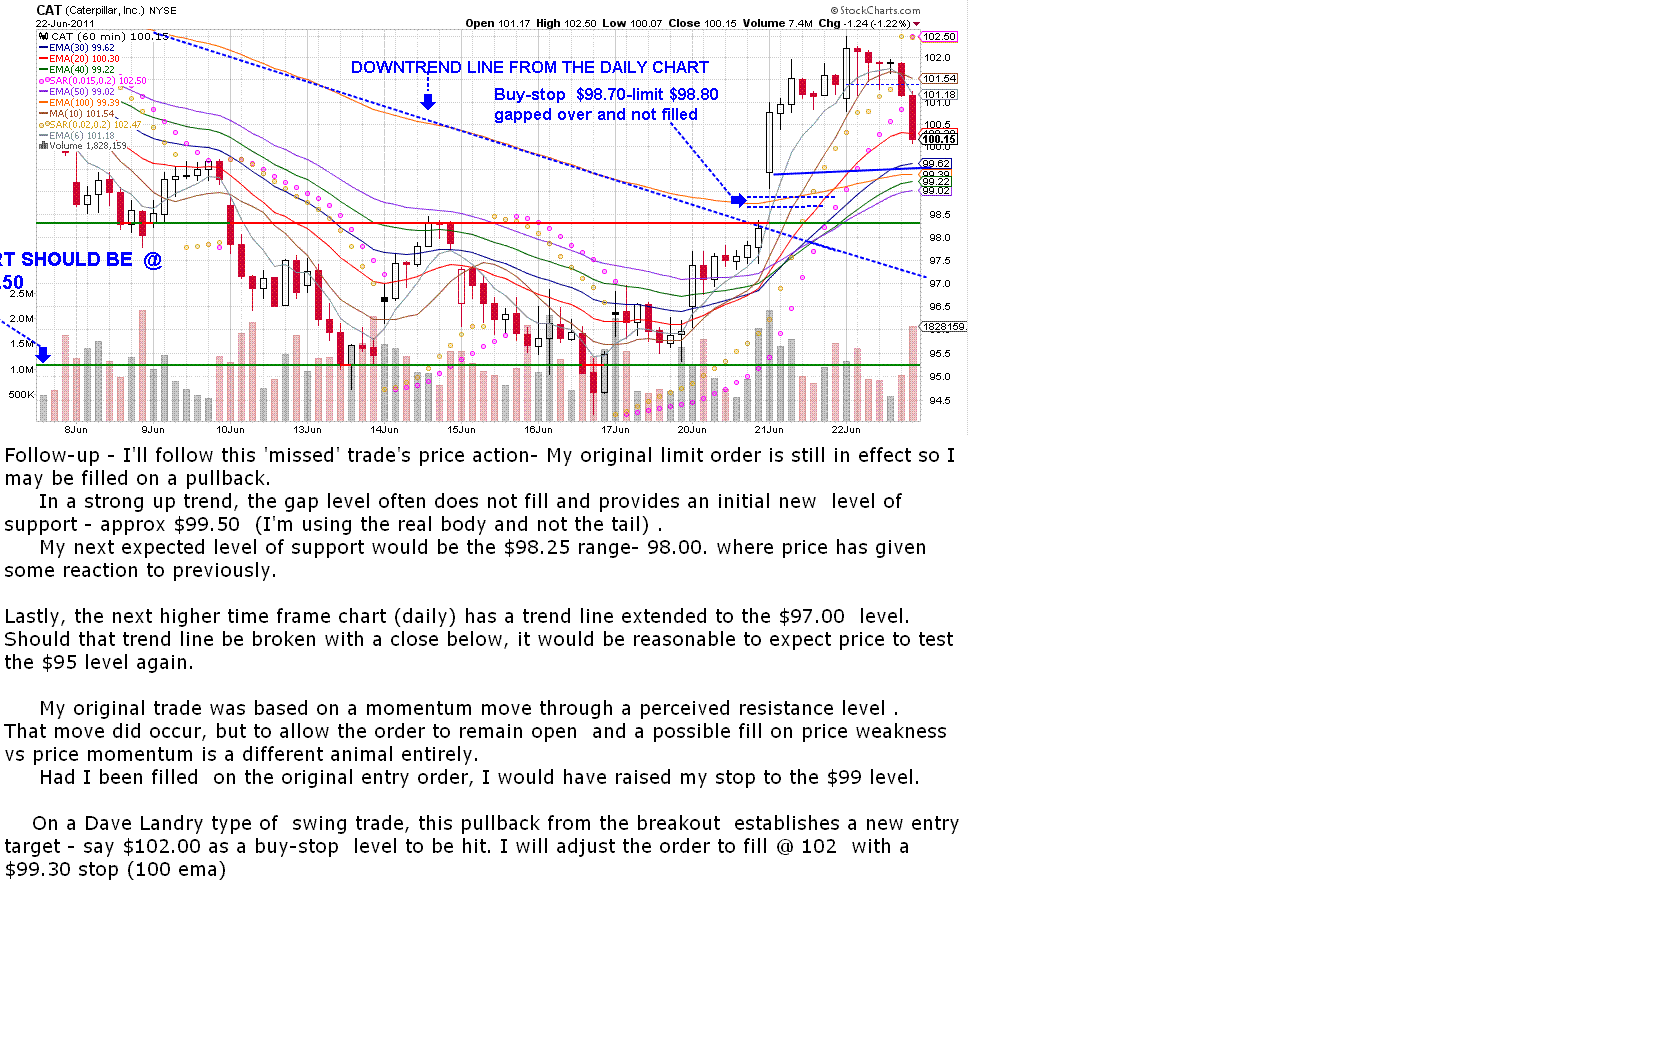  |
|
|
|
Post by sd on Jun 24, 2011 16:25:04 GMT -5
6-24-2011 fRIDAY PM Market down again this week,talk about big concerns about the Euro nations actually coming together..... and in the last hour I decided I would go with the short focus . I bot vixy, (ultra vix play, EUO-short the Euro, SSG- short semis,spxu, short s&P ultra) zsl, short silver ; and long BIIB. Presently I am below the $10k level I consider my baseline-$9849.00, and I will be seeing if I can improve that with these trades on this directional bet in the market. Note- BIIB is a biotech that is moving up despite the market so I'm giving it a shot. Here's a follow up chart of the proposed Cat trade- I'll post the chart from today , It is not a trade I was filled on, and so I am annotating the chart as a paper trade ,; Busy weekend ahead- SD 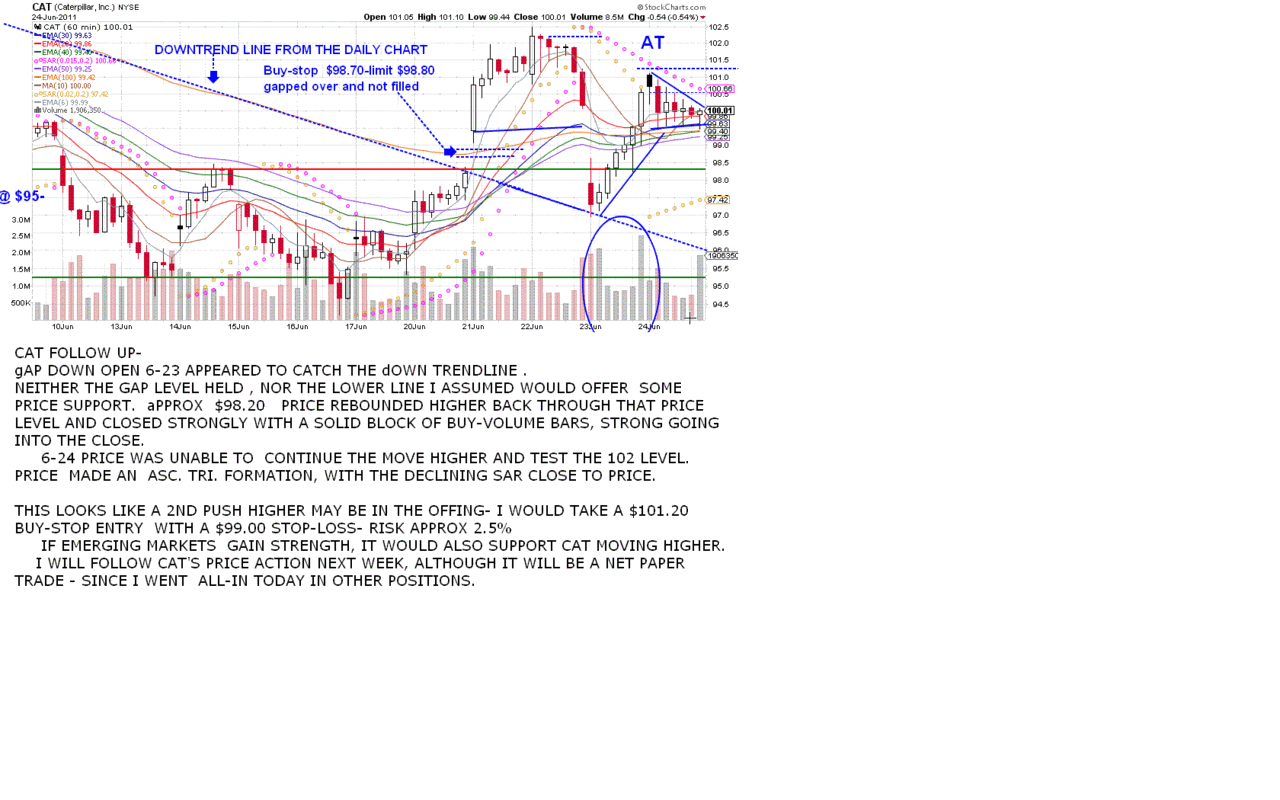 |
|
|
|
Post by sd on Jun 25, 2011 7:37:29 GMT -5
|
|
|
|
Post by sd on Jun 26, 2011 19:38:39 GMT -5
This Sunday night I'm adjusting stops on the various positions I entered Friday pm .
I've been mostly just dabbling with occaisional trades (losing one's lately mind you) and I've seen the account value drop beneath 10k which is a 'warning Will Robinson' all is not well.
I have not been 'focused' nor really p[utting forth much diligence in the allotted time I could make during the week to trading- And perhaps that is not a bad thing all-in-all, but it does speak to what effort one is willing to become adept at trading as a craft and not just a sideline perusal.
I've also been reading some threads on day-trading and price action on ET, and realize that those that manage to achieve a level of success and consistency over time and different markets have done so only with great effort,; They are indeed few , and it would seem that a random market comes to life daily with a totally different approach, than what the trader thinks should be the logical progression of the recent price action.
I see this often in my trading; I hear a news item that Greece is about to default and so I short the Euro, and yet the market rallies on some prime minister's speech about the austerity measures they will take, and my position stops out... only to see the Euro drop the following week as expected. After having rallied higher for a few days on false news/hope.
Just one example of how I am influenced by "news' or market interpretation by analysts- T
This tends to affect our beliefs about what the market 'should do' in reaction to such and such- and often the market does not react as anticipated..
When I trade based on my 'belief' about what the market will/should do, I am trading based on those influences I have read or watched or heard- that i think make sense-. and that is not necessarily in alignment with the market action.
The reaction of Price should be what makes sense- This is the sum of the market's interpretation of whatever information is out there. Therefore, as most of my Friday's trades are long shorting the market, I will set a stop that expects that trend to continue.
That stop will likely be a swing-low of price based on the prior day's price action, or trend line. In order to not get 'hit' by a volatility spike, we will widen our stops. and this becomes the critical question- Where is an adequatre stop set?
IMO, I will continue to use the 60 minute chart- SD
SD
|
|
|
|
Post by bankedout on Jun 26, 2011 21:44:21 GMT -5
This tends to affect our beliefs about what the market 'should do' in reaction to such and such- and often the market does not react as anticipated.. When I trade based on my 'belief' about what the market will/should do, I am trading based on those influences I have read or watched or heard- that i think make sense-. and that is not necessarily in alignment with the market action. Usually moves based on fundamentals tend to play themselves out in longer time frames. |
|
|
|
Post by sd on Jun 28, 2011 19:28:20 GMT -5
"Usually moves based on fundamentals tend to play themselves out in longer time frames. "
I agree- Bankedout- that's entirely sensible. I am surprised by the past 2 day rally on the 'expectations' that Greece will have to ratify new austerity measures tomorrow- If the congress can convene despite the rioters. And I think th e larger perspective is that even if such measures are approved, Italy and Spain are waiting to face the same Burgermeister down the road. Nothing that is broken is actually fixed IMO.
And what of the US of A? Augest 2 deadline to extend our debt level, and there is no common ground for the opposing sides ?
Your point is well made. I should be strictly focusing on the chart- I saw a chart and it fit my bias and i was influenced to enter those trades - Quite likely it may be a range we fall into, ;
the wider the time frame, the wider the logical stop level would be.
In trading, I should shut off the news altogether , and not get a bias of what 'should' be. Simply trade the chart .
With my time restrictions, I would be better matched to trade on a daily perhaps even the weekly- Each of these time frames suggest a wider margin for stops. I prefer to use a faster time frame and reduce the potential loss.
I started off these recent trades with an eye to the daily chart and trend-
In these last trades, I saw my positions going aginst me and had raised stops yesterday pm and stopped out on vixy,spxu, and 1/2 of the EUO- My best winning trade is BIIB, and ZSL has been giving back and my stop is now at B.E.
This 'Flip in the market' seeing gold and silver higher is surprising- It also supports the idea of taking trades based on a shorter time frame......in a choppy market.
Don't know if I can time that correctly with a one day a week look ahead- SD
|
|
|
|
Post by sd on Jun 30, 2011 20:28:22 GMT -5
I have been stopped out of all positions today (1/2 EUO short and BIIB long). BIIB was my single net profitable trade this past week. The 60 minute chart appeared to show price action weakening and I raised split stops , and both were taken out. My other trades (short) all became net losing trades, and I took a larger % loss than I normally would allow thinking I'd give some range for the choppy price action to develop as I hoped/anticipated. This did not work out well, with a net 2% portfolio loss as the market changed direction. As I glance over the charts, I see how I was 'early' - the trades right below resistance/trend lines on the daily. I also allowed several positions that were positive to turn negative- again 'hoping' for the larger macro trend to cause these trades to prosper. An additional note here- I went Greedy and had gone all-in - committed- I was unable to take advantage of reversing my position and catching this rally because it takes 3 days for the trade to clear to free up cash. The chart of BIIB follows- I was overweight this position (+$2,000.00) vs $1500) as the momentum looked strong on the Friday entry. Price appeared to pause and stall yesterday, and I raised 2 stops- one directly beneath the last bar's low, and one beneath the low of the day. Both stops were taken out- net profit about 5%- I believe i will continue trading in this more tactical way chart wise, with staggered entries and stops, but executing the messenger sooner. SD I hope to look and chart the reasons for my losing trades this weekend- We can learn more from the losers than the winners if we allow ourselves to. SD 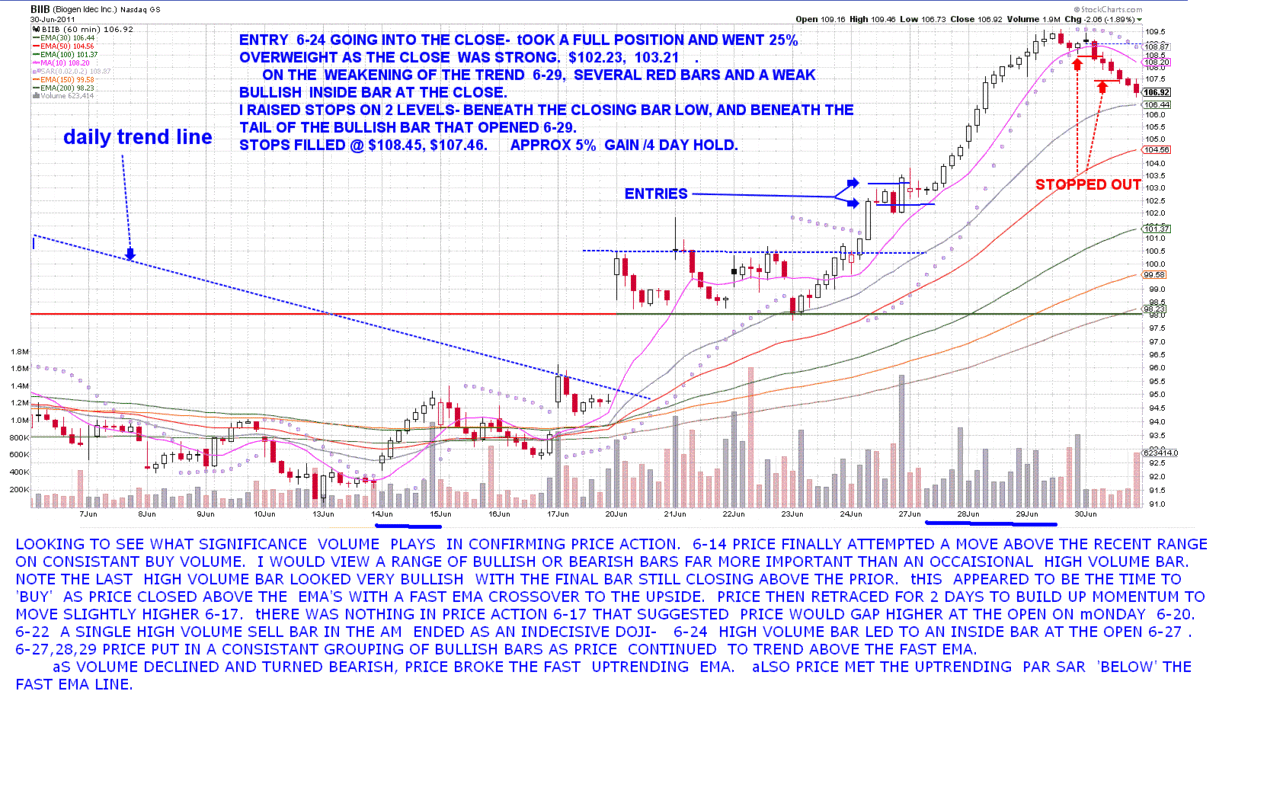 |
|
|
|
Post by sd on Jul 1, 2011 17:44:11 GMT -5
took several new trades today going into the close with the market closing bullishly higher. I took a reentry in BIIB at the close, as price had a single day pullback below the uptrending fast ema, and then back higher- The price action was not particularly strong, but price closed near the high of the day , above the fast ema, but below the prior high made 2 days earlier. Note that price had not pulled back to the trendline to begin with, but my prior tight stops were taken out on the break of the fast ema. The price pullback to 107 provided a good tight entry with today's move higher, assuming the trend will resume higher. SD 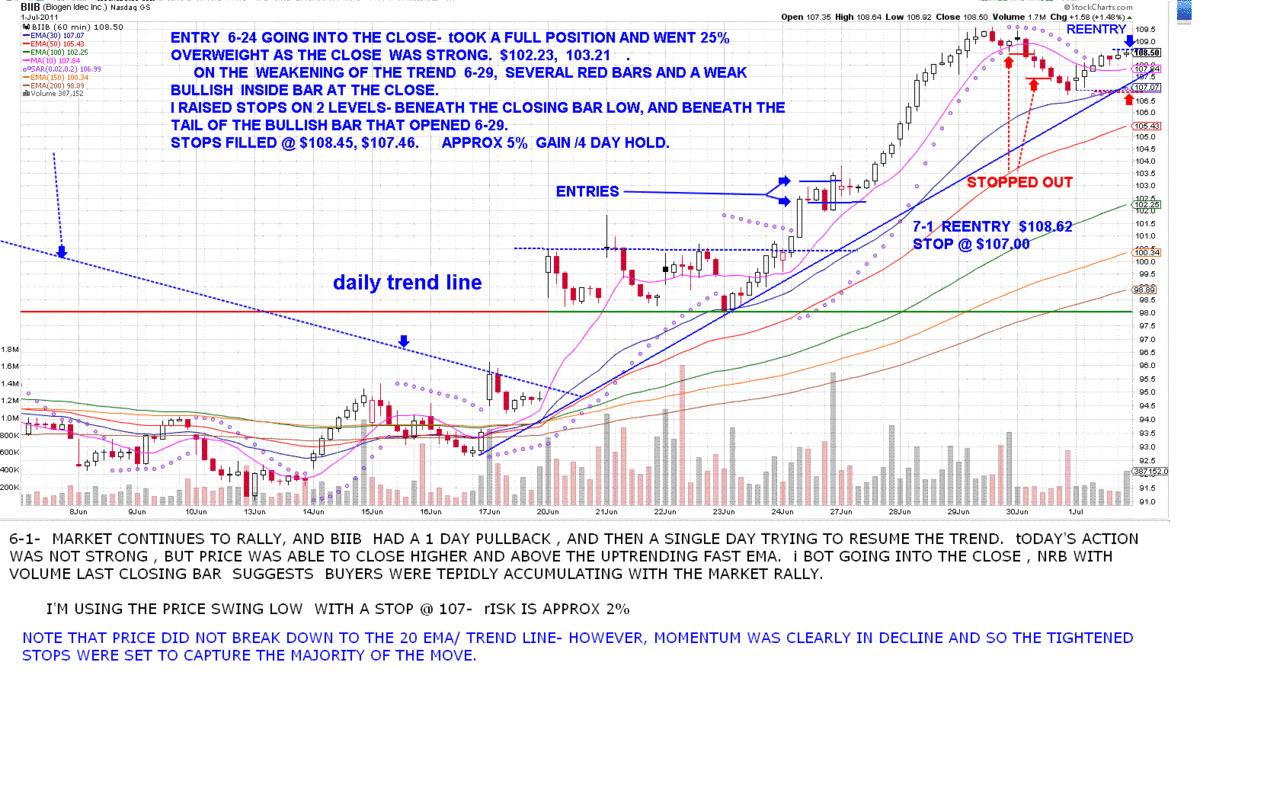 |
|
|
|
Post by sd on Jul 2, 2011 10:32:54 GMT -5
CAT is trending higher (Not an actual position unfortunately). chart attached as a follow-up to the previously posted charts on CAT. SD 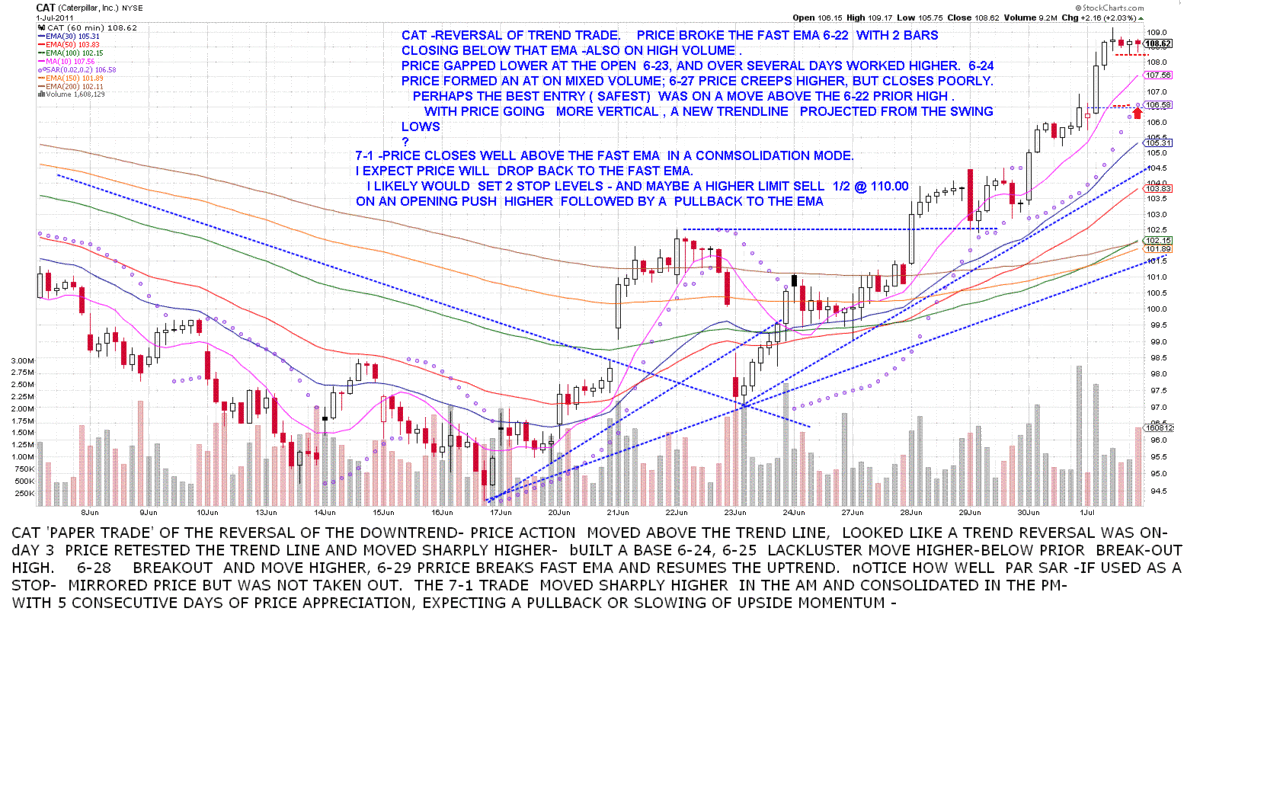 |
|