|
|
Post by blygh on Oct 17, 2016 9:25:23 GMT -5
Post time !!!Riders Up !!

| Rider | Horse | Open | Latest | Gain/Loss | % | Stop | Limit | Rank | | Tiarra | AAL short | 38.66 |
|
|
| 40.25 |
|
| | Joe | DOG | 20.91 |
|
|
|
|
|
| | Ira | LMT | 232.68 |
|
|
|
|
|
| | Spiderman | APC | 63.23 |
|
|
|
|
|
| | SD | NFLX | 100.44 | |
|
| |
|
| | Blygh | ITUB | 12.16 |
|
|
|
|
|
|
|
|
|
|
|
|
|
|
| | Market | SPY | 213.09 |
|
|
|
|
|
|
| QQQ | 117.04 |
|
| |
|
|
|
|
|
|
|
Post by sd on Oct 17, 2016 12:45:50 GMT -5
Here's how they looked before the open....
Charts are 2 HOUR TIME FRAMES- and Heiken-ASHI - reducing the "noise' of the entire price range over several days into the most prevalent -ideally to help identify trending See the stockcharts School Ed article for more accurate information on these types of charts , and their potential use.
stockcharts.com/school/doku.php?st=heiken-ashi&id=chart_school:chart_analysis:heikin_ashi
AAL short is Tiarra's steed 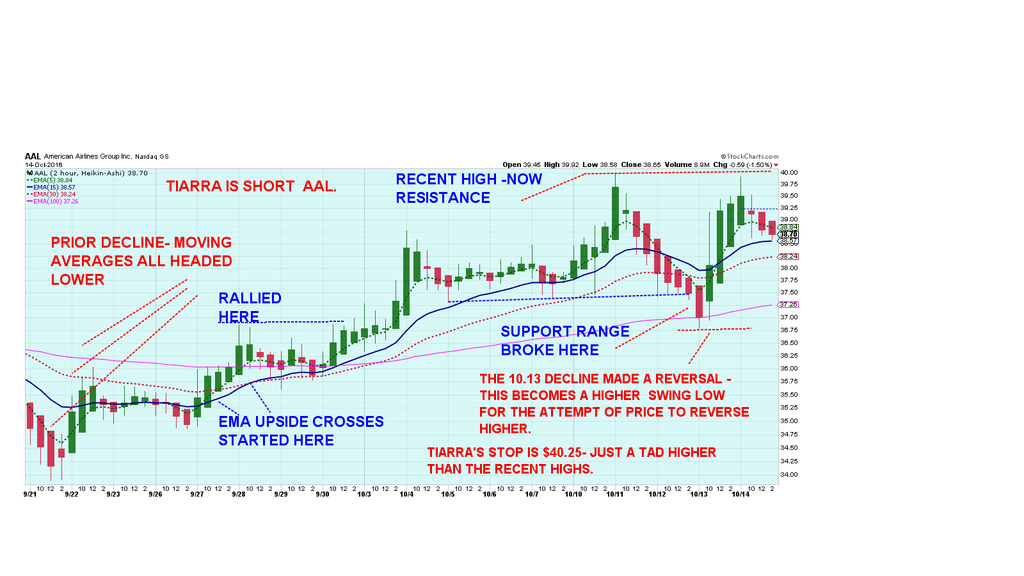 Spiderman's trusty mount is APC 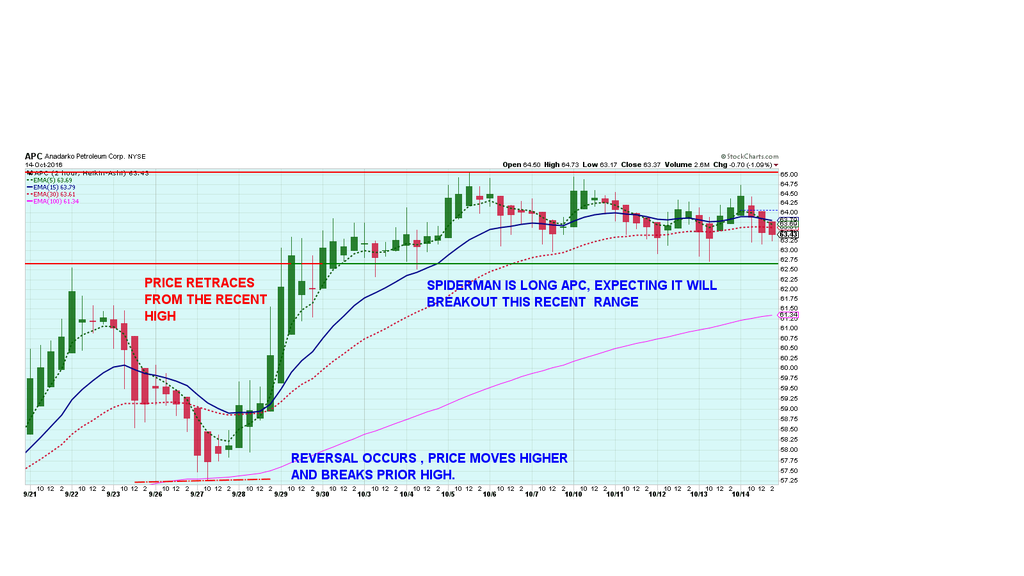 jOE'S PICK WAS ASSIGNED TO A NON-LEVERAGED - SHORTING THE DOW WITH DOG., 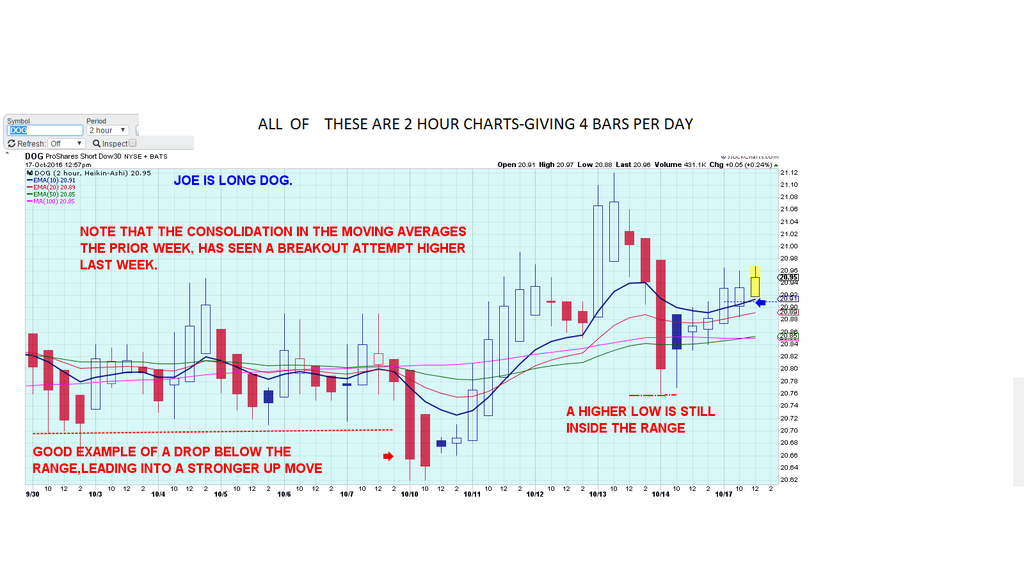 BLYGH IS GOING WITH ITUB- SOMEONE NEEDS TO TELL ITUB THE MARKET IS NOT TRENDING 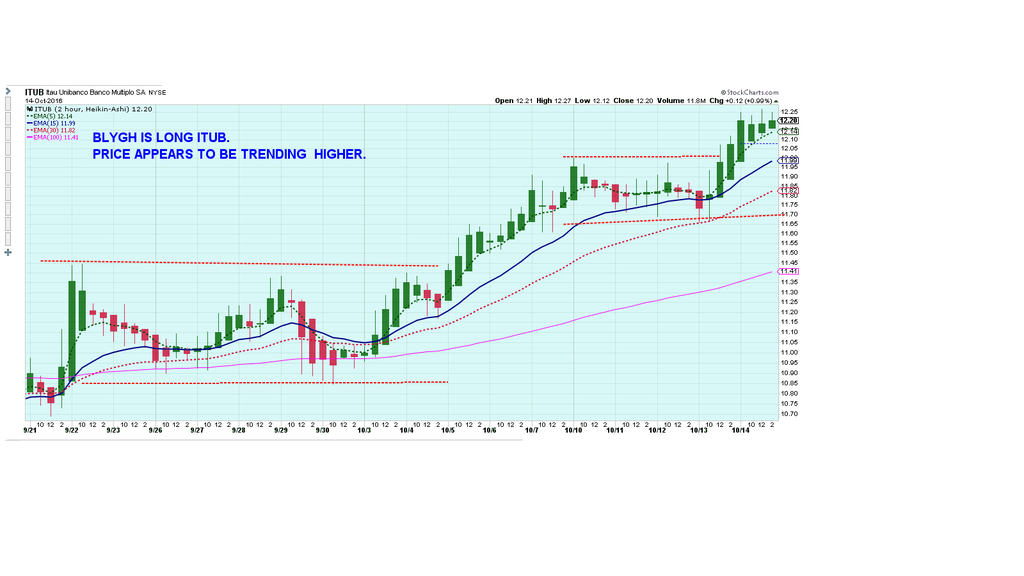 IRA SADDLES UP WITH HIS DEFAULT LMT.... 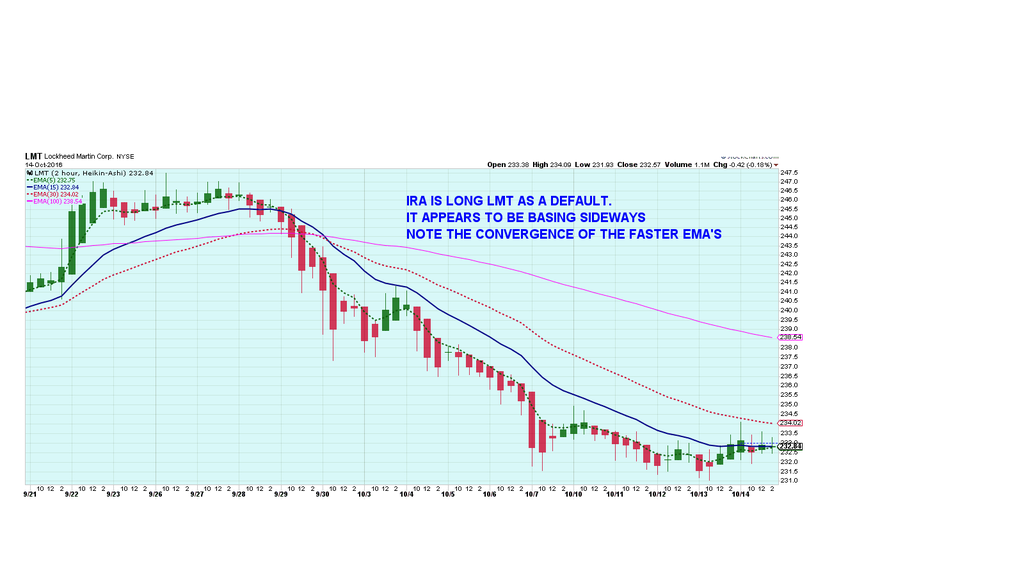 SD WAS HOPING THE PRIOR RALLY WILL JUST BE THE START OF BETTER THINGS TO COME THIS WEEK FOR NFLX 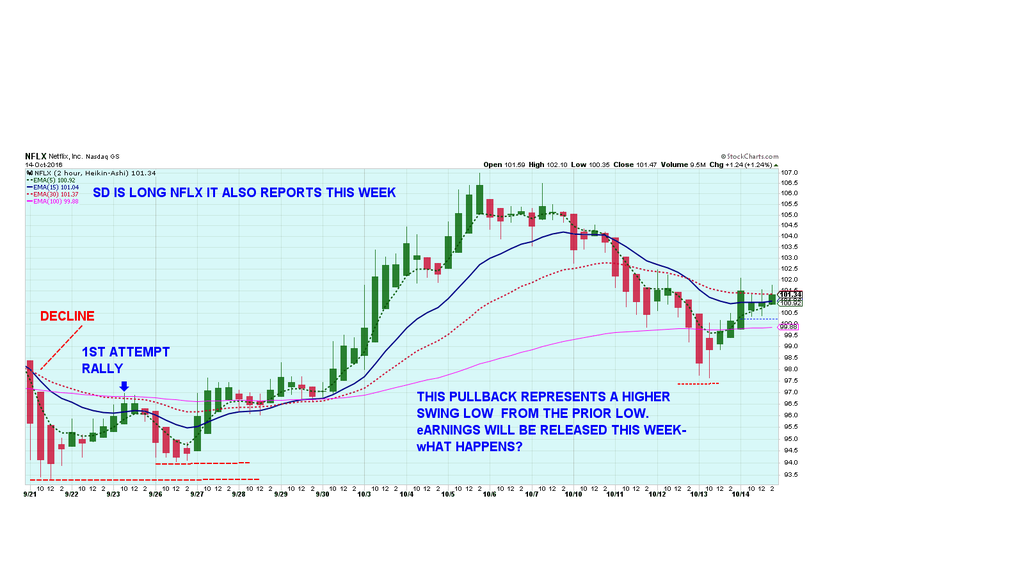 AND LAST IN THE LINE-UP IS SPY 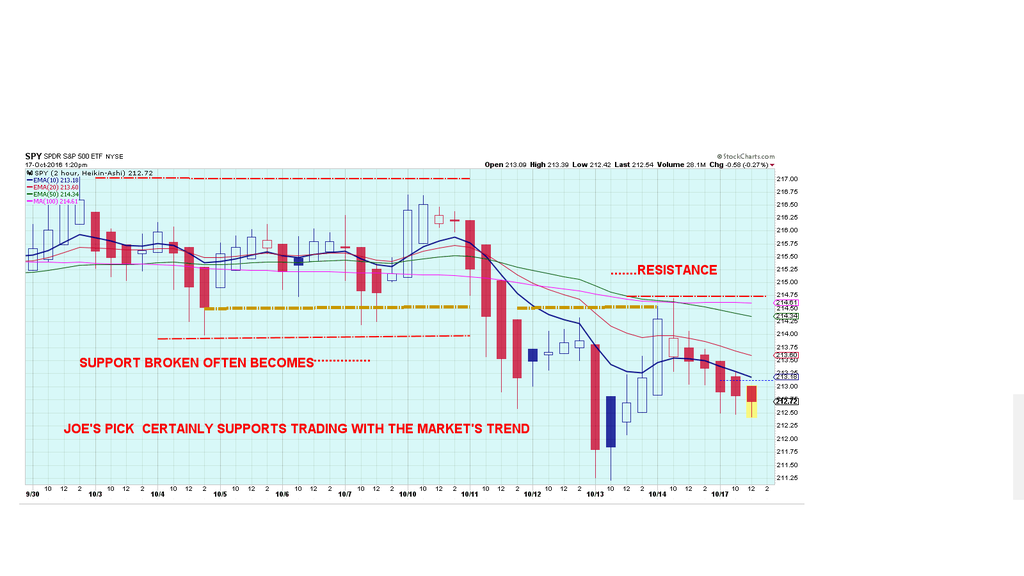 LAST IS A PRICE PERFORMANCE CHART WITH SPY BEING THE BASE LINE . 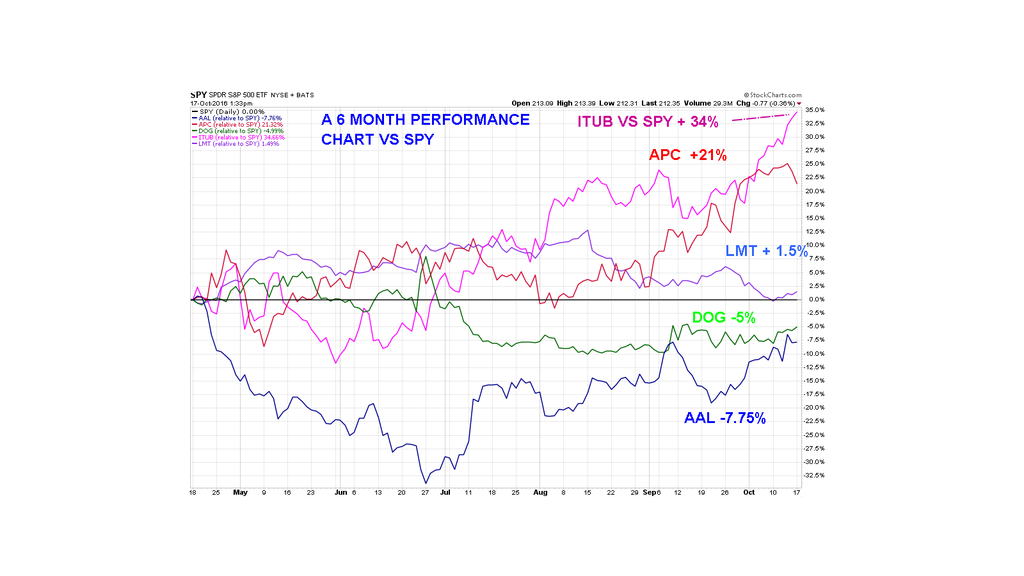
|
|
|
|
Post by tiarra on Oct 17, 2016 14:14:53 GMT -5
I really like your weekly charts, SD. I will tell Joe about the new rule. I forgot to tell him, sorry
|
|
|
|
Post by blygh on Oct 17, 2016 15:45:04 GMT -5

And they are off and running ...
| Rider | Horse | Open | Latest | Gain/Loss | % | Stop | Lm | Rank | | Tiarra | AAL short | 38.66 | 38.58 | -0.08 | +0.2% | 40.25 |
| 3 | | Joe | DOG | 20.91 | 20.96 | +0.05 | +0.24% |
|
| 2 | | Ira | LMT | 232.68 | 232.37 | -0.31 | -0.13% |
|
| 5 | | Spiderman | APC | 63.23 | 62.51 | -0.72 | -1.1% |
|
| 7 | | SD | NFLX | 100.44 | 99.80 | -0.64 | -0.64% | |
| 6 | | Blygh | ITUB | 12.16 | 12.38 | +0.22 | +1.81% |
|
| 1 |
|
|
|
|
|
|
|
|
| | Market | SPY | 213.09 | 212.38 | -0.71 | -0.03%
|
|
| 4 |
| QQQ | 117.04 | 116.82 | -0.22 | -0.19% |
|
|
|
|
|
|
|
Post by sd on Oct 17, 2016 18:17:27 GMT -5
Thanks Tiarra,
it's my 'contribution' to the Race- I am intending to vary the charts, time frames etc as we go along. If you (or any other racer) has anything of particular interest chart wise of interest or to share,compare, let me know and I will include that in the future.
Ahem, Blygh
move over LOL!
|
|
|
|
Post by blygh on Oct 17, 2016 19:18:56 GMT -5
Whoa Netflix NFLX up 20% in after hours trading - SD could be an early winner - Not sure about the import of "Ahem Blygh" Would you like me to document some other parameters ?- I keep an eye on PE, PEG, Short Interest and ratio, sector performance, insider trading, price to sales, dividends, payout ratio and analyst opinions.
Blygh
|
|
|
|
Post by sd on Oct 18, 2016 9:14:57 GMT -5
I keep an eye on PE, PEG, Short Interest and ratio, sector performance, insider trading, price to sales, dividends, payout ratio and analyst opinions.
That's a boatload to look into Blygh!
I don't have the background/education/understanding to properly make an evaluation based on sorting through many of those criteria-
I grasp the sector performance, sector rotation, insider trading- and perhaps the short interest ratio =
I would think it takes quite a bit of skill to evaluate among the other criteria- For example- Some stocks= are given a very high PE- often based on unproven future growth potential- and these can run for years -for a few companies, while others in that same industry group will not be given the same high -and perhaps unjustified PE . Understanding that means that one needs to understand that a low PE does not necessarily mean a better value. I am sure you have a process by where you evaluate the mix- and then make an investment or trade decision.
For example-AMZN has a PE of 202, Forward PE of $75 but a lot of impressive EPS % - 5 yr growth projection over 50%
NFLX PE of 309, Forward PE of 117, 5 year eps growth of 59%
www.finviz.com/quote.ashx?t=nflx&ty=c&ta=1&p=d
Look at the drop in price in 2016 and now the gain-
I expect you would view Amzn - and other very high PE movers perhaps differently as a momentum group ?More for trades than for Investments?
Would you also seek a higher PE in searching through an Industry group to find a candidate expected to have the higher growth potential as valued by the market?
Lots to ask in this regard-
If the market's "normal " PE is 17-18 what does that suggest about where we are now?
If you have time to expand a bit on how you assimilate and process that information into the decision making process, Whatever you are willing to share, would be in interesting.
I know a financial Adviser that i just asked this question to and they are very bullish going forward-post elections- They feel that more companies will present better earnings growth in the future quarters. We didn't talk about the possible Fed raise in December. Their approach is to rebalance on any market significant decline to sell off bonds and add into stocks.For the long term.
I was just having a disagreement of sorts with a friend citing the higher PE valuations due to stock purchases (due to the decline in bond performance) as just one reason we are overdue for a market correction. I used this as my rationale to raise cash in my retirement account-citing there would appear to be a much greater Risk of Downside movement than upside gains. This would also free up some capital near the recent highs to apply in a pullback- And the Fed is almost certainly looking to tighten- might be a catalyst for a correction reaction
Thanks- SD
|
|
|
|
Post by blygh on Oct 18, 2016 10:34:34 GMT -5
The PE ratios tell you more about mature companies as opposed to growth companies - TSLA has some horrendous PE but buying it today is like buying Ford in 1910. Wealthy people are buying it for their grand children. They do not need income now. For growth companies the PEG ratio is more helpful PE divided by growth rate - I am partial to companies with PEGs less than 3 (e.g. if PE is 50 but growth rate is 25% - the PEG is 2 - can it keep that sort of growth up? Buffet likes Price/Sales of 1 - I keep an eye on P/S - and look at it in conjunction with the ratio of insider buys vs insider sales - this has not been a great short term indicator but tends to be validated over the long term . I wish I could distill all the data into some formula to guide me but I am not savvy enough to work it out. I just form an overall impression.
Blygh
|
|
|
|
Post by sd on Oct 18, 2016 11:52:58 GMT -5
Thanks for sharing the information- I expect that experience has given you an intuitive feel for what makes sense to you , and what you have learned over the long run.
I have a copy of one of Cramer's books that explains " What " it means on a balance sheet- but gaining the understanding of what is more significant from that info is another task- I'll have to read it again one rain day in the future-
Following the last post, I did run the Finviz screener also working down from the highest PE ratios, and did a fair amount of buying today.Had to look though over 400 stock charts and got down into the 30 PE ratios finally for some picks.
I also did a sort for Brazil, bought some ITUB, and discovered that the Finviz chart does not at all match stockcharts- although the actual price quoted was identical. BBD moving strongly today.
Toying with the screener, I realize that it offers a good way to make a shopping/review list using some valuation metrics-sorting PEG ratio, 5 year forward EPS, etc. One more tool- Got to learn to sharpen those I use-
|
|
|
|
Post by blygh on Oct 18, 2016 15:51:10 GMT -5
Into the far turn
| Rider | Horse | Open | Latest | Gain/Loss | % | Stop | Lm | Rank | | Tiarra | AAL short | 38.66 | 39.35 | +0.69 | -1.79% | 40.25 |
| 5 | | Joe | DOG | 20.91 | 20.90 | -0.01 | +0.04% |
|
| 2 tie | | Ira | LMT | 232.68 | 232.79 | +0.11 | -0.05% |
|
| 3 | | Spiderman | APC | 63.23 | 62.97 | -0.26 | -0.41% |
|
| 4 | | SD | NFLX | 100.44 | 118.79 | +18.35 | +18.27% | |
| 1 | | Blygh | ITUB | 12.16 | 11.55 | -0.61 | -5.02% |
|
| 6 |
|
|
|
|
|
|
|
|
| | Market | SPY | 213.09 | 213.17 | +0.08 | +0.04%
|
|
| 2 tie |
| QQQ | 117.04 | 117.86 | +0.82 | +0.7% |
|
|
|
|
|
|
|
Post by blygh on Oct 19, 2016 15:25:56 GMT -5

In the back stretch
| Rider | Horse | Open | Latest | Gain/Loss | % | Stop |
| Rank | | Tiarra | AAL short | 38.66 | 40.63-Stopped @40.25 | +1.59 | -4.11% | 40.25 |
| 6 | | Joe | DOG | 20.91 | 20.83 | -0.08 | -0.38% |
|
| 5 | | Ira | LMT | 232.68 | 232.33 | -0.35 | -0.15% |
|
| 4 | | Spiderman | APC | 63.23 | 63.93 | +0.70 | +1.1% |
|
| 2 | | SD | NFLX | 100.44 | 121.94 | +21.50 | +21.41% | |
| 1 | | Blygh | ITUB | 12.16 | 11.40 | -0.76 | -6.25% |
|
| 7 |
|
|
|
|
|
|
|
|
| | Market | SPY | 213.09 | 214.22 | +1.13 | +0.53%
|
|
| 3 |
| QQQ | 117.04 | 117.85 | +0.81 | +0.69% |
|
|
|
|
|
|
|
Post by tiarra on Oct 19, 2016 15:50:05 GMT -5
Nice pick SD!
Blygh, you are really on the ball with updating. thanks
|
|
|
|
Post by sd on Oct 19, 2016 19:49:18 GMT -5
Thanks, but could have gone the other way just as fast on an earnings miss. So it was at best a gamble-a roll of the dice -if you will- I certainly did not expect that large of an upside move. Will improve my stats! But... Week is not over yet- And yes- Thanks Blygh for keeping this updated!
|
|
|
|
Post by blygh on Oct 19, 2016 22:32:17 GMT -5
I am just wondering if NFLX is ripe to short- when the buyers all get their shares - the price should go down .
BTW I hope you folks (SD and Tiarra) don't mind my increasing the size of your postings type. I have a hard time with the small print
Blygh
|
|
|
|
Post by blygh on Oct 20, 2016 16:51:03 GMT -5
Around the clubhouse turn and heading for home
| Rider | Horse | Open | Latest | Gain/Loss | % | Stop |
| Rank | | Tiarra | AAL short | 38.66 | 40.59-Stopped @40.25 | +1.59 | -4.11% | 40.25 |
| 6 | | Joe | DOG | 20.91 | 20.86 | -0.05 | -0.239% |
|
| 4 | | Ira | LMT | 232.68 | 231.83 | -0.35 | -0.82% |
|
| 5 | | Spiderman | APC | 63.23 | 63.75 | +0.52 | +0.822% |
|
| 2 | | SD | NFLX | 100.44 | 123.35 | +22.91 | +22.81% | |
| 1 | | Blygh | ITUB | 12.16 | 11.55 | -0.61 | -5.02% |
|
| 7 |
|
|
|
|
|
|
|
|
| | Market | SPY | 213.09 | 213.88 | +0.79 | +0.37%
|
|
| 3 |
| QQQ | 117.04 | 117.71 | +0.67 | +0.57% |
|
|
|
|
|