|
|
Post by sd on Jun 2, 2012 19:19:59 GMT -5
Blygh said:
I think the gold move will be short lived - It is a psychological commodity - only valuable because a lot of people think it is valuable - but it does remain a safe haven. I am betting on deflation - Why else would TLT perform so much better than TIP? Only because there is no inflation - well maybe some in food but certainly none in housing, energy, transports, utilities.
I agree with you Blygh- Gold indeed is a mostly psychological safe haven at this point-that has not been a safe haven in this market- It is Odd to me that Gold & Silver- have sold off so sharply with commodities, and have not benefitted by the market fear, the future "fiscal cliff" that the US is facing-Instead, money is going into bonds and a paltry $usd.
At some point, Gold should cease to fall with commodities if it resumes a 'currency' safe haven status.?
That got me thinking- I obviously don't comprehend the market changing interrelationships , and so a first look at some long term charts to get an initial view.
Looking back on the monthly charts, I went back to jan 2003 where TLT started the new year.
I was surprised by the decade long performance of TLT, compared to the "value" performer BRKB -Berkshire Hathaway, and then $gold , and $silver.
Both Gold and Silver presently are at significant support.
Presently Gold is off it's high by 21%, and silver by 47%-
Interestingly, in comparing the long term performace, BRKB turns out to be a substantial underperformer to TLT.
BRKB start $48 to present $79 yields 164% Pullbacks from swing highs to lows were 55% & 25% at major swings.
TLT start $57.50 -130.36 (present high) yields 226%-greater than BRKB with lesser pullbacks of 27% & 16% at swing highs to lows.
Gold 370-1622 present is 470% return with pullbacks of 34% and the present day 21%.
Silver $4.91 - $28.51 is 580% with pullbacks of 50% and the present day 47%.
While there are similarities in price action, perhaps the 2008 market decline being focused on the US housing debacle, will not see similar reactions in terms of the causes of today's market weakness- although both ultimately seem to be fear of a global recession/ or financial collapse-
The talking heads of course claim that when the bond trade falls out of favor, it will crash quickly- it is obviously in high momentum mode - this week gaining almost 6%! Mimics the parabolic action that started last Augest which lasted for 2 + months.
Obviously, one should have a grasp of the BIG picture- the forces that drive the market- and know when momentum is changing direction- Right now, the momentum is for the market to go lower- How much, How long? who knows?
I'm raising my stops on my "safe" longs to hopefully get out at BE on Monday.
SD
|
|
|
|
Post by sd on Jun 9, 2012 7:45:05 GMT -5
a quick update- June positions With the exception of AAPL and AIG - the other trades were initiated due to the uptrending price action -showing some strength - as investors look for 'safer' investments. the price action on the 60 min chart will determine how stop-losses follow price. 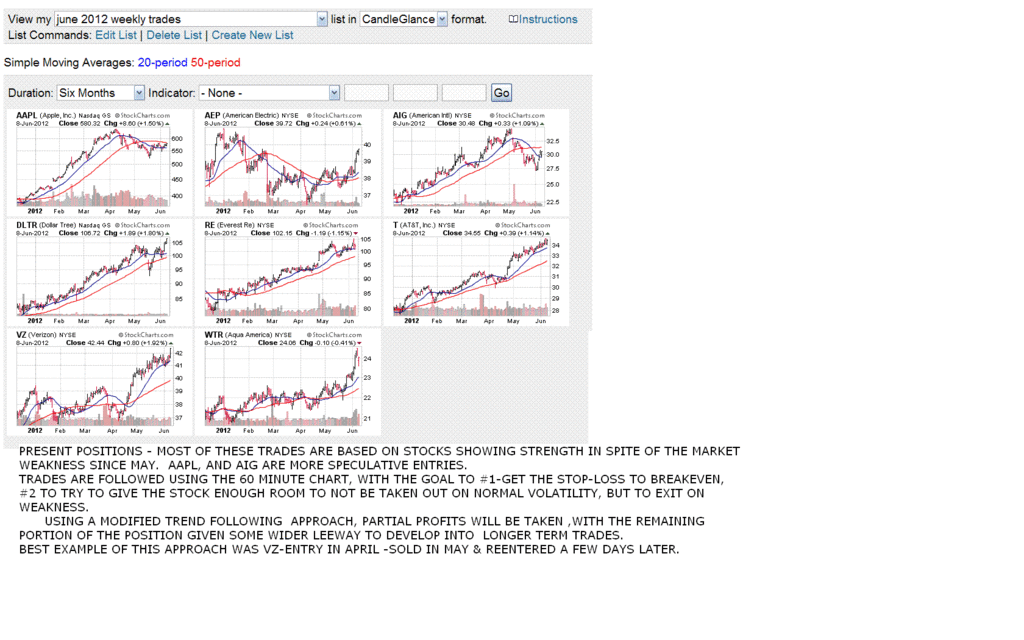 |
|
|
|
Post by sd on Jun 9, 2012 9:13:51 GMT -5
|
|
|
|
Post by sd on Jun 14, 2012 20:46:21 GMT -5
about the time I think I have a handle on the market, it will prove to me that I am gullible and it is schizophrenic.
I am reduced to 7 positions, and 5 of the 7 are profitable with stops above my entry cost-
I did stop out on WTR & AEP for a just above entry net profit .
While having a decent gain in T & VZ, and today's price action pushed the price above the trend line with a move that exceeded the normal "trend'. Combined with a final bar that suggested a top had been reached, I am splitting the stops on the position.
The goal is to lock in a gain on a momentum move that will likely retrace on a portion of the position - A move that should see a retracement that will allow a reentry at a lower price.
Ultimately, I am somewhat testing myself along with this strategy-
Sd
|
|
|
|
Post by sd on Jun 16, 2012 14:34:23 GMT -5
The way the 6-14 price action closed, it suggested that the momentum may have slowed with a weak bar at the close. at this point, I decided that instead of just raising a stop once price closed below the fast ema, I would raise a stop under price ABOVE the fast ema . at the same time I raised the stop on the remaining portion of the position. This locks in a 6.6% gain on that portion from the reentry. This week turned out to be a bullish week despite the 'fear'. I also used the same approach with T but it did not pullback to the 1st stop. Winning features of this approach in this market- cut the position on weakness, and take the small loss. choose stocks that are showing they are heading in the right direction- keep enough room for the trade to continue, and get the position to Break Even as rapidly as possible. The positions taken were not highly volatile positions. One position is a laggard, RE and I will close it Monday Present positions VZ,T, AIG, DLTR,RE- As the market is showing surprising resilience , I can assume some of the fear element is priced in. I don't think we're out of the woods by any means, so I will continue to try this approach- SD 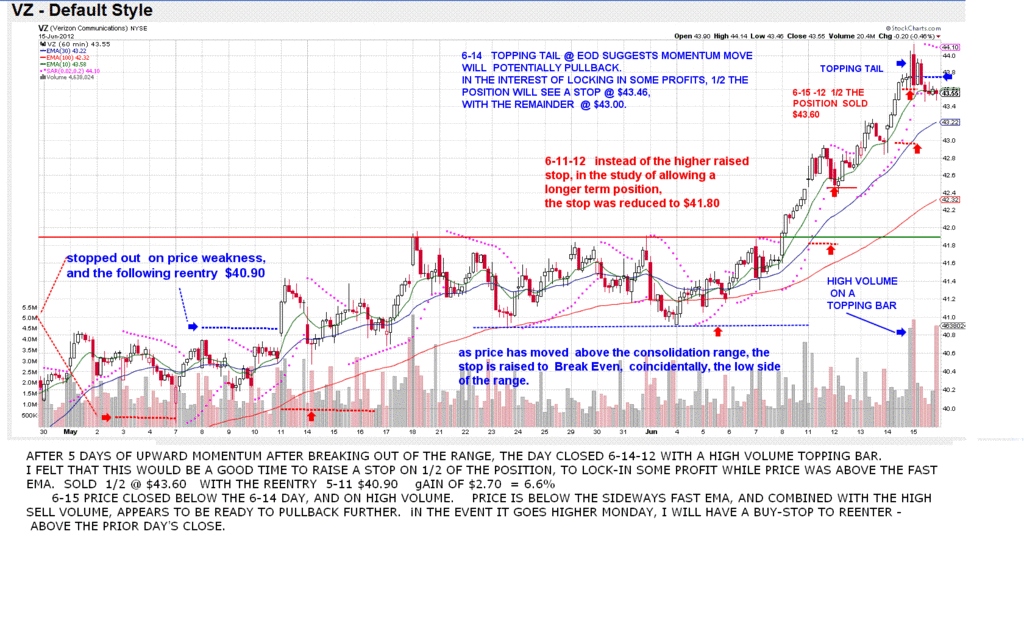 |
|
|
|
Post by sd on Jun 21, 2012 20:03:26 GMT -5
In recent weeks the market had seemed to be basing, and despite the never ending European saga still playing out, we were starting to muddle along with more sectors seeing some signs of upside after having pulled back.
Bernake's assessment of the economy yesterday, along with the Fed's lack of immediate action, seems to have taken the wind out of the market today.
Gold sold off, and I caught Dennis Gartman on CNBC saying don't buy Gold, just consider a play on the gold miners. He cited this is a shift from the past 5 years behavior.
Despite Bernake's pledge to do what is 'necessary', it wasn't enough to reassure the market. Combine that with the Moody's downgrade of 15 banks today, but the downgrades were not as severe as anticipated? Therefore Banks gained in After hours tonight?
The Dollar moved higher, of course, and one has to wonder where this market will go, whether the combined elements and the future fears will simply cause this market to grind down and then up with periodic rallies, only to give up the gains -
Assuming there will be a lot of up/down grind in the months ahead, tactical trading - cutting losses quickly, and locking in some partial profits when a trade goes as anticipated, seems to be warranted, unless one can stand the large swings .
I've been applying a short term trading approach with a goal to allow a short term swing trade to develop into a longer term position- possibly months long given the right price action by the position.
Today's market action saw 4 of my positions stop out completely, 2 positions were lower, yet still profitable, and 2 positions actually gained slightly.
Of the 4 positions that stopped out,
2 had losses of under 1 % and 2 stopped out with gains.
Prior to today, I have taken off some partial profits.
After some really sloppy trading last year, with the subsequent justified losses, and taking some time off due to work demands; I am again applying a short term strategy.
I'll get some additional charts posted in the day's ahead -
SD
|
|
|
|
Post by sd on Jun 22, 2012 4:30:22 GMT -5
the xbi Biotech index has pushed above a weekly sideways consolidation that has been in place since Feb.
I had taken a partial position $84.04 previously, and added yesterday $86.60 -avg cost $85.52 for a full position.
I will raise my initial stop as well as my new position to $84.00
This stop is too close to give the breakout room to retest, but with market weakness a major factor, I am aggressive in reducing losses on entry.
SD
|
|
|
|
Post by sd on Jun 24, 2012 9:44:09 GMT -5
what is the sector flavor of the day/week. While I still make discretionary trades -time is very limited- I will continue to look more at the stocks making 52 week highs- as a time effective way to see what the market rotation is favoring. I stopped out on MWE, SRE that looked promising earlier in the week, and I've taken a 1/4 small Gold short position in DZZ, waiting to see if Gld will break 148.00 . I'm very aggressive with stops on the discretionary -reversal of trend- trades. I still have partial positions in VZ, t, and just stopped out on the remaining DLTR , and AIG locking in gains. I still hold a single share of AAPL with a $569 stop. XBI seems to be in favor this past week, breaking out to new highs while a lot of the market sectors are weak. As the market sold off Thursday, XBI opened higher but closed weakly. Friday, it made a new high. In applying a swing trading approach to a new 52 week high trade- I took an initial entry into XBI $84.04 with an add 6-21 on a buy-stop getting filled $86.60 with an average cost of $85.52. This weekend, I took a look at XBI on a weekly chart, to see what has happened in past years when price "broke out" and made a new 52 week high. I think this is a good study to do on any stock , and it's just a starting point to assist me in applying trailing stops but with a faster time frame approach. What is first noticeable about the weekly chart and the new 52 week price moves, is that the trend has been anything but smooth sailing- Many times, the new 52 week high move lasted for a relatively short period of time before selling off and giving back all of the new gain as well as a chunk of the prior 52 week move. While this breakout may be the exception in how it behaves, it is likely that the past history price action has showed us what is likely to occur going forward- Since the weekly trends are indeed volatile, a faster approach to react to Price - to lock in profits, and reduce potential losses is simply historically prudent as the best way to implement a 52 week high trade. I did not get a chance to further break down the elements of the weekly price chart other than what is on the chart. What should also be noted is what happens when the first red bar on the weekly is made, and how that would be viewed on the daily chart or hourly- Using a split position trailing stop, or perhaps a split trailing stop and limit target sell to maximise a gain prior to the 1st bar- say @ 10%- will be further studied. 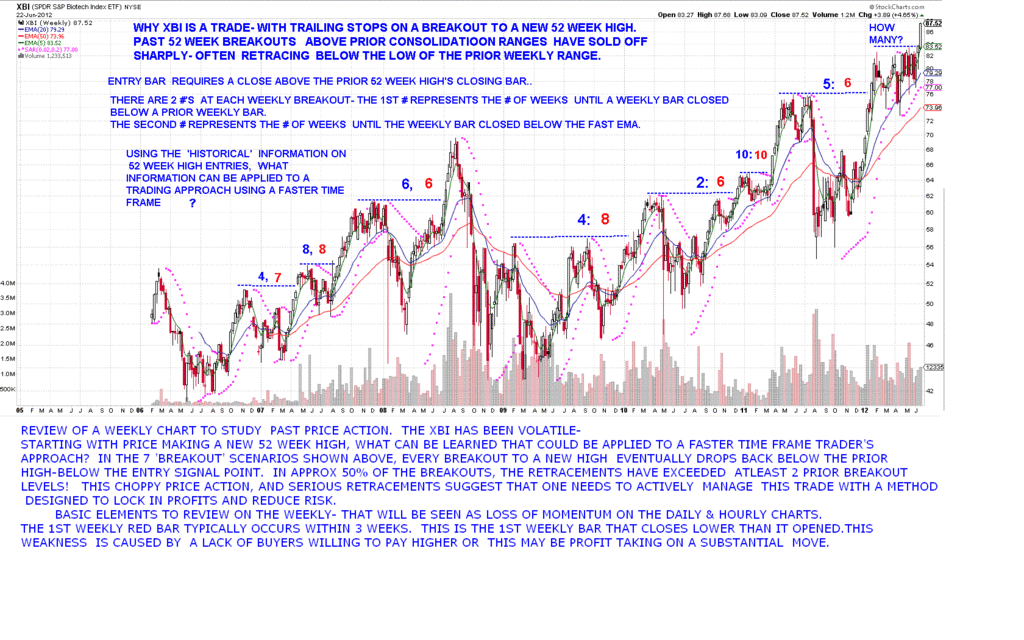 |
|
|
|
Post by sd on Jun 25, 2012 20:19:38 GMT -5
My remaining 1/2 position in T was stopped out today 6-25-12. I entered this trade on 5-11-12 , and have held for 6 weeks. The gain was not outstanding, but the approach to the trade was a well managed application of using the hourly chart to initiate a position with a relatively tight stop-loss,; to gradually adjust the stops progressively higher as the trade developed into a winning position; to select an appropriate time to lock in partial profits- not only on the amount of gain, but on the interpretation of what the price action/volume suggested. And staying with the premise of developing longer term positions without sacrificing a profit -turned into a loss- The final stop today still locked in a gain above the entry, and combined with taking a partial profit at a higher level, made for a decent trade. While there has been a lot of volatility in the market, The T trade was initiated on stocks gaining strength where other sectors were weak. SD 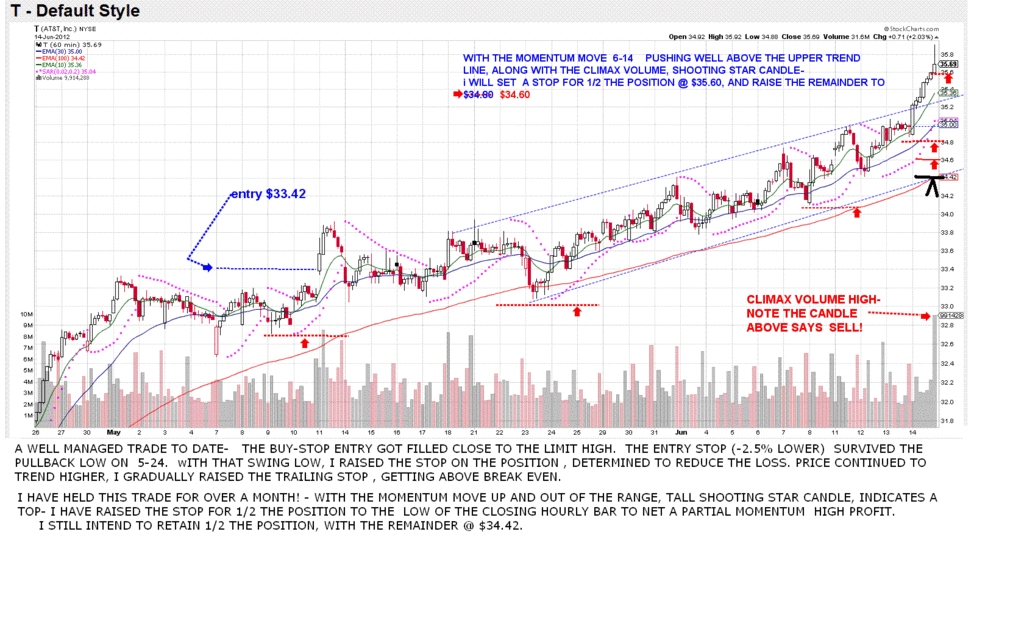 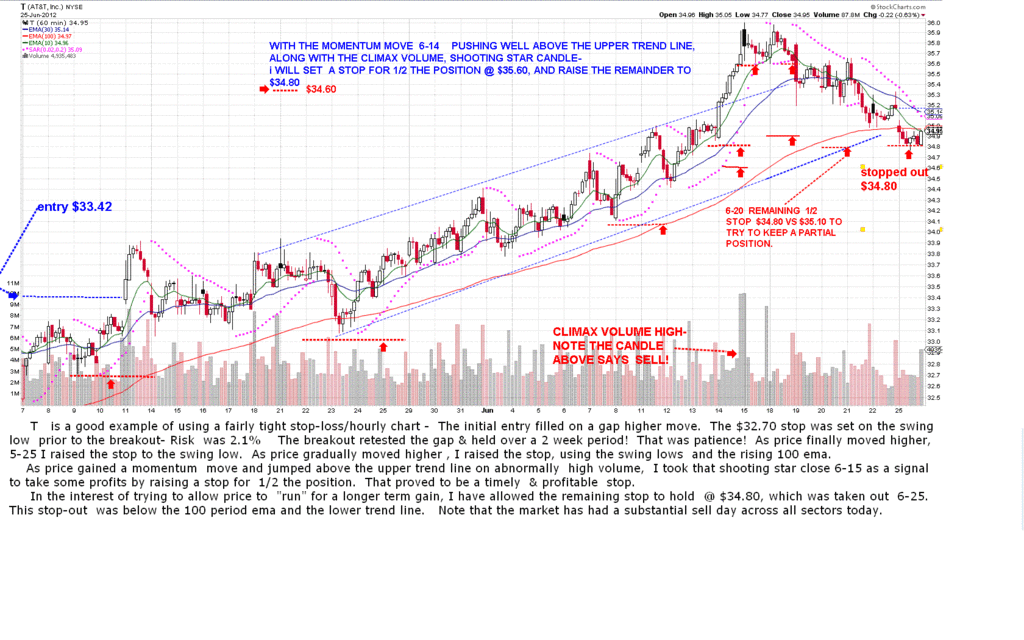 |
|
|
|
Post by sd on Jun 26, 2012 19:53:46 GMT -5
MY single experimental share of aapl stopped out $569 today 6-26-12
Entry was $534 & change - a 6 week hold with plenty of room for price to roam, stops only raised gradually once I was at Break Even.
SD
|
|
|
|
Post by sd on Jul 2, 2012 20:07:57 GMT -5
With Friday's market rally, and today's follow thru, All my trades are net profitable, although all do not have stops at or above Break Even yet, but I'm pushing it. I thought I'd have more time to post a few charts but that hasn't been the case. I'm presently up about 4% from the start of the month- which was pretty much a low if memory serves. I can attribute these short term gains perhaps to a more benevolent market- taking fewer discretionary trades, and more trades focused on stocks making new highs, getting the stops to Break-even as quickly as possible, Taking partial profits on a momentum move higher, and reentering trades as they head higher- VZ, T, etc. I'm fully invested but skeptical about where the next pail of cold water will arrive from- And so I'm adjusting stops higher daily- I have too many 1/2 size positions (12) with only 2 -MWE, STR that are discretionary trades- reversals from downtrends. The remaining are all from stocks at or very recently making new 52 week highs. As you look at the groups on the new 52 week high lists, you not only get a sense of what is in favor sector rotation wise, but you get a 'count- for much of June , there would be 40 -60 stocks making new 52 week highs. Today there are 310 in the NYSE. stockcharts.com/def/servlet/SC.scan I have no illusions about the number of trades I have open lasting very long- The market will force my hand by finding my stops- hopefully , they will be above my entry cost- and somewhat higher -as I'm splitting stops on most trades once profitable- One stop to be more aggressive in trailing price, the other above break-even but lagging price- Landry type approach- SD |
|
|
|
Post by sd on Jul 3, 2012 17:10:53 GMT -5
aig was a "discretionary' trade- meaning that it was not selected from the stocks making recent new highs- 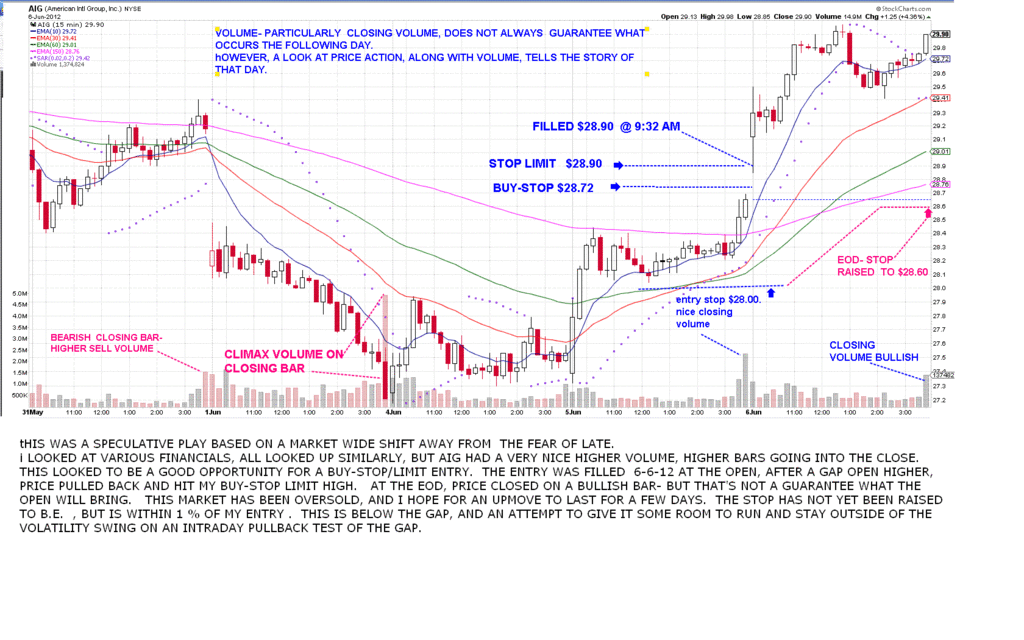 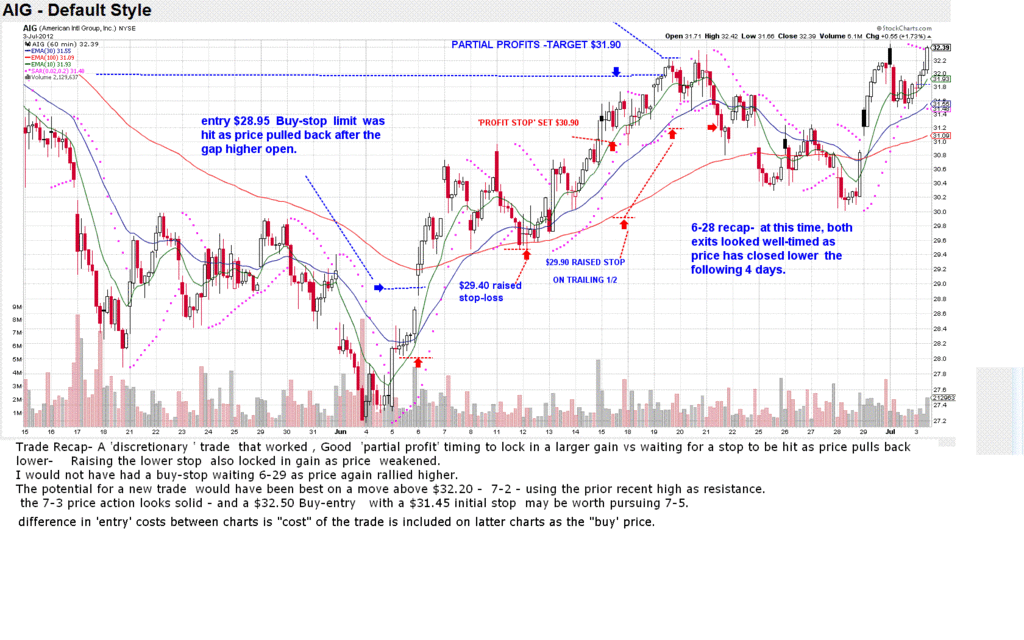 |
|
|
|
Post by sd on Jul 3, 2012 17:42:06 GMT -5
The DLTR trade was chasing sector strength- in the discount store area- also working was DG, Cost, I presently have an active position in COST, but I wonder if sector rotation into multiple other segments hasn't taken the lustre off the discounters for the time being. The trade worked well, and the split stop approach captured gains on both the profit stop and slow stop. Both were adjusted progressively higher. What could have been a minor pullback, has actually seen price pullback to below my entry- Had i not applied the trailing stop approach, this could have become a losing trade. SD 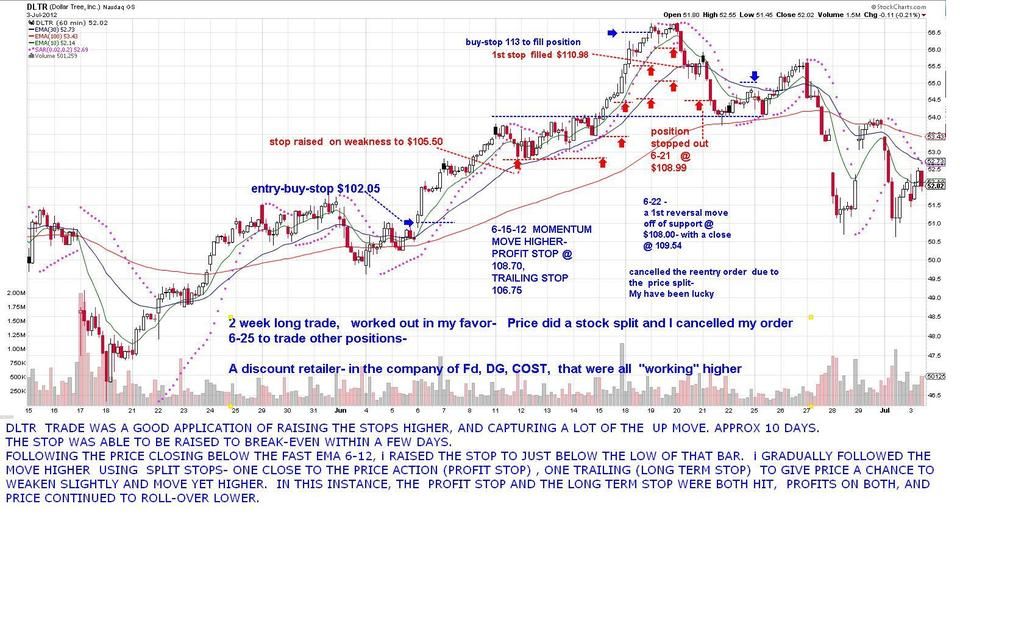 |
|
|
|
Post by sd on Jul 3, 2012 18:25:07 GMT -5
The first entry on Cost was stopped out in MAY. It had recently made new highs, but had pulled back for several weeks before making a 1st reversal attempt, which failed to hold. I entered on the second reversal attempt, which also failed. My stop-loss on the trade was based on a stop under the recent consolidation range. as such it was reasonably well situated and reasonably close. The stop was hit and the trade closed, and price headed lower. Recently, I just entered a new COST trade, and it is an active position- Not looking very robust at the moment though. 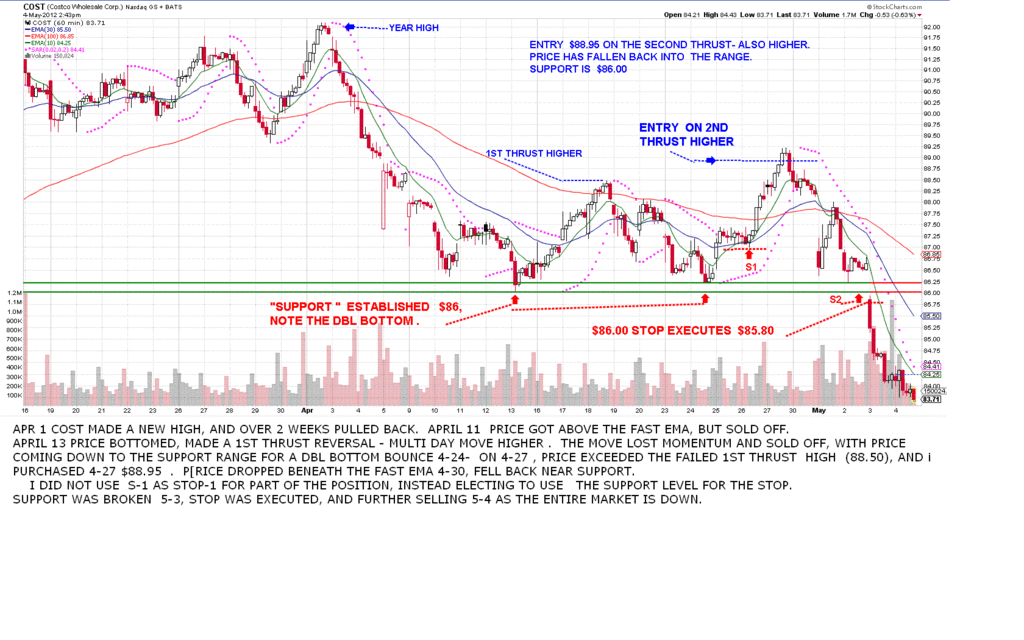 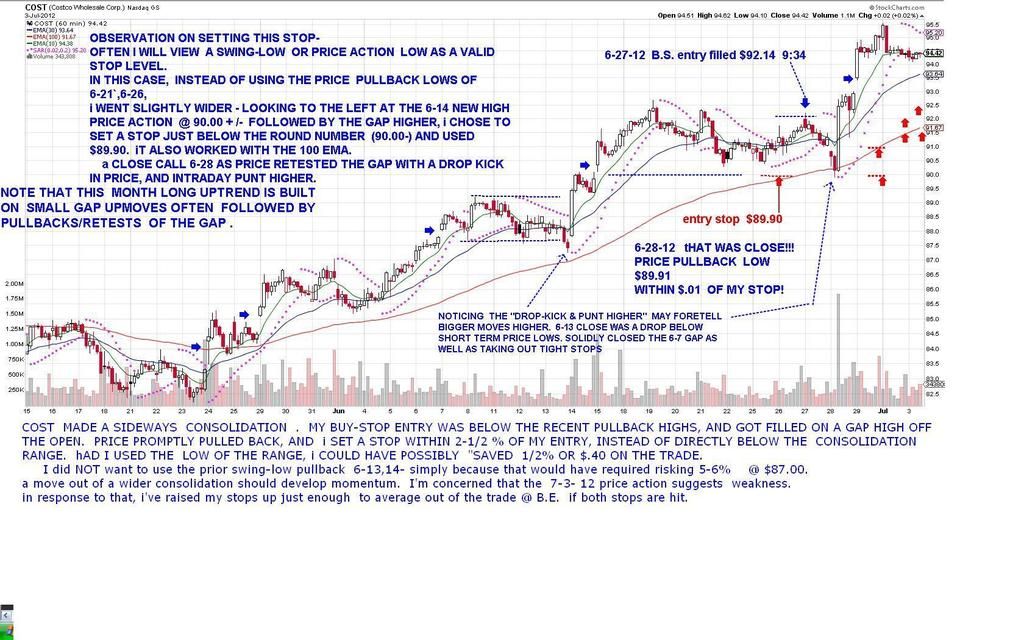 |
|
|
|
Post by sd on Jul 3, 2012 18:56:28 GMT -5
KOF- SA drink maker- has been uptrending for a month- A sector play on the soft drinks- KO PEP also doing well. My raised profit stop was in place today, and the opening price had gone considerably below my stop without it activating.! While price appears to have closed higher today, the issue with a stop not doing what it is expected to do is disconcerting- What happens if the next time it is to the downside and doesn't work? Hope that was just a fluke . 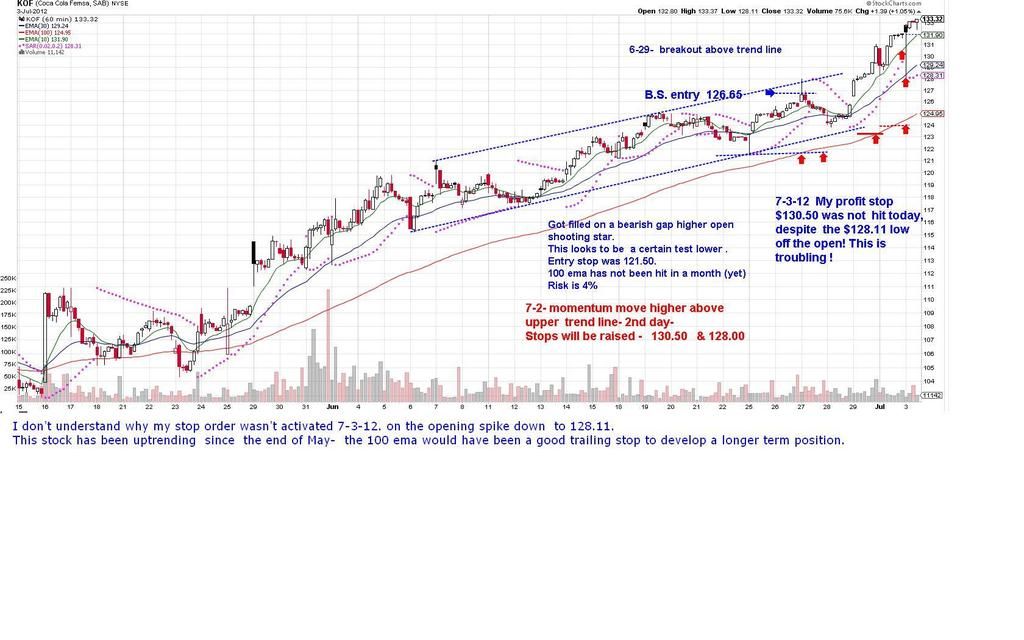 |
|


