|
|
Post by sd on May 4, 2012 16:55:34 GMT -5
Markets ended the Week down, taking with it about 1/2 of my positions I had entered into for losses. I won't belly ache too much about the trades- I could have sat on the sidelines.
Not all, but the majority of the trades were in alignment with the market and I thought there was a focus that would help support price action- Perhapps I will return to some of these following a pullback lower.
My one decent winning trade is VZ, but the losing trades surpass the gains. .
I was considering shorting Europe with EUO today, but that would be trading my bias- price hadn't broke out yet.
In my IRA, I increased my Bond positions.
SD
|
|
|
|
Post by sd on May 4, 2012 17:45:28 GMT -5
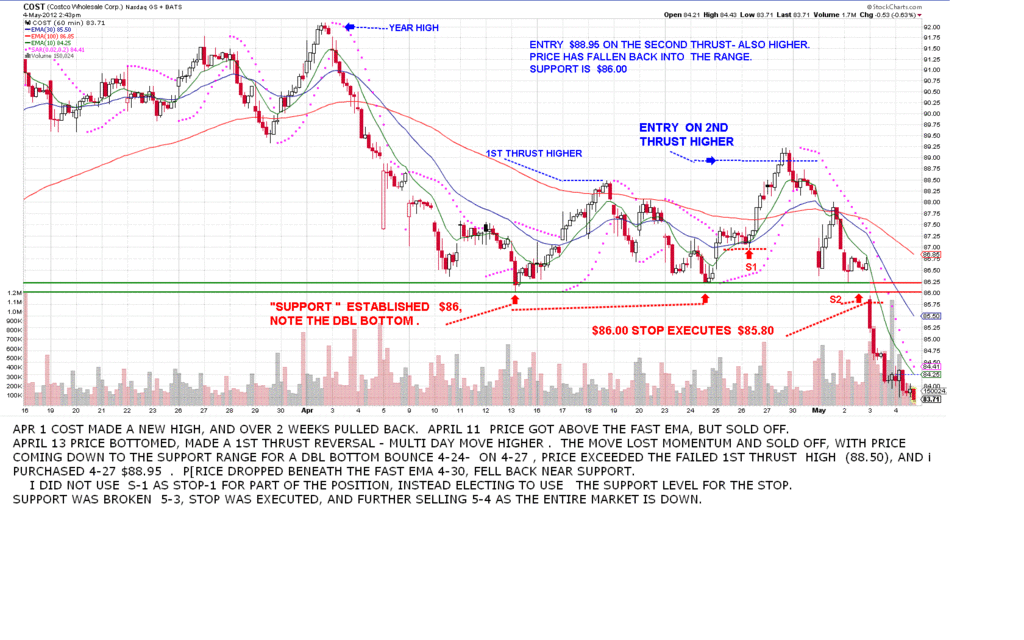
Costco & DG were based on the thinking that the economy is not improving greatly, and they would benefit by drawing additional cost conscious buyers.
COST had seen a 2 week pullback after making a new high-I viewed it as a 'safer' play- a stock that had been steadily uptrending the prior year+. The Vxx hitting all time lows- market was unfLuffed at time of entry.
Looking at the Daily ,price is breaking down with momentum.
Looking at a weekly, price is getting close to the 50 ema, which has only been hit 2x in the past 2 years. That could be the buying opportunity to reenter the trade?
Here's the 60 min chart- A good buy-stop entry on the 2nd thrust higher following the sell-off/pullback.
A defined stop-loss based on price support & the Dbl bottom.
In a defensive move, I should have sold 1/2 at the S-1 stop but did not- trying to think longer term-
In this example, it did not help with the trade.
|
|
|
|
Post by sd on May 7, 2012 21:08:45 GMT -5
Quick follow up - The market showed Fear about France's election this am, but closed decently- Is France's politics 'baked in" to the market? Who knows?
the VZ trade stopped out -stop @ $40.20 filled at $40.11.
Price closed higher, and I would reenter above the recent high.
My remaining positions closed incrementally higher, and all are just barely into net profitable territory.
I will continue to look for 'value plays'-or low defined risk.Even the utilities look weak. (XLU)
Cramer is pounding the AIG bandwagon- and Whitney Tillson- Investor is also long AIG- as a long term investment .
With a Gov't sell price at $29, when will the excess value be realized? Might be worth watching .
SD
|
|
|
|
Post by blygh on May 11, 2012 18:02:10 GMT -5
I stopped out AIG at 34 - not gutsy enough to short it. I will hold VZ as long as the dividend stays up
Any thoughts on the mortgage REITS?
Blygh
|
|
|
|
Post by sd on May 11, 2012 21:04:53 GMT -5
Hi Blygh-
I was long FRT but stopped out this week on a spike down 5-7-12-and may reenter- simply cost control on position /market weakness on my part- It looks strong relative to the market- However- a linked trade-HD=
I also had a position in HD- home play- but it stopped out, rolled over on the weekly chart-
I'm not sure if they will trade in tandem- FRT is actually consolidating with a sideways action. While HD has rolled over- FRT is simply sideways- I will BUY a breakout higher on FRT. At this point, I would use a $102.50 Buy-stop to enter, and to not buy within the consolidation- We don't know where this market is heading, and continued weakness will undermine those trades that appear to be holding water. I prefer to see the clarity that a breakout brings- a line in the sand for the trade.
I was refilled on VZ today after a 1 day stop-out. and T took a new position today, as both moved out of a sideways consolidation.
I had been on the sidelines until a few weeks ago when I chose to reenter the market- The majority of those trades were heading in the right direction, and then the market shifted, and most stopped out- For losses I should add.
As the past weeks have shown, the market appears to have possibly peaked, concerns about Europe have arisen anew.
Even AAPL is pulling back- and this supports the thesis that a sector rotation is occurring-
Well, I'm not going to cry about my timing in getting back -'involved- I'm going to focus on stocks that are trending higher-
One of the big mistakes I have made in the past, is to not allow my winning trades to run.
As the market rolls over, and weakness is displayed, one never knows when that weakness is the first sign of a 20% pullback-
So, Along with exiting on price weakness, is the reentry on price strength- SD
|
|
|
|
Post by sd on May 12, 2012 12:37:58 GMT -5
With my interest to get back into some trading combined with sliding into May, and the mkt clearly dropped what was a smooth compusure, I sustained losses on most of those trades- Some were controlled better than others I will admit. I was inspired to include COST as a trade that suggested it was 'defensive' in it's customer orientation, I had actually watched a CNBC report on Cost, and I figured, I need to focus on this consumer favorite- It had just hit a new high, had an initial pullback, that I took to be the 1st sign of a reversal, and took an entry on the second higher reversal. I gave this and many of the other trades I normally did in the past- wanting to cultivate a series of positions that I could possible develop into longer term trades. The loss was a controlled 3% or so on this trade- I will keep COST on a watchlist and see how it performs in the days ahead for a possible reentry- SD 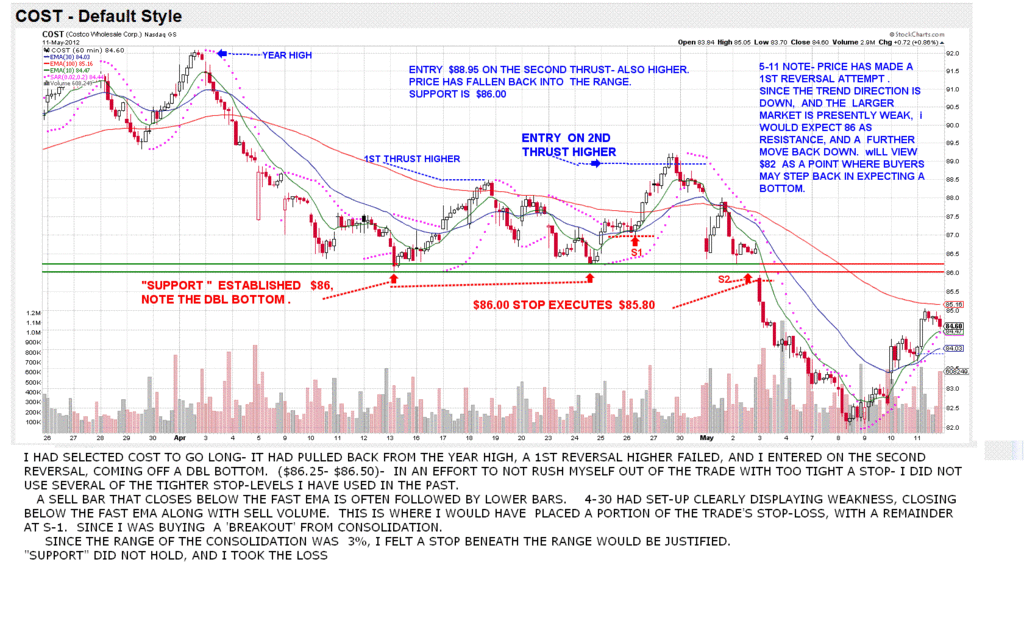 |
|
|
|
Post by sd on May 12, 2012 13:07:06 GMT -5
I reentered the VZ trade Friday, along with a position in T. Both were buy-stop entries, requiring price to push higher, out of consolidation. Including the 5-11 60 min, and the prior weekly chart. 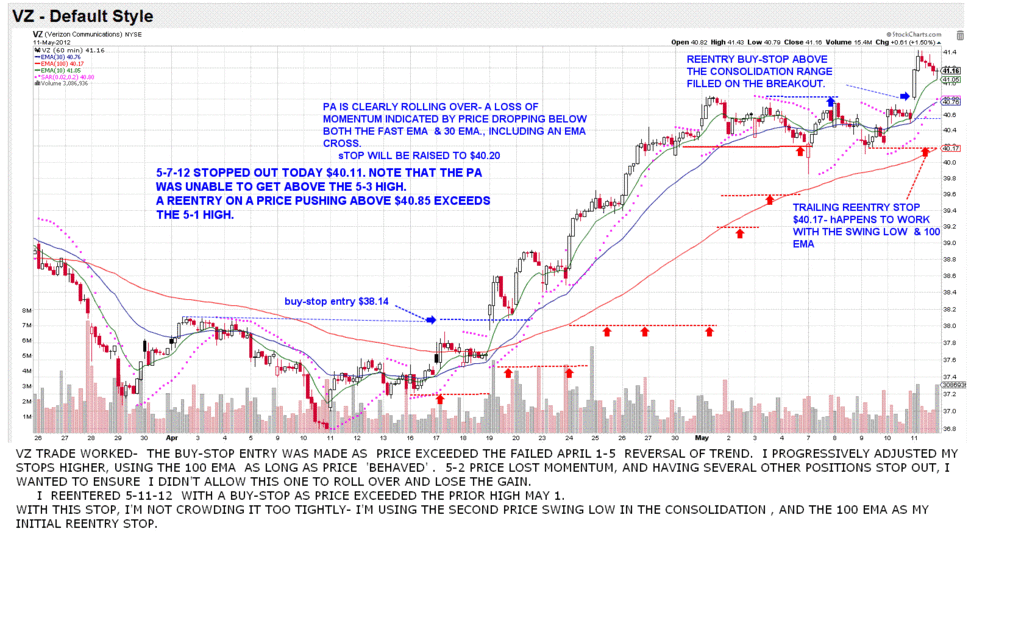 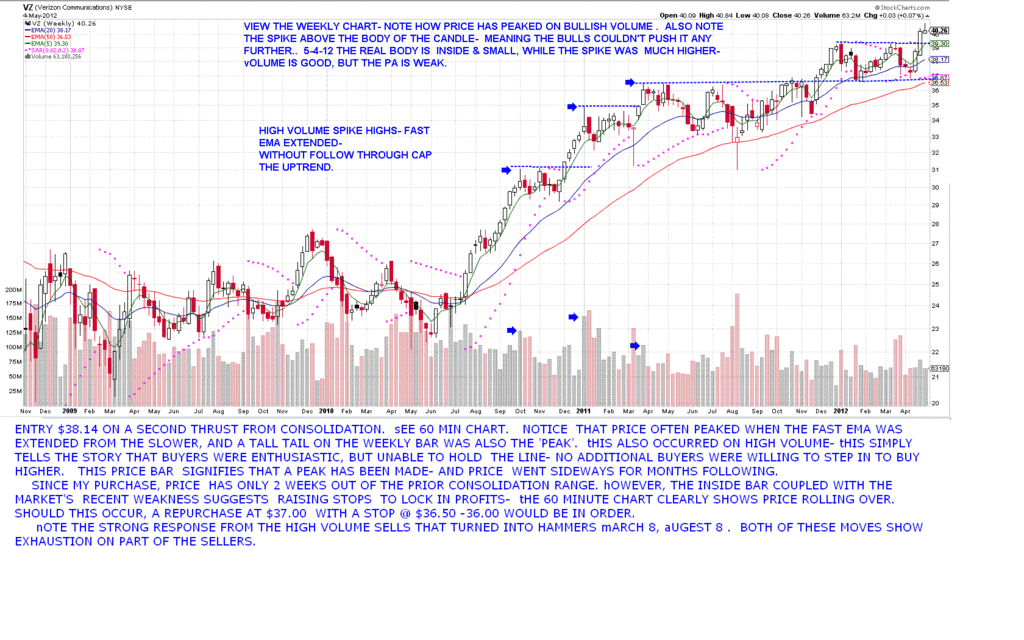 |
|
|
|
Post by sd on May 12, 2012 15:56:51 GMT -5
T IS PERFORMING SIMILARLY WITH VZ iT HAS JUST BROKEN OUT TO A NEW HIGH EXCEEDING THE 2008 WEEKLY HIGH. iT APPEARS TO BE IN THE UPPER SIDE OF THE UPPER TREND CHANNEL. SINCE 2009, THE STOCK HAS BEEN TRENDING GENERALLY HIGHER, WITH PERIODS OF PULLBACKS AND CONSOLIDATIONS- 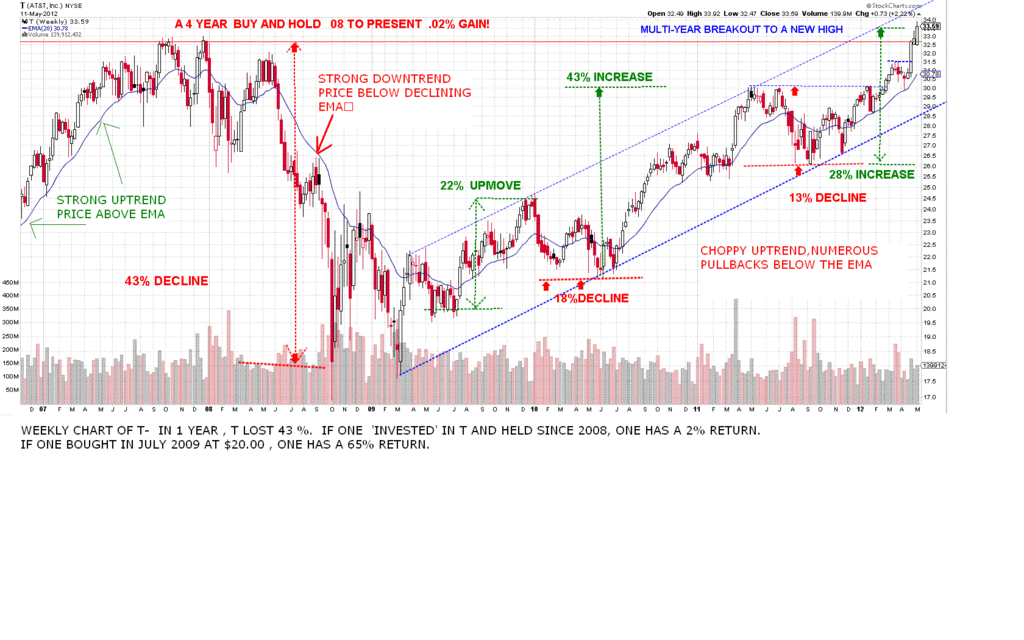 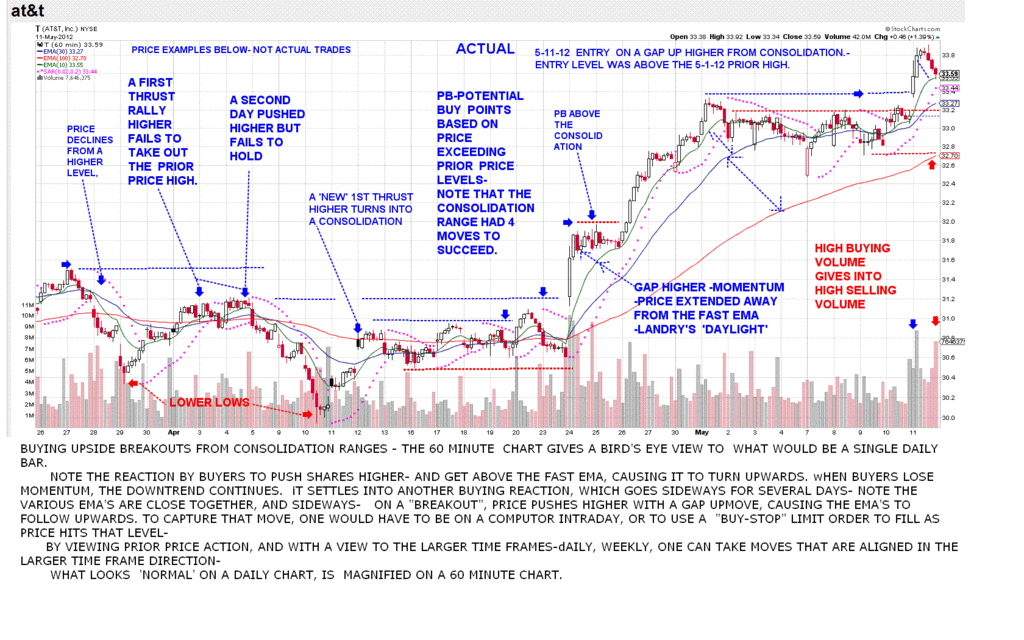 |
|
|
|
Post by sd on May 12, 2012 17:21:59 GMT -5
A Weekly chart of PFE analyzing the Par Sar indicator & it's usefullness as a 'buy and Sell" indicator- I use it occaisionally as a reference while viewing Price Sar needs to be used only in trending markets, and every signal is not valid- Sar will progressively close in on price, and generate stop levels very close to price action. One can analyze this indicator to see if it would backtest against one's positions & type of trading-. Whipsaw signals can occur on price action. Sar does a good job in a declining mkt usually -, price needing to exceed the declining Sar level to generate a 'BUY' signal. Stockcharts has a good ed section if one is interested stockcharts.com/school/doku.php?id=chart_school:technical_indicators:parabolic_sar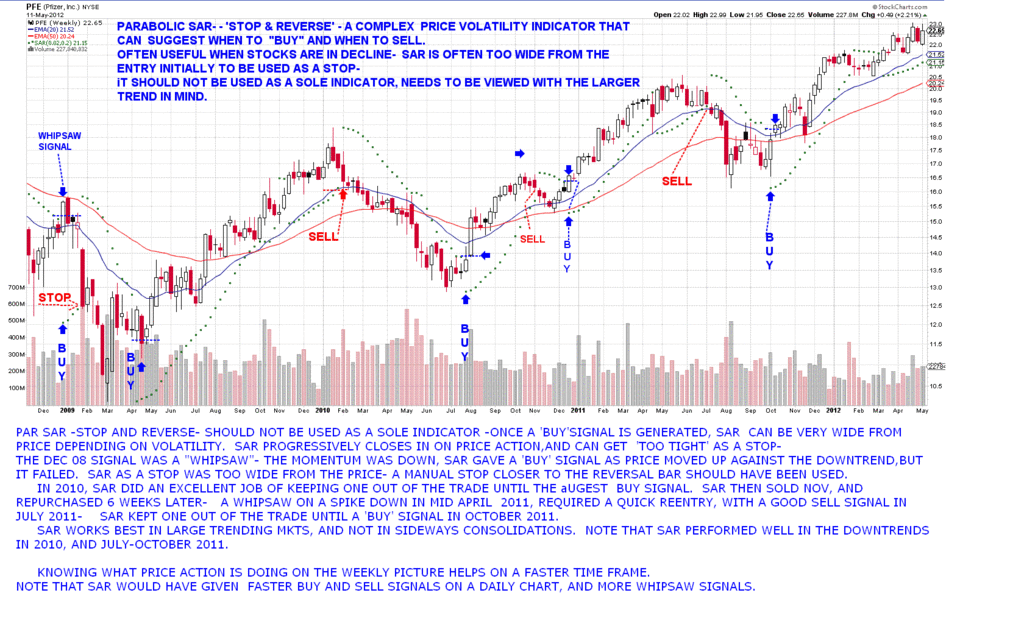 |
|
|
|
Post by sd on May 13, 2012 9:22:50 GMT -5
Following up Bankers posts on April 29-pg 4 of this thread. His "simple" strategy works- as noted it would keep one out of the market the majority of the downtrends, and a rentry on uptrends. There are some other charting techniques that smooth price action- They can be described in the Stockcharts Ed section stockcharts.com/school/doku.php?id=chart_school:chart_analysis:heikin_ashiAlso Renko charts- The Heiken Ashi averages 2 bars to make 1- The renko plots equi sized bricks - These charts are also interesting- They also would have saved much of the 'damage' suffered by long term holder The 'issue' is for that level of safety, one isn't getting back in near the bottom- but one's cash is intact, and one catches the majority of the trend. One would have to backtest how they would actually respond in real time to the chart exit and entry signals- As Banker noted, some would find the lag or time out of the market difficult- Options could include- applying a reduced portion of one's trading to a weekly chart, find a non-correlated investment- perhaps a bond fund, reit, mlp- that would be performing positively when the market was down. One could potentially profit without being "short" the market by shifting the asset allocation. Finding adequate non-correlated investments would take some research-because even Gold took a substantial nose dive in the 2007-8 turn down, but recovered more quickly. One does not have to literally exit one's entire position- Shifting asset allocations from Riskier to less risky is also an approach to reduce Risk. However, one needs to look back at the bear in 2008 to realize there was no place to hide- except in a money market account- There's a lot more to look at when one anticipates how their long term investments should be managed. I increased my Bond exposure again last week, but I think I will be slowly increasing in the fund I can select for- 'value-dividend . SD 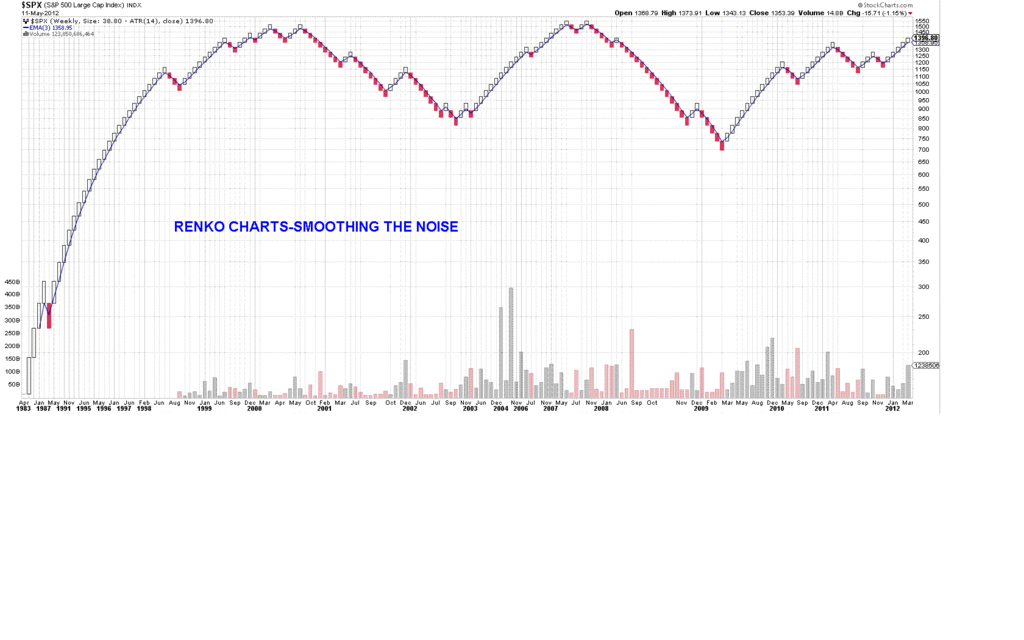 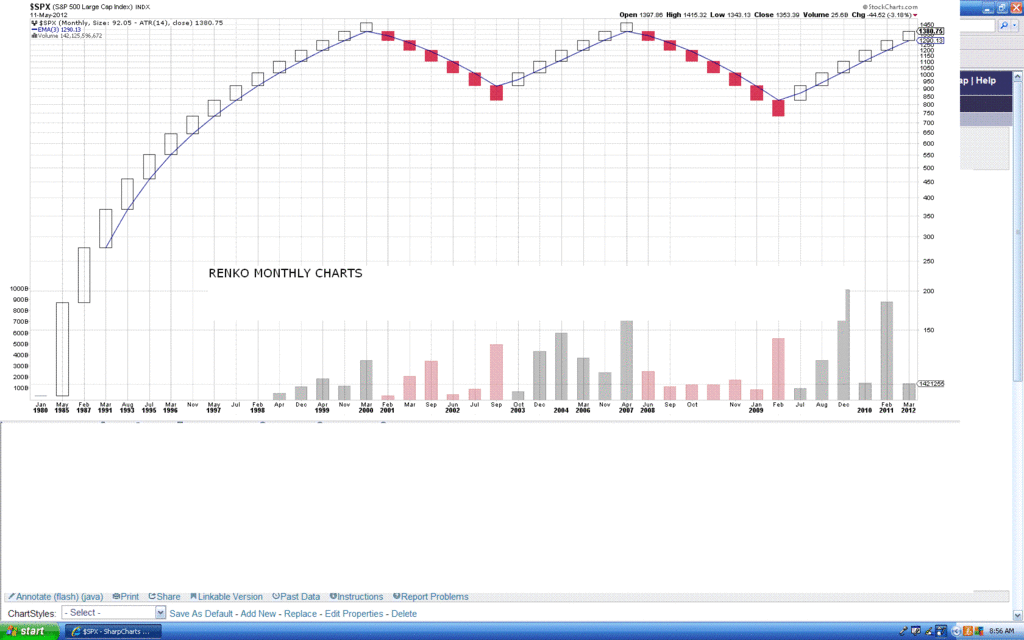 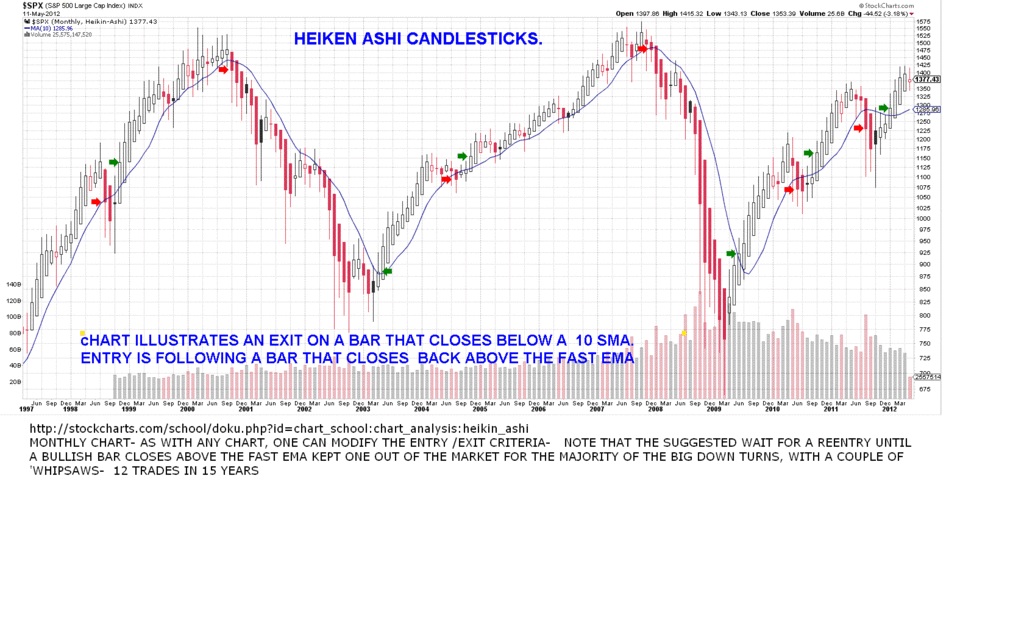 |
|
|
|
Post by sd on May 13, 2012 17:27:41 GMT -5
One of the limitations of not having a lot of free time to research stocks is managing what available time is there- presently, I'm looking to stocks that are showing strength, and that can be found by looking at some of stockcharts predetermined scans, and clicking on the individual charts. Another tool available there is a quick glance at 12 charts at a time-There is a pulldown menu to select from some preset groups, or you can add your own. In this case, I selected the dropdown 'sector etf's' under the Indicator section, I played around with Stoch, RSI etc, and then chose the price relative. It compares the performance of each stock to the performance of the $spx- Approx 1/2 of the group is in decline, and trending down. This is easily determined by the position of the fast to slower ema, and direction. In the other groups, the ma's are looking OK, from sideways to slightly up- However, price on 4 of the 5 is below the fast ema- which will cause the fast to start to turn down if it continues. There is 1 group that is obviously outperforming, with an upturned fast ema, price climbing above that ema- and that is the XLU. Thus, some sector strength may be found in the Utilities- and the stocks making new 52 week highs have some utilities included. Utilities are generally seen as a defensive position - There are other selections and ways to view other segments- It appears to be a useful amount of information on one page. stockcharts.com/freecharts/candleglance.html?$INDU,XLY,XLK,XLI,XLB,XLE,XLP,XLV,XLU,XLF|B|J[$SPX] 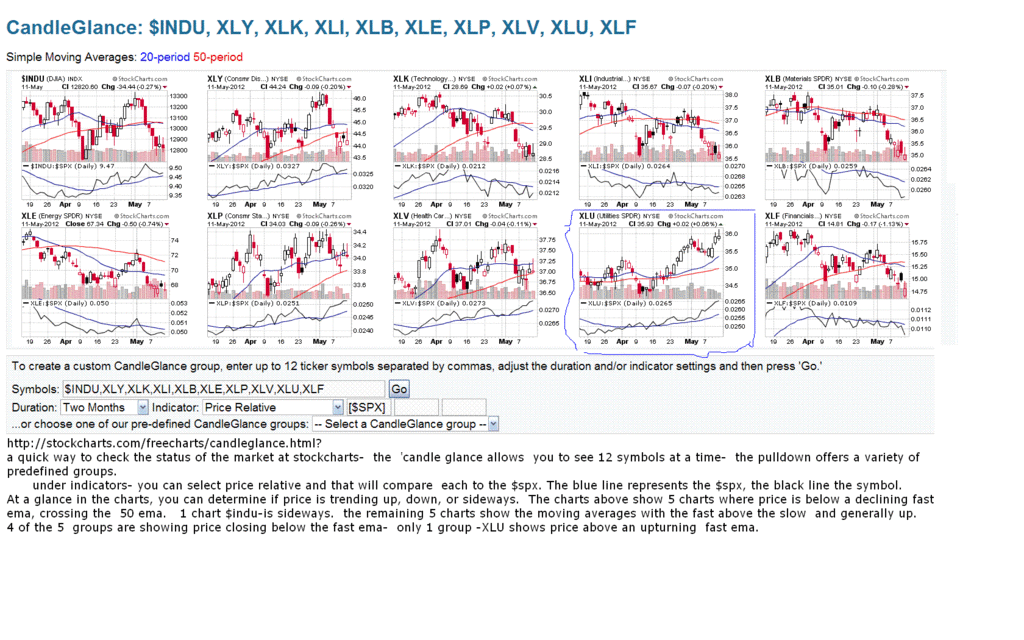 |
|
|
|
Post by sd on May 20, 2012 21:36:45 GMT -5
I will admit this market is declining more than I expected- This has indeed made "go away in May" log in another year for mkt truisms being right after all- As I came back into activity in the last weeks of April, I chose to focus on stocks that were showing strength in a choppy market- I really didn't expect the mkt to weaken as much as it has. I was surprised by the stops I had being hit in HD, FRT, and others that were trending well initially- It's as though they hit a wall, and rolled right over- Timing is everything they say.... Can't 2 step either- I', long T , I have a reentry on VZ long after a text book entry & sell , and am heading for cover with CHD- with a raised stop- I did choose to buy 1 share of aapl- Friday- got filled at 534.90- expecting a bounce near 520, didn't want to play it too tight- Stop @ 499.00. call it a study trade- Gold finally put up a 2 day rally- Make no mistake, the trend is down, but perhaps this rally/1st thrust higher/ can garner some strength. I'm using a buy-stop to enter 155 with a 156 limit and a stop at 151.90. This buy only shows up as justified on a 60 minute chart, but it's a controlled relatively narrow stop-After all the sell-off, I expect we are due for a snap back relief rally- which may not hold- When I have time, I will update some of the prior trades charts- In all of these, the tighter stops turned out to be the smarter stops- With that said, I had lesser losses perhaps-but some losses none the less. but had I switched to trading with the predomin 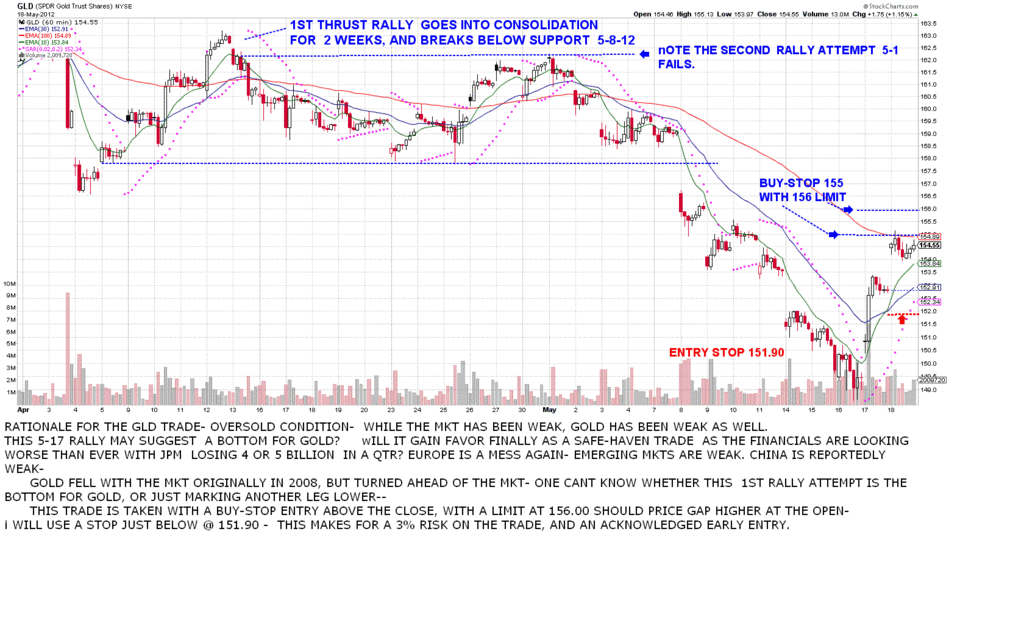 ant trend -as Blygh has done- instead of searching for strength in the weakness- .... but that is spilt milk at this point- I'd be hesitant to go short now- we have to be very oversold-? or do we crash lower/ ? but truly this market amazes me in how it can ignore Europe for months on end, and then suddenly think it's the next big crack in the wall. So, Do we repeat 2008, or are we at the verge of a 3 year buy opportunity? Don't know the answer- Heavy in Bonds & cash in the main IRA at this time- SD |
|
|
|
Post by sd on May 28, 2012 15:46:49 GMT -5
As the Dollar is reaching a momentum high, it is the 'Safe Haven' trade de jour. added to by the Euro weakness- With the issues of the huge US debt, one can only wonder how far the dollar will be propped up- - I'm not sure of how tight the correlation is with a weak dollar being good for stocks, and a strong dollar bad for Gold/silver- At some point- Investors will get wary of the dollar- The attached chart shows the $USD, GLD,SLV,SPY. GLD is potentially at a support level here- dbl bottom on the 60 min. 2 days ago. CEF is a canadian company that reportedly actually holds both 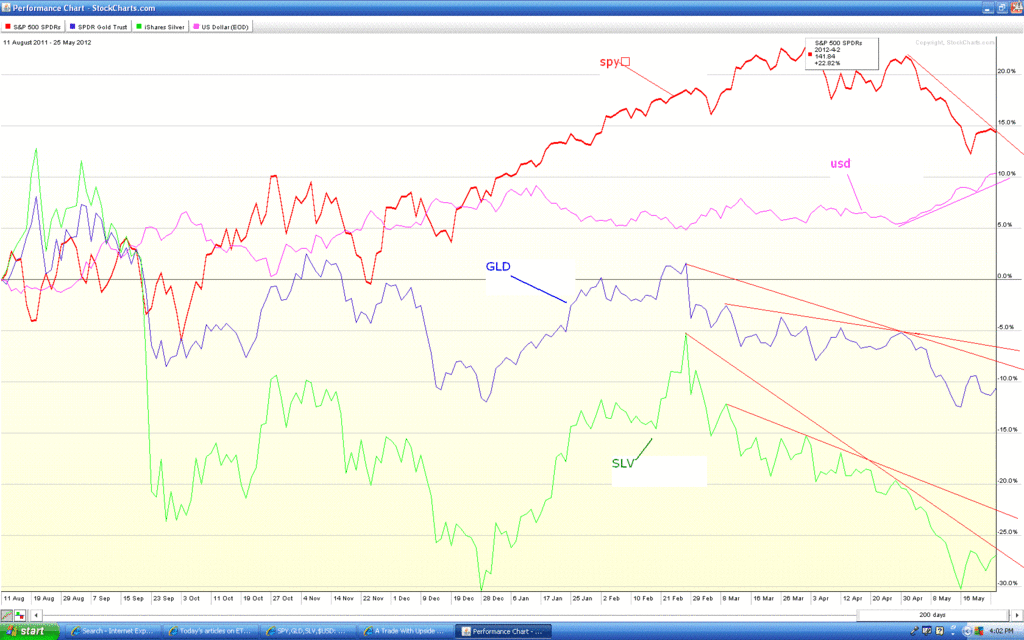 Gold and Silver bullion- Chart wise, it trades midway between gld and slv.. |
|
|
|
Post by sd on May 29, 2012 19:51:56 GMT -5
Time for a quick update- I commented on Bankedout's journal tonight- citing the market weakness.
We've had a larger pullback than most anticipated - and May is not yet over.
About 6 weeks ago, I became semi active again, and made some overly optimistic trades, that the "GO AWAY IN MAY" CONCEPT should be branded on my left arm.
In truth, I made some "discretionary trades" that is double speak for "I know better than the market" .
As I sought to bring this new wave of activity into sync with the market , and get my awareness up to speed, I decided i would try to start a focus on stocks that showed strength into the weakness-. I'm actually hoping to germinate some long term trades invitro here- with a view of both the daily chart and the 60 minute chart.
As one of the previous posts explained- a look at the market segments showed most were in decline-.
Choosing from stocks that had recently made a 52 week high seemed to make sense-
My one best example of a successful trade is VZ using a 60 minute chart for a good early -low risk entry, an exit on weakness, and then a re-entry on strength.
I raised the stop on this trade as the market was selling off and I was stopped out- I had a net 5% gain- I took a reentry as price again moved higher while some of my other trades declined.
I lost out on less than 1% on the difference between the sell price and the reentry price. I kept the 5% profit intact, and hope to see an additional 5% move higher.
T is a similar stock and sector- where i recently entered=-
The goal is to get the stop-loss to a break-even level -hopefully quickly -price willing.
Here's the "issue" - I'm chasing sector rotation -looking for relative safe haven plays as defined by the market- Why fight the market trend?
The VZ trades (2) have worked out in my favor-
But only because I've applied a 60 minute chart- My goal is to make this a long term trade- as long as the price action continues higher.
T is similar, and i put an entry in there.
A number of the other 60 minute trades rolled over and dropped significantly.
My partial reentry in AAPL coincidentally was on the day of the pullback low-($535 entry ) That was a contrarian entry (gamble) on an oversold pullback. I still have a buy-stop order . for additonal Buys @ $576.50- I need to revisit that order.
CHD has been an exceptionally strong long term performer the past years- I don't think I have ever heard of the name-
I took a 1st entry and stopped out, but just reentered the trade-
Other trades I was considering- GLD- Gold has been in decline and it looks as though it may have based at a support level-
It does not look like it is ready to rally here- just a bounce off support @ 149.00- I was ready to take an entry with a 148 stop-loss, but it appears the dollar is the go-to- safe haven trade- someday, the market will wake up and decide the dollar is not all it claims to be- Perhaps that will be the time for Gld to shine again.
In the interim, is this summer a replay of 2011? It was choppy as hell , if one remembers, with 500 pts swing for a while-
The only salvation was a day-trade mentality - flipping on weakness. I can't participate in such an environment, and would best stand aside.
Meanwhile, I will continue to try to limit my impulsive side,
and try to focus on stocks that appear to be gaining strength in spite-or because -of the present weakness.
SD
|
|
|
|
Post by blygh on Jun 1, 2012 20:58:48 GMT -5
I think the gold move will be short lived - It is a psychological commodity - only valuable because a lot of people think it is valuable - but it does remain a safe haven. I am betting on deflation - Why else would TLT perform so much better than TIP? Only because there is no inflation - well maybe some in food but certainly none in housing, energy, transports, utilities.
|
|