|
|
Post by blygh on Jan 16, 2017 14:36:26 GMT -5
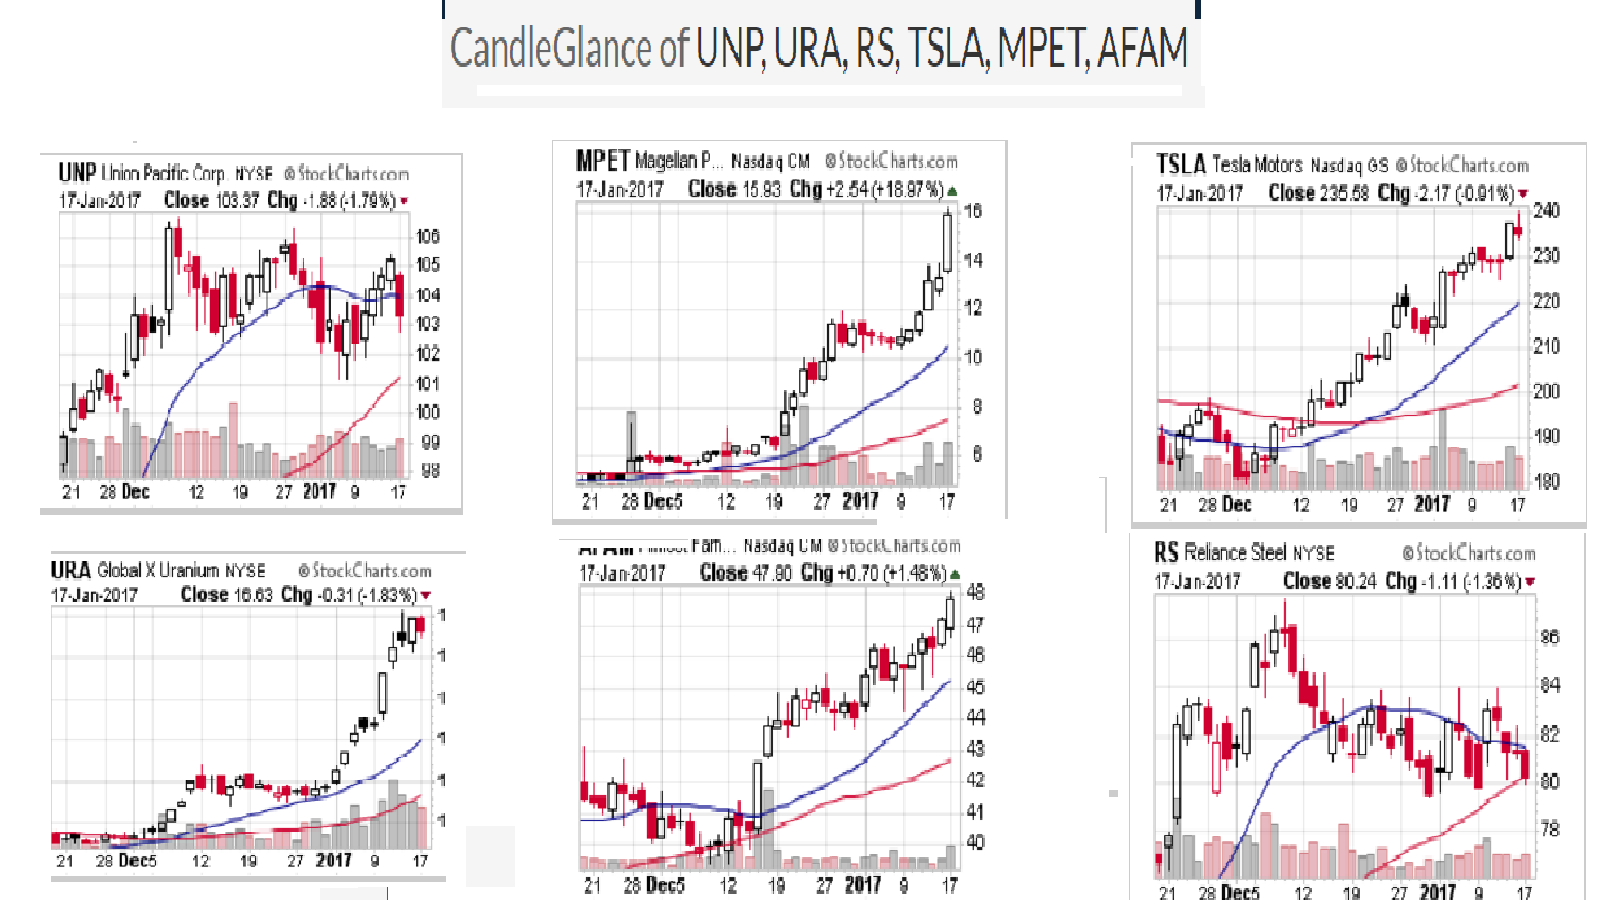
 Out of the Gate !!! Out of the Gate !!! | Rider | Horse | Open | Latest | G/L | % | Stop | | Rank | | 1 Tiarra | UNP | 104.70 | 103.37 | -1.33 | -1.27% |
|
| 5 | | 2 Ira | URA | 16.94 | 16.63 | -0.31 | -1.83% |
|
| 7 | | Spiderman | MPET | 13.62 | 15.93 | +2.31 | +16.96% |
|
| 1 | | 4 SD | TSLA | 236.70 | 235.58 | -1.12 | -0.47% | 227.40 |
| 4 | | 5 RealDeal | RS default | 81.35 | 80.24 | -1.11 | -1.35% |
|
| 6 | 6 Blygh
| AFAM | 47.20 | 47.90 | +0.70 | +1.48% |
|
| 2 | | Market | SPY | 226.31 | 226.25 | -0.06 | 0% |
|
| 3 | | 8 | QQQ | 122.79 | 122.79 | 0 | 0% |
|
|
|
|
|
|
|
Post by sd on Jan 17, 2017 20:42:59 GMT -5
bit of a delay- After Day 1 - What's up with MPET!A 
|
|
|
|
Post by blygh on Jan 18, 2017 16:44:24 GMT -5
  Into the back stretch Into the back stretch | Rider | Horse | Open | Latest | G/L | % | Stop | | Rank | | 1 Tiarra | UNP | 104.70 | 103.77 | -0.93 | -0.89% |
|
| 5 | | 2 Ira | URA | 16.94 | 15.37 | -1.57 | -9.27% |
|
| 7 | | Spiderman | MPET | 13.62 | 13.15 | -0.47 | -3.45% |
|
| 6 | | 4 SD | TSLA | 236.70 | 238.36 | +1.66 | +0.70% | 227.40 |
| 1 | | 5 RealDeal | RS default | 81.35 | 81.88 | +0.53 | +0.65% |
|
| 2 | 6 Blygh
| AFAM | 47.20 | 47.15 | -0.05 | -0.11% |
|
| 4 | | Market | SPY | 226.31 | 226.75 | +0.09 | 0% |
|
| 3 | | 8 | QQQ | 122.79 | 123.04 | +0.02 | 0% |
|
|
|
|
|
|
|
Post by sd on Jan 18, 2017 21:22:15 GMT -5
Mpet had a huge 1 day move higher- and an even bigger 1 day decline! How do you even attempt to trade with this kind of roulette volatility in this area? This would be a candidate for a very aggressive trailing stop-loss .
As I look at this chart, the prior moves did not show this kind of volatility. and, this had over 1 M volume-
|
|
|
|
Post by sd on Jan 18, 2017 21:29:53 GMT -5
just pointing out the "value" of following a trade that is trending - and some emas assist .
TSLA has been trending higher since Dec 1, with only a few slow pullbacks under the fast 4 ema, and never a close below the 10 ema .
This is a 6 weeks uptrend!!! HOw come we are Not all in TSLA? Do we understand Trend? Do we trade WITH Trend? Do we understand Trend? Do we trade WITH Trend?
Just asking.....i am long TSLA
|
|
|
|
Post by blygh on Jan 19, 2017 16:19:44 GMT -5

Out of the clubhouse turn and heading for home | Rider | Horse | Open | Latest | G/L | % | Stop | | Rank | | 1 Tiarra | UNP | 104.70 | 106.24 | +2.24 | +1.47% |
|
| 2 | | 2 Ira | URA | 16.94 | 15.94 | -1.00 | -5.90% |
|
| 7 | | Spiderman | MPET | 13.62 | 13.30 | -0.32 | -2.35% |
|
| 6 | | 4 SD | TSLA | 236.70 | 243.75 | +7.05 | +3.00% | 227.40 |
| 1 | | 5 RealDeal | RS default | 81.35 | 79.94 | -1.41 | -1.73% |
|
| 4 | 6 Blygh
| AFAM | 47.20 | 46.15 | -1.05 | -2.23% |
|
| 5 | | Market | SPY | 226.31 | 225.91 | -0.40 | -0.177% |
|
| 3 | | 8 | QQQ | 122.79 | 122.98 | +0.19 | 0.155% |
|
|
|
|
|
|
|
Post by blygh on Jan 19, 2017 17:46:43 GMT -5
Why does every one not hold TSLA? Well, 21% of the shares are shorted. Who shorts stocks? The retail investor? Don't think so. The professional institutional investors hold most shorts. These are the people with the best information and the most sophisticated analytic tools. I personally avoid stocks with more than 5% of shares shorted and prefer them with less than 3% of shares shorted. Every once in a while you see a price rise in a short squeeze but that is a rarity. TSLA may be in one but the last positive P/E ratio was 254 to 1. One columnist I read said that wealthy investors were buying it for their grand children and great grand children - kind of like buying Ford in 1911. Someday it will make a lot of money but right now it is a short term trading buy/sell my sell point is 220. I buy at 190 - double down at 180.
|
|
|
|
Post by sd on Jan 19, 2017 21:18:25 GMT -5
It was really more of a rhetorical question on my part-(This is a 6 weeks uptrend!!! HOw come we are Not all in TSLA? ) )
That was based solely on a stock that was trending higher, with closes above an uptrending ema-
My rationale in holding TSLA-for now-is strickly short term as it is trending -and it is not for my grandkids- For me, it's a momentum position that has not violated the uptrend- Give it one close under the fast ema, and my stop gets ratcheted higher under that low -or on the ema just below that low-It is not a long term hold- and maybe is getting the benefit of shorts covering their losses as the source of this recent momentum.
I like your analysis on short positions- i think TSLA can get to the prior $250-255 and hits resistance there-the basing that occurred back in April-may 2016 marking a swing high- 
As or buying Ford back in 1911 for the long term- How many other prospective car mfg's rose and burned along the years-I guess buying Ford- or any of the auto maker upstarts back then, would be like buying a biotech today- Pick the right one, and you will be richly rewarded- Pick one of the many wrong ones- and see your seed money wither and die as those companies vanish into oblivion- only remembered by those that lost a large part of their life savings taking on a single stock bet.
looking at today's price action- a gap open higher, but closing lower- gap still intact-This was a momentum leap- higher- stretching the rubber band away from the "Normal" - i think this may indicate we are at-or close-to a short term top here- so I will tighten my stop-loss to $240.00 just below today's low. instead of waiting for weakness- i also am trying to recognize when momentum suggests we have gone too far- When price diverges from the Norm- and shows excess momentum- it usually is not sustained for many days more.
Additionally, although price gapped higher- there is not a corresponding widening reflected in the momentum indicator- continues to narrow- price move
EXCEEDED 10% ABOVE the slower 20 ema- an unusual higher spread. Ideally, this price widening will continue for another day or three-
my closest short term support would be 233 - and that is indeed short term.
i will be putting my stop at $240.00 -just under the low of today's bar
|
|
|
|
Post by sd on Jan 20, 2017 15:43:38 GMT -5
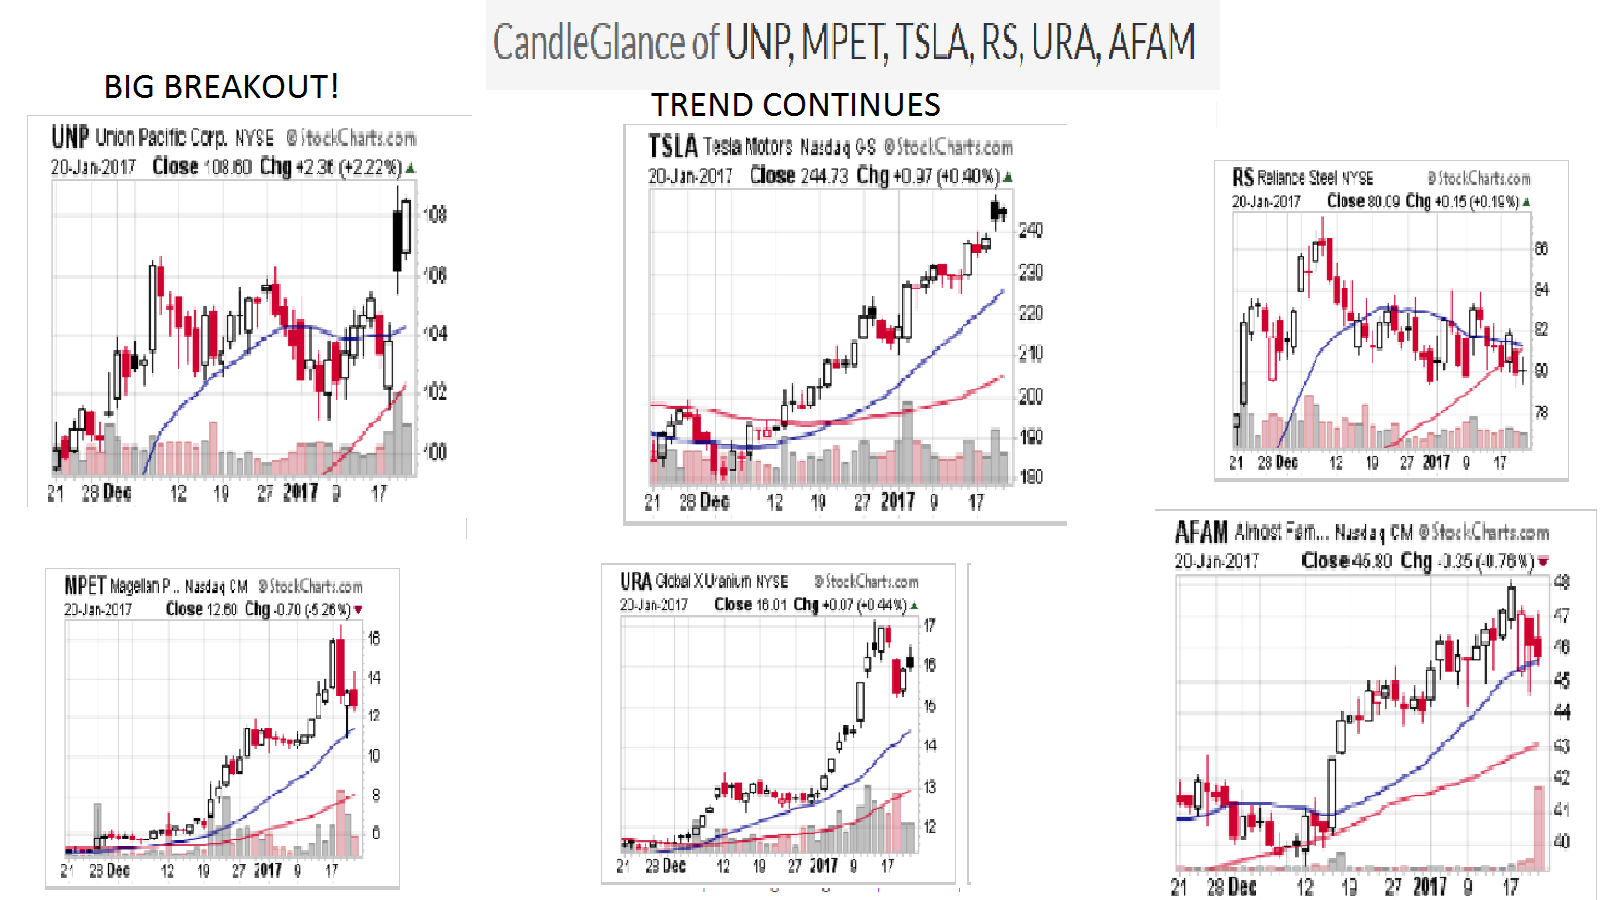
I'll stay long TSLA at today's closing price- It held up well, my raised stop was not taken out- Good luck!
|
|
|
|
Post by blygh on Jan 20, 2017 15:48:55 GMT -5
I agree with your momentum play SD. I always check the MACD usually on a 10/30 ema. Buy a golden cross - short a death cross .
Blygh
|
|
|
|
Post by blygh on Jan 20, 2017 17:28:14 GMT -5

Across the finish line in a photo finish | Rider | Horse | Open | Latest | G/L | % | Stop | | Rank | | 1 Tiarra | UNP | 104.70 | 108.60 | +$3.90 | +3.73% |
|
| 1  | | 2 Ira | URA | 16.94 | 16.01 | -$0.93 | -5.81% |
|
| 7 | | Spiderman | MPET | 13.62 | 12.60 | -$1.02 | -7.49% |
|
| 6 | | 4 SD | TSLA | 236.70 | 244.73 | +$8.03 | +3.39% | 227.40 |
| 2 | | 5 RealDeal | RS default | 81.35 | 80.09 | -$1.26 | -1.55% |
|
| 4 | 6 Blygh
| AFAM | 47.20 | 45.80 | -$1.40 | -3.00% |
|
| 5 | | Market | SPY | 226.31 | 226.74 | +$0.43 | +0.19% |
|
| 3 | | 8 | QQQ | 122.79 | 123.25 | +$0.46 | +0.38% |
|
|
|
|
|
|
|
Post by blygh on Jan 20, 2017 18:06:22 GMT -5
Total Return in 2017
| Rider | Win | Place | Show | Total Return | Default pick | | Tiarra | 1 |
| 1 | -0.461% | ETSY | | Ira |
|
|
| -6.074% | LMT | | Spiderman |
| 1 |
| -8.323% | EXAS | | Real Deal |
|
|
| -2.18% | RS | | SD | 1 | 1 |
| +4.062% | CURE | | Blygh | 1 |
|
| +4.682% | ISRG | | Market (SPY) |
| 1 | 2 | +0.951% |
|
I bought Total Return out to 3 decimal places because a very small change can have significant effect after 52 weeks as a multiplier of 51 other values |
|
|
|
Post by sd on Jan 20, 2017 18:26:39 GMT -5
I agree- i particularly like to apply the MACD histogram as an early tell to determine when momentum is slowing- It's a very useful graphic - both when price is declining and when price may be improving in a decline- I find that the 12-26-9 standard setting can often benefit to be made more responsive,by making changes to the settings to better match to price turns-depending on the time frame one prefers.
but that added responsiveness also comes with a "price" . Stockcharts also has the PPO and PMO which are indicators based on the MACD - but in a % interpretation- While i believe indicators can indeed be important tools to interpret price action- the graphic- Price, and trend tells the story as the primary indicators...
|
|
|
|
Post by sd on Jan 20, 2017 18:34:35 GMT -5
Congrats Tiarra! That was quite a rally!
here's how we all finished....
|
|
|
|
Post by Spiderman on Jan 22, 2017 7:49:59 GMT -5
Congrats Tiarra.
I'll stay on MPET long.
Spiderman
|
|