|
|
Post by blygh on Jan 1, 2017 17:33:04 GMT -5
| Rider | Horses | Open | Last | Gain/Loss | % | Stop | Limit | Rank | | SD | EEM | 39.56 | 41.12 |
| +3.94% |
|
|
| | 4 | HEDJ | 62.88 | 63.71 |
| +1.32% |
|
|
|
| SPY | 225.04 | 266.86 |
| +18.58% |
|
|
|
| SLV | 17.25 | 15.99 |
| -7.30% |
|
|
|
| QQQ | 119.2 | 155.76 |
| +30.67% |
|
|
|
| CASH |
|
|
|
|
|
|
|
| AVERAGE | RETURN |
|
| +9.442% |
|
|
| | Blygh | AIG | 65.95 | 58.59 |
| -11.16 |
|
|
| | 3 | JEC | 57.69 | 65.9 |
| +14.23 |
|
|
|
| BAC | 22.60 | 29.52 |
| +30.62 |
|
|
|
| CRUS | 56.99 | 51.86 |
| -9.00 |
|
|
|
| GLW | 24.40 | 31.99 |
| +31.11 |
|
|
|
| CASH |
|
|
|
|
|
|
|
| AVERAGE
| RETURN |
|
| +11.16% |
|
| 4 |
|
|
|
|
|
|
|
|
| | ***** | ***** | ***** | ****** | ******* | *** | ****** | **** |
| | Tiarra | MON | 105.45 | 116.78 |
| +10.74% |
|
|
| | 2 | NVDA | 104.40 | 193.50 |
| +85.34% |
|
|
|
| CHK | 7.20 | 3.96 |
| -45.00% |
|
|
| | - | OGS | 64.11 | 73.26 |
| +14.27% |
|
|
|
| AM | 31.22 | 29.04 |
| -6.98% |
|
|
|
| CASH |
|
|
|
|
|
|
|
| AVERAGE
| RETURN |
|
| +11.67% |
|
|
| | Spiderman | ADP | 102.38 | 117.19 |
| +14.47 |
|
|
| | 1 | ATVI | 36.44 | 63.32 |
| +73.77 |
|
|
|
| CALM | 44.00 | 44.45 |
| +.0123 |
|
|
|
| DLR | 98.89 | 113.96 |
| +15.24 |
|
|
|
| NVEC | 71.73 | 86.00 |
| +19.89 |
|
|
|
| CASH |
|
|
|
|
|
|
|
| AVERAGE
| RETURN
|
|
| +24.68 |
|
|
| | ******** | ******* | ******* | ****** | ****** | **** | ****** | *** | * | | Ira | FLAG | 39.33 | 42.65 |
| +8.44% |
|
|
| | 5 | FRN | 11.63 | 14.85 |
| +27.69% |
|
|
|
| SMLF | 35.78 | 39.52 |
| +10.45% |
|
|
|
| ORN | 10.09 | 7.83 |
| -22.40% |
|
|
|
| FDM | 44.51 | 47.45 |
| +6.605% |
|
|
|
| CASH |
|
|
|
|
|
|
|
| AVERAGE
| RETURN |
|
| +6.157% |
|
| 5 |
| ******* | ******* | ******* | ******* | *** | ******* | *** | * | | MARKET | SPY | 225.24 | 266.94 |
| +18.51 |
|
|
|
| QQQ | 119.54 | 155.67 |
| +30.22 |
|
|
|
|
|
|
|
|
|
|
|
|
|
|
|
|
|
|
|
|
|
|
|
|
|
|
|
|
|
|
|
|
|
|
|
|
|
|
|
|
|
|
|
|
|
|
|
|
| ******* | ****** | ******* | ******* | **** | ******* | **** | * |
|
|
|
|
|
|
|
|
|
|
|
|
|
Post by sd on Jan 1, 2017 19:35:42 GMT -5
|
|
|
|
Post by sd on Jan 2, 2017 18:37:13 GMT -5
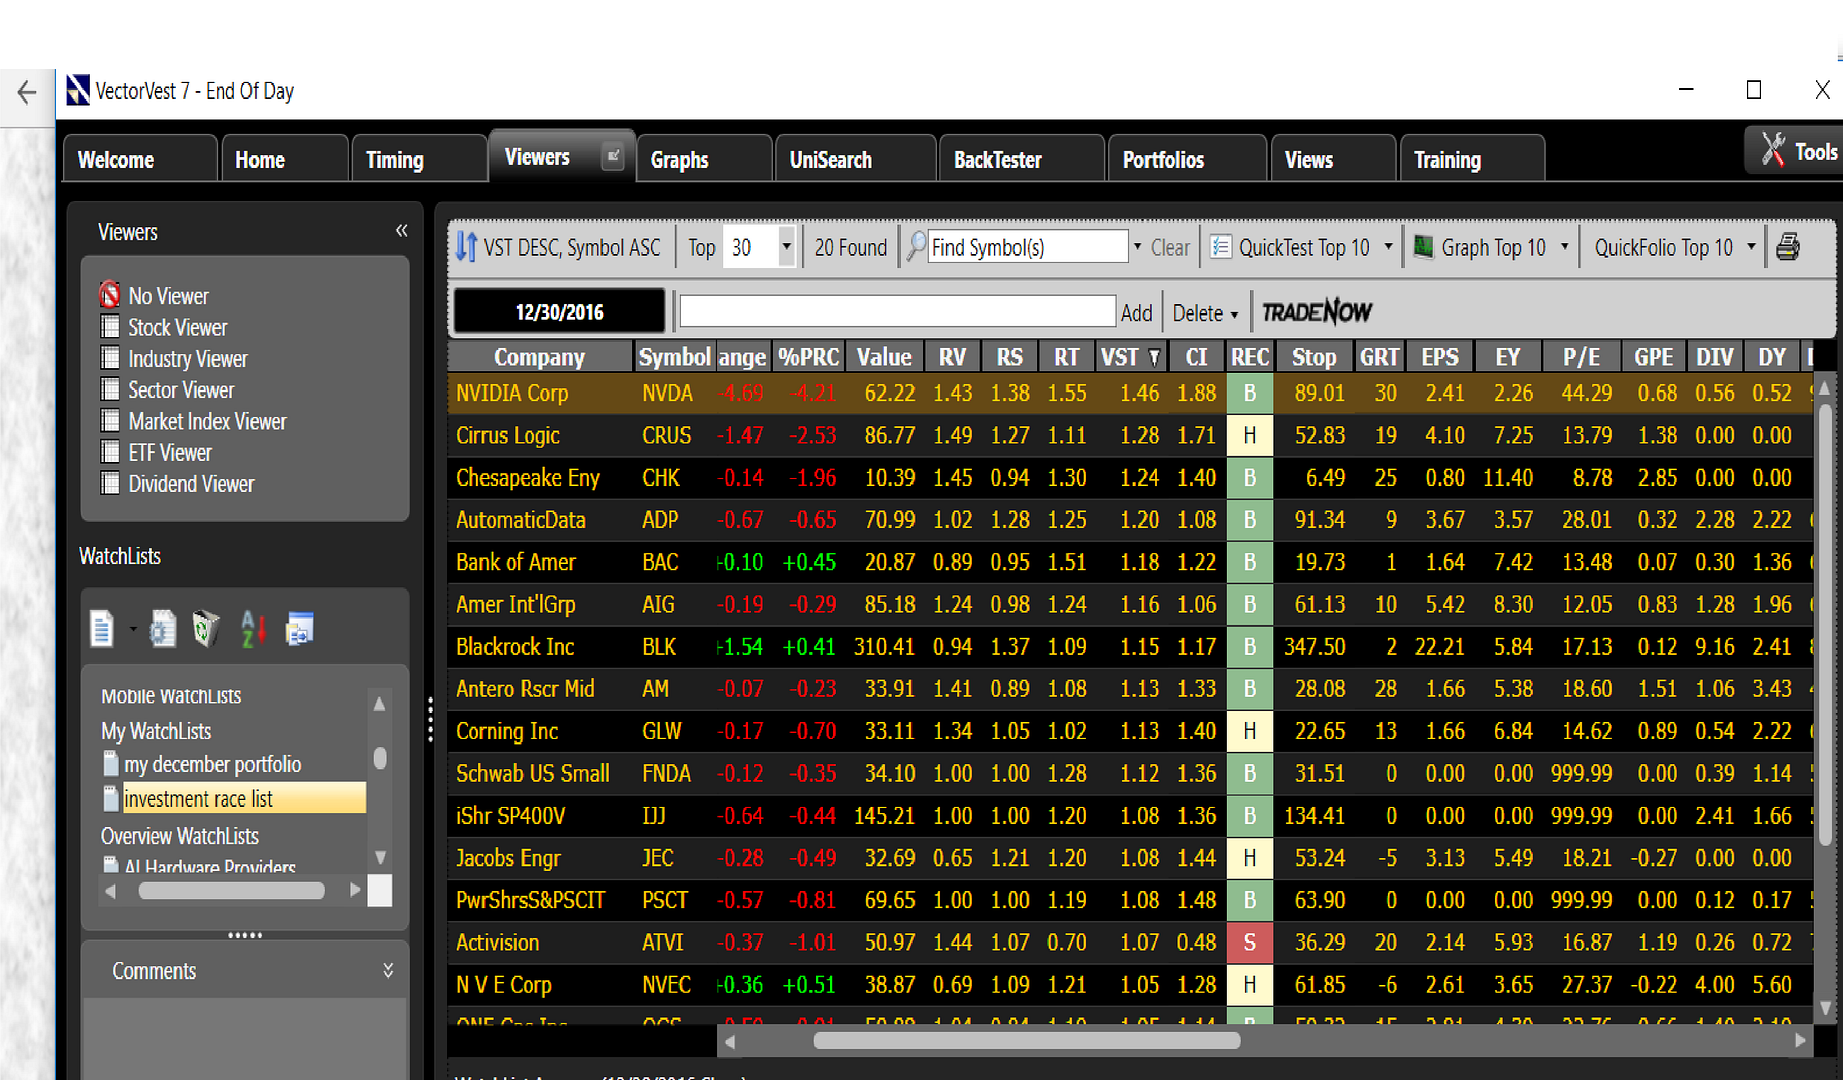
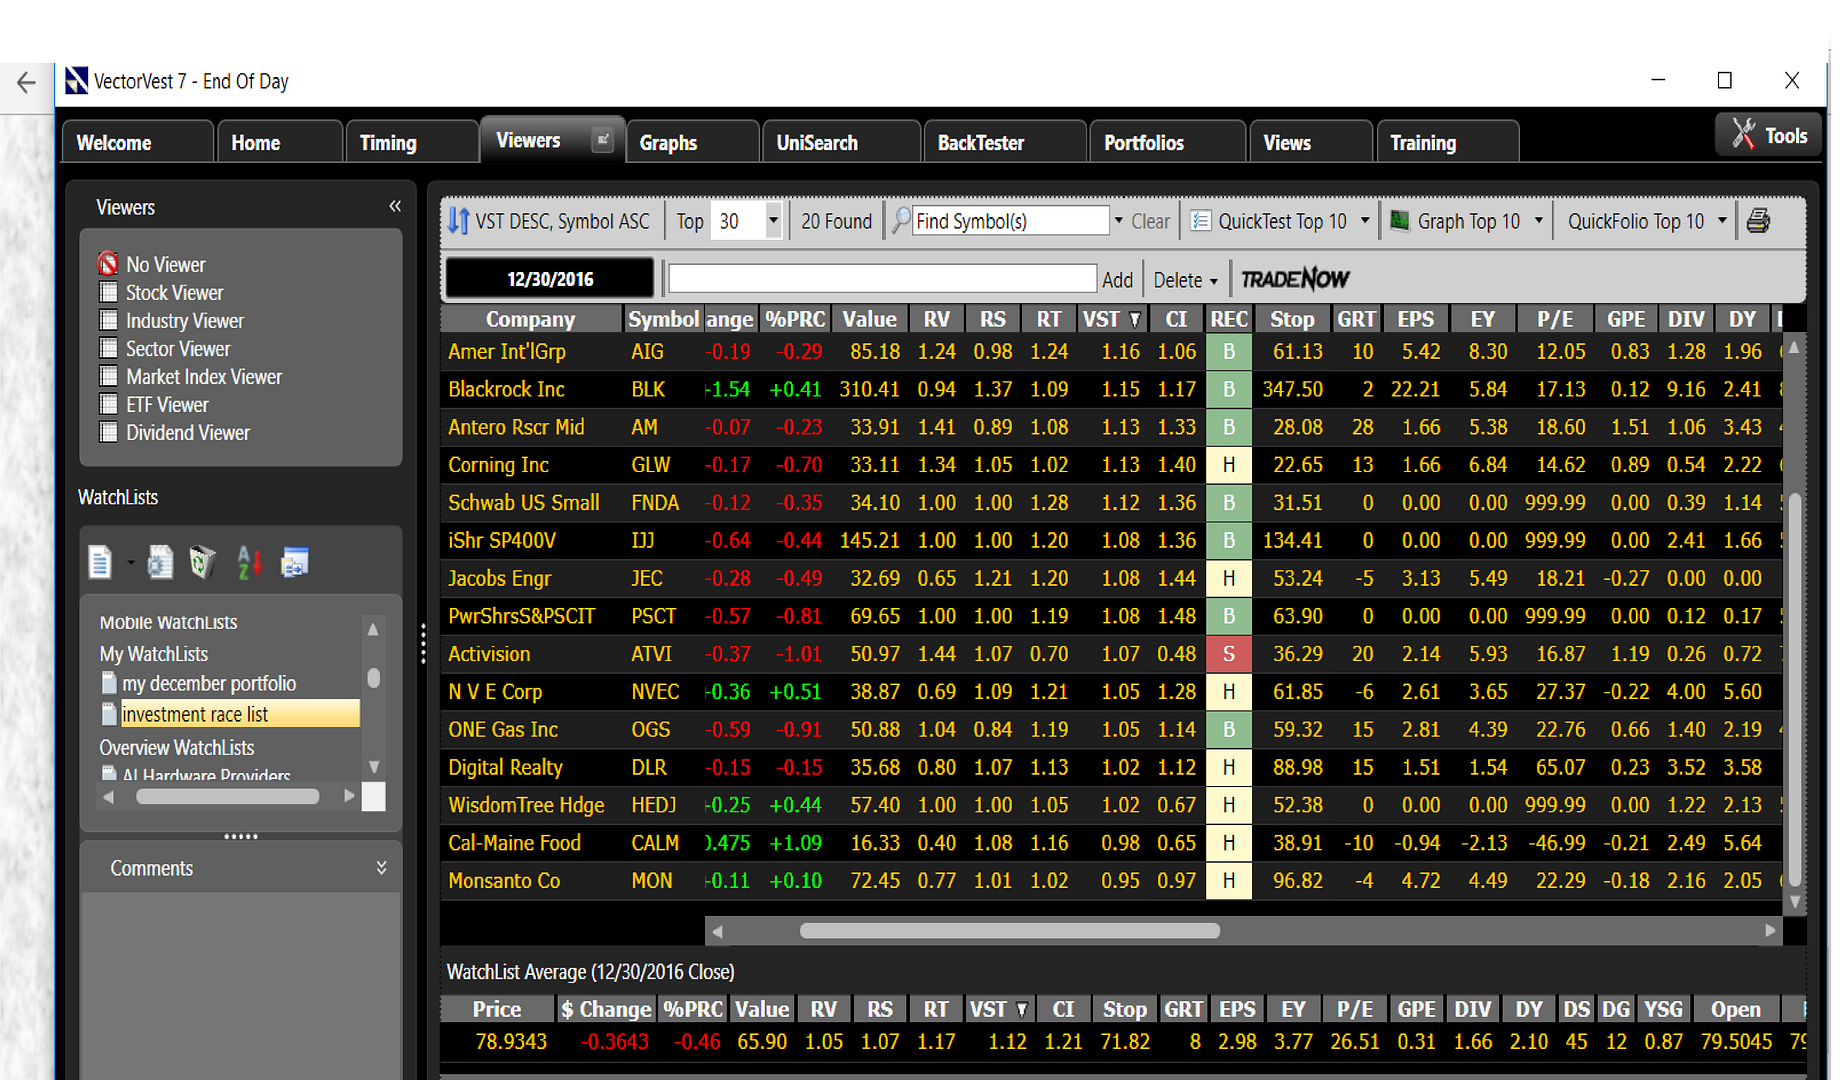
I made a portfolio in Vector Vest of the Investment race candidates entered so far. The majority have Buy ratings- VST should be above a 100
I thought it might be interesting to see how VV rated our selections- Notice that the recommended stops are generally quite wide- with the intent in this particular one approach in V V to capture longer term moves . Just taking a tour of the trial version.
|
|
|
|
Post by sd on Jan 6, 2017 16:19:53 GMT -5
Considered some of these for trade purchase today-Many of them are performing well 1-6-17 Went Long MON as it broke out higher. purchased CRUS, these are purchased from the member's horses, but for short term swing trades. /font]
|
|
|
|
Post by sd on Jan 7, 2017 13:01:26 GMT -5
Copied thread post: IS Buy and Hold the "Best" method for Investors?
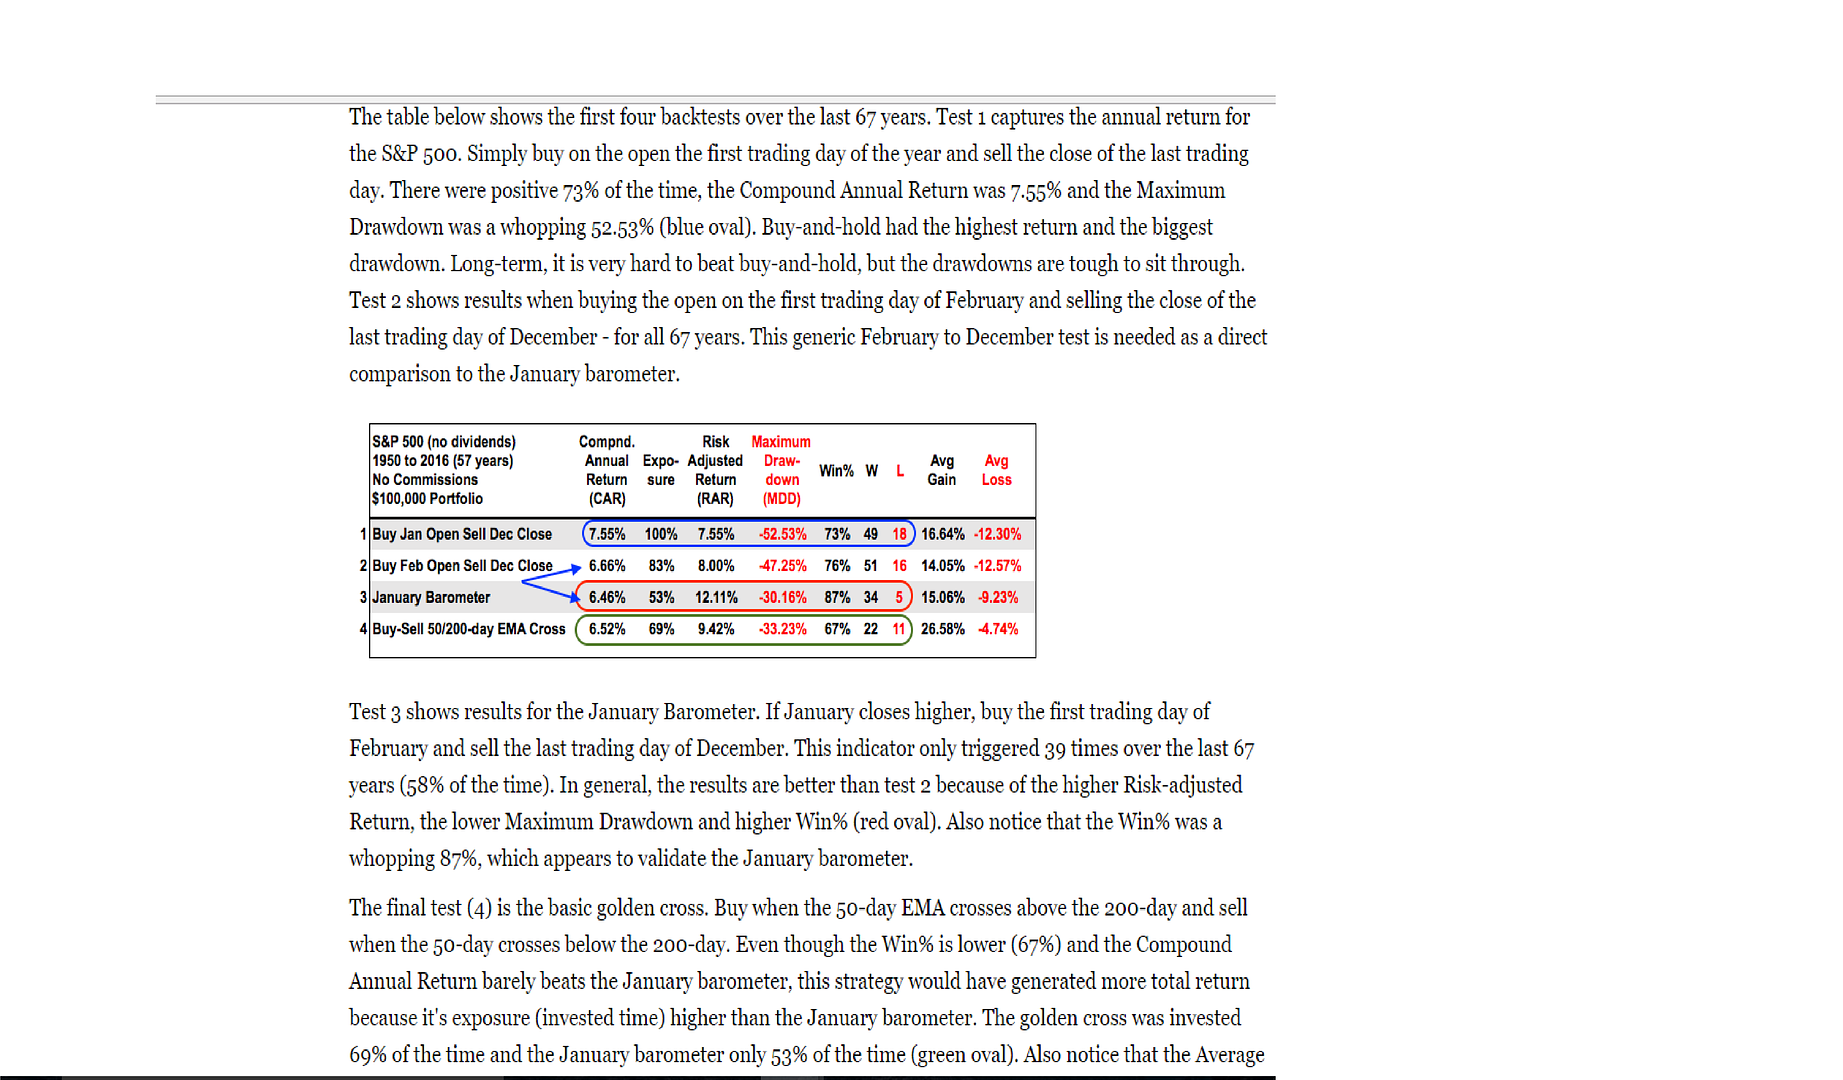
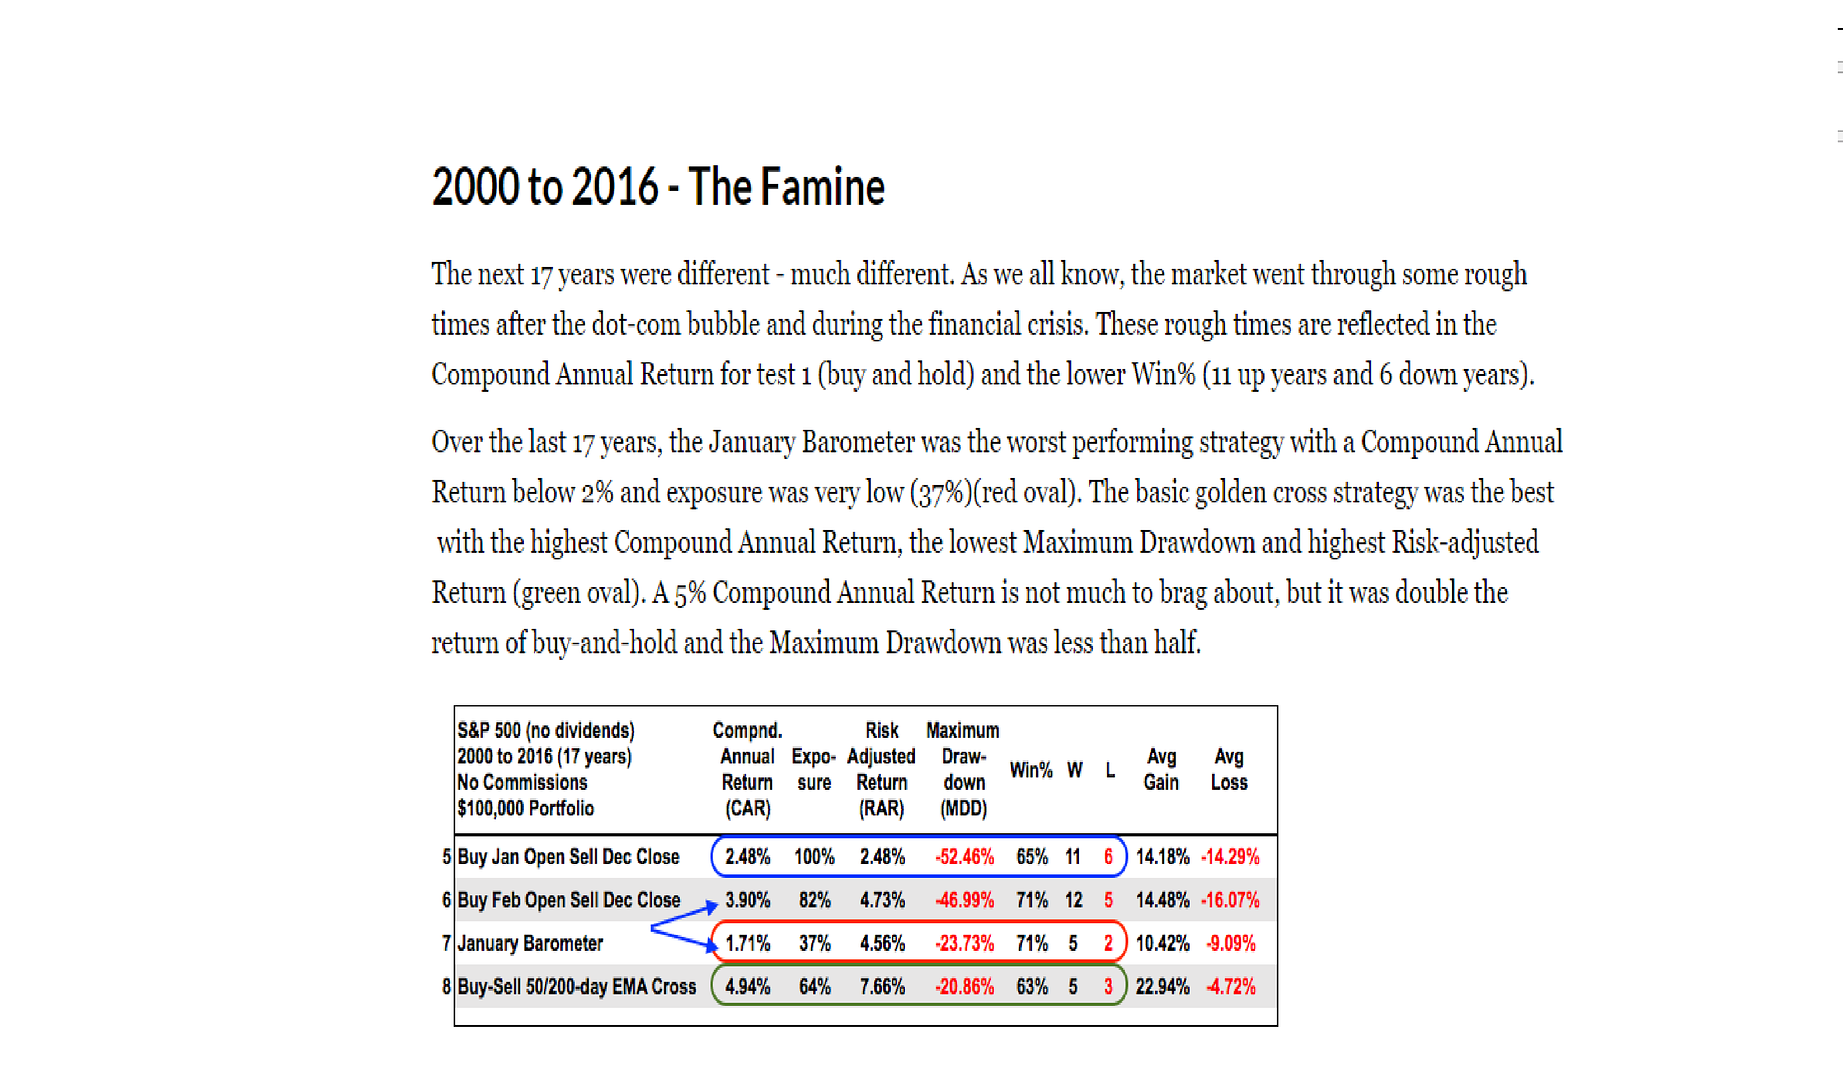
On Backtesting- Blygh had mentioned that in the 1990s he had done backtesting that confirmed that a Buy and Hold approach outperformed a technical method to signal exit and reentry. Arthur Hill did backtesting back to 1950, and also concluded that up through 2000, the buy and hold approach had the best overall annual average return- He compared results with 3 other testing methods- A Jan entry, A Feb entry, and a moving average crossover entry/exit using the 50/200 ema.
It needs to be noted that total return was not the only category compared- The win-loss ratio, the Max drawdown, the Risk adjusted return results- Average gain vs average loss-
I'm mostly interested in comparing the moving average crossover- 50/200 - because it provides a slightly smaller average return about 1% less in the 1950-2000 era, but take a note of the Higher Risk adjusted return, significantly lower drawdown 33% vs 52%,
the SpyBuy and Hold Avg gain + 16.64% Loss -12.30% drawdown -52% SPY Buy and hold Risk Adjusted return 7.55
The 50/200 cross Avg gain + 26.58% Loss -4.74 drawdown -33% 50/200 Risk Adjusted return 9.42
Total Return is not the entire story that an Investor needs to consider - The 50/200 cross strategy significantly reduced the drawdown and added a measure of stop-loss safety to the portfolio during this period, Reduced the overall Risk, also capturing higher % wins and lower % losses- This is worth noting, because it adds a measure of control over the investment based on trending components. (moving averages) .
From Stockcharts.com - Arthur Hill
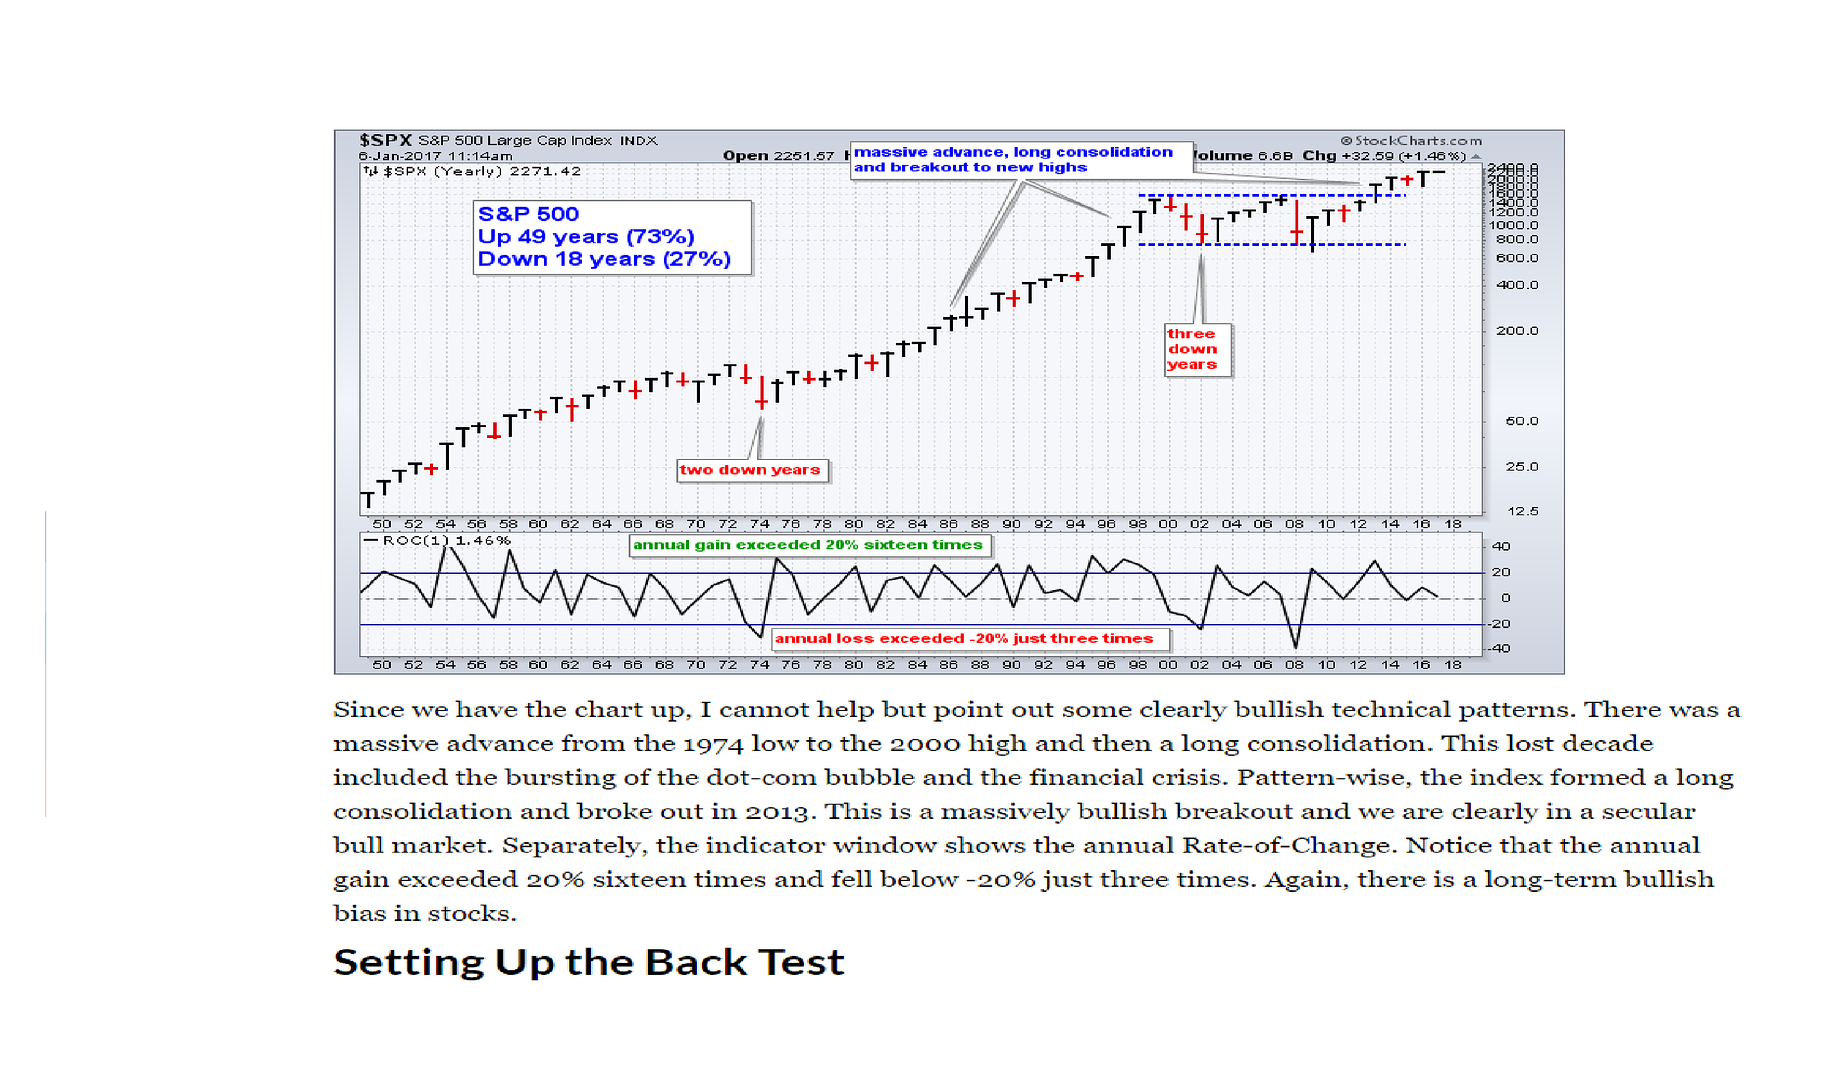
From 1999 to present day- the results are much different -lower average returns for the Buy and hold, higher drawdown, and the crossover strategy achieves higher returns with reduced Risk.
Consider that this is not a swing trading strategy, but is best suited for consideration that TA (technical analysis) variables may be an asset in improving the Risk- and possibly the net results in an Investment strategy-
Also consider that a typical Investment portfolio usually has a certain % allocated to Bonds to stabilize the portfolio - But in a low bond return environment, having an exit and entry strategy based on trend with the stock components might realize a better Risk return with an exit strategy.
There are certainly a lot of potential variables that could be tested- Different moving average crossovers, Exit on one, reentry on another- adding in another TA component - Stochastic indicator- MACD , PPO ......Earlier entry on a faster signal with a partial position, adding more to the position as
price crosses another threshold.
I will copy this over to the investment Race thread
|
|
|
|
Post by sd on Jan 8, 2017 11:18:10 GMT -5
|
|
|
|
Post by sd on Feb 10, 2017 20:13:25 GMT -5
fROM MY EMPLOYER SPONSORED FUND-
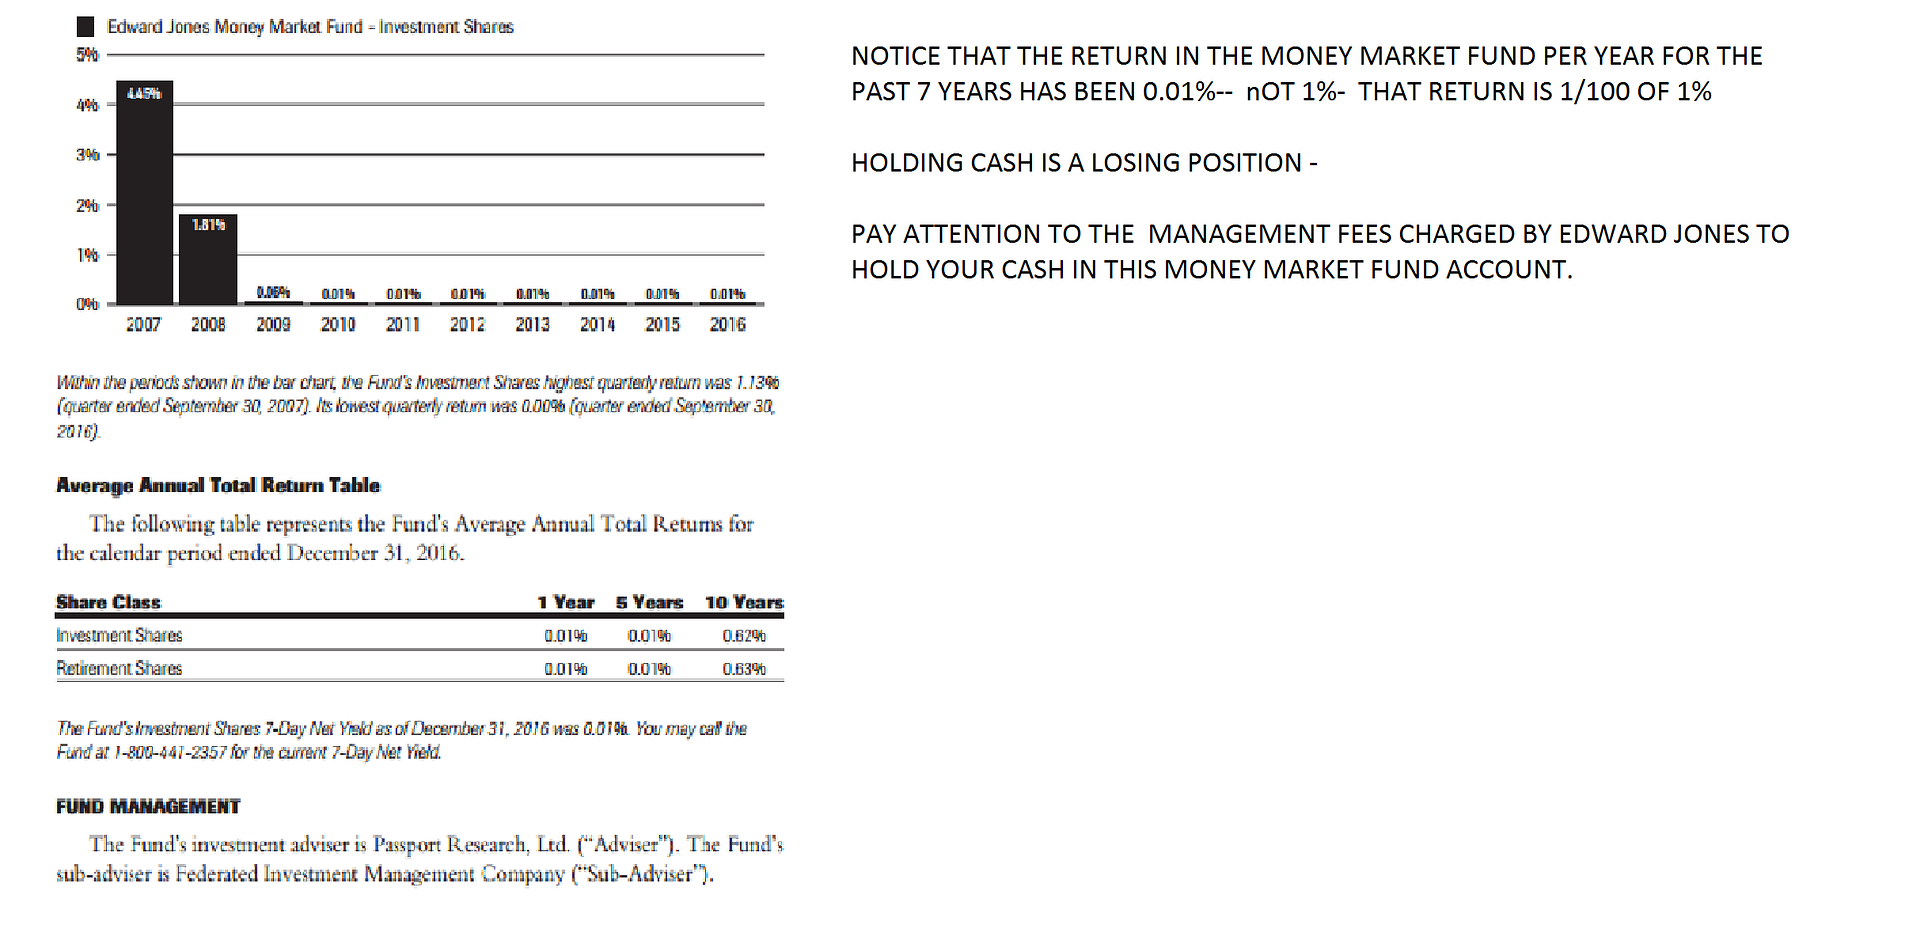
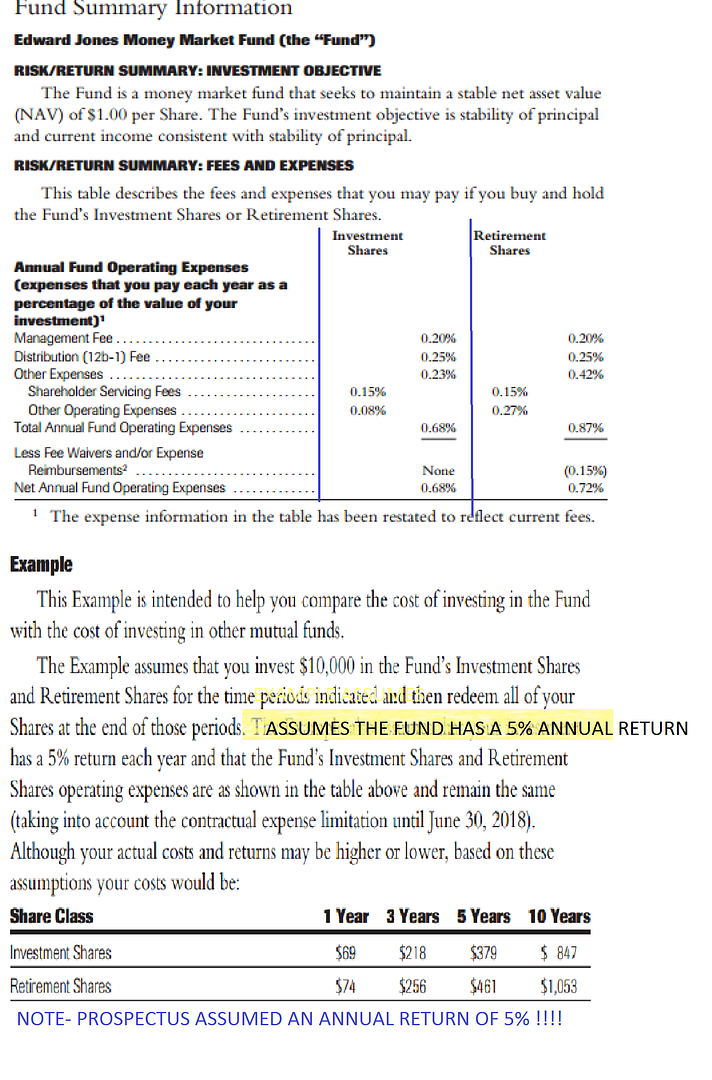
I received the prospectus on holding monies in a cash position- The prospectus assumes-states for comparison illustration.... that- IF the fund achieves an annual 5% return, the expenses would be..... And when you look at the return for each of the past 7 years, the fund return has not been 5%, has not been 1%, it has been 1/100th of 1% 0.01% return- and yet they justify charging 3/4 of 1% in annual fees- and charge the retirement account a higher fee than an investment account. This has to force investors to get into the market- keeping cash - between the fee the fund charges and the loss in purchasing power, cash is a losing proposition.
|
|
|
|
Post by sd on Feb 11, 2017 20:35:25 GMT -5
Portfolio Construction:
This link is part 1 of 4 from Trade station with David Stendahl outlining the value of a diversified portfolio with periodic rebalancing.
Note how this stabilizes the account and reduces the drawdown compared to that of a single investment- SPY
www.youtube.com/watch?v=QIxj8i9-1do
|
|
|
|
Post by sd on Feb 23, 2017 8:59:56 GMT -5
|
|
|
|
Post by sd on Mar 3, 2017 19:03:54 GMT -5
I had a call from my company sponsored IRA account through Edward Jones-
They had to terminate our prior arrangements and transferred our accounts into a different type of account- essentially because the old type of account was Not in compliance with the new Fiduciary standard- (I disagreeumption) . On the call I received this week- the Account rep proceeded to tell me that I would not be allowed to hold more than a 10% cash position due to the new standard wanting everyone to be fully invested- I expressed that the Gov't didn't have a right to tell me how large a % cash position i could have- but he assured me that i would need to put those cash dollars into funds- This did not sound exactly on the Up and Up - I contacted another financial adviser who said he had not heard of any such limitation- which leads me to the only conclusion- Since this Ed Jones is not a Fiduciary Adviser- he retains a Broker status- and he is only making money off of my invested monies-
This prompted me to contact Vanguard and get the Transfer paperwork to remove the cash segment out of Edward Jones and into a Vanguard IRA brokerage account- I have been intending to do this for a long time- but being given false information that seems self-serving by the broker is reason enough to be distrustful going forward.
Vanguard offers $7 trades for stocks and ETF's, and no commissions at all for Vanguard sponsored Etfs or Funds.
The goal of the Vanguard IRA Fund will be to trade infrequently, diversified ETF's with a periodic review to rebalance- Wider stop-losses - and Weekly charts as the primary view-
If the 50day to 200 day is relevant for the daily, it compares to the 10/40 ema on a weekly - Good starting point to evaluate.
This is one off those things i intended to get around to when I had plenty of Time on my hands....LOL!
|
|
|
|
Post by sd on Mar 5, 2017 9:22:25 GMT -5
Active management comes with higher costs than passive index investing-
Going through some of the portfolio models, I found this Mid Cap- Go Away in May into Bonds, and out of Bonds and back into Mid cap in October-strategy looks interesting as a method that is simple to replicate, and primarily because it retained and did not lose in the 2008 market sell-off,
it's equity curve and compunded results by missing that period of market decline , it's net outperformance over the past 15 years-
Assuming we may have another future decline in the market eventually, it is worth while to consider a strategy that does not just go to cash as defense, but goes into bonds and captures upside in the decline. Note- the net results deduct a possible 3% charge between commissions and fees.
The individual could implement this strategy on their own for greatly reduced fees.
To see more of this longer term strategy, As a Part of a larger diversified portfolio-
www.alphaim.net/mid_cap_power_index_brochure.pdf
www.alphaim.net/mid_cap_power_index_brochure.pdf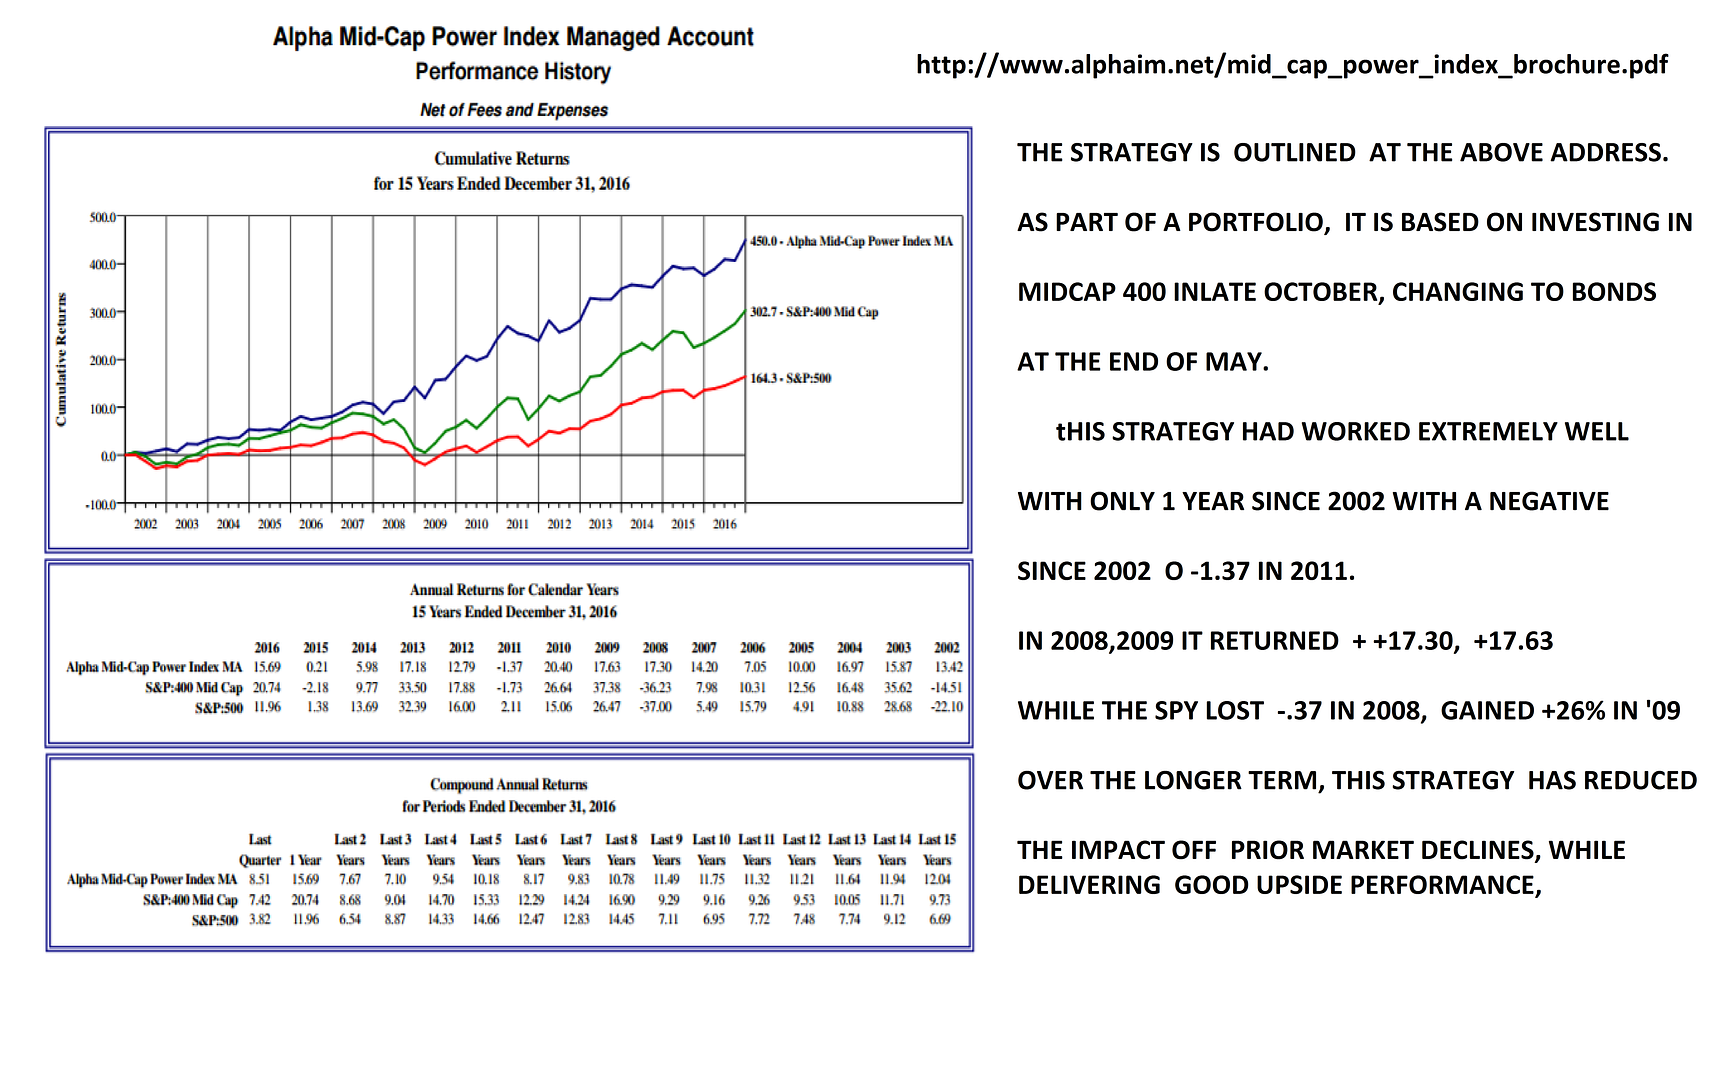
|
|
|
|
Post by sd on Apr 2, 2017 18:38:12 GMT -5
The quarter is up- I'm unable to get the charts posted today on the quarter- Hope to get it done later this week
|
|
|
|
Post by tiarra on Apr 2, 2017 19:12:03 GMT -5
I have AM as being 33.16 not 23.16... I can't believe the way MON has gone up.
SORRY ABOUT THAT Tiarra -I will correct
Blygh
|
|
|
|
Post by sd on May 6, 2017 7:40:17 GMT -5
|
|
|
|
Post by sd on May 13, 2017 19:16:46 GMT -5
Understanding the new Fiduciary Standard for 2017.
Anyone that has an investment component- perhaps through their Employer or self-directed- may find that the new standard requiring firms to act as a Fiduciary - The investors interests come 1st- has big impacts on how some firms have managed your retirement assets. This should not be ignored- You should not assume that your account with your employer can be assumed to be in your best interests after all.
The new law requires transparency of fees charged- As an example, Our company account is managed through Edward jones. They previously had our accounts limited to exposure to Sun America funds- Undoubtedly there was a 'relationship " there whereby they benefited-aside from the commissions charged-and service fees.
In our company's account, The Adviser informed me that we can no longer access and make self directed changes to the account- asset allocation etc. Instead, we will now be able to make investments in stocks or ETFs as we choose- with no trading fees- Just a 1% annual fee on our account balance-
For myself, I will continue to invest into the company account to get the employer % match, but i transferred the majority of the account into a Vanguard IRA brokerage account where i will likely use Vanguard ETF's in a diversified portfolio- Either way, i was not inclined to 'pay' a 1% fee to have someone else execute my trades.
Don't take your Employer's fund for granted- look into it , the costs, and your options. If there are high expenses, you can transfer directly - no taxes or penalties- some or all
of that account into a Fiduciary holder -such as Vanguard...
Options for those that do not want to manage their own account, don't have the time , etc, can opt to have Vanguard managed accounts for a .30 fee or select from a Target Date Fund account...
In the end- Eliminating higher costs will put more $$$ into the investor's account over the long term.
|
|